

Integrating a genome-wide association study with a large-scale transcriptome analysis to predict genetic regions influencing the glycaemic index and texture in rice
- PMID: 30549178
- PMCID: PMC6575982
- DOI: 10.1111/pbi.13051
Integrating a genome-wide association study with a large-scale transcriptome analysis to predict genetic regions influencing the glycaemic index and texture in rice
Abstract
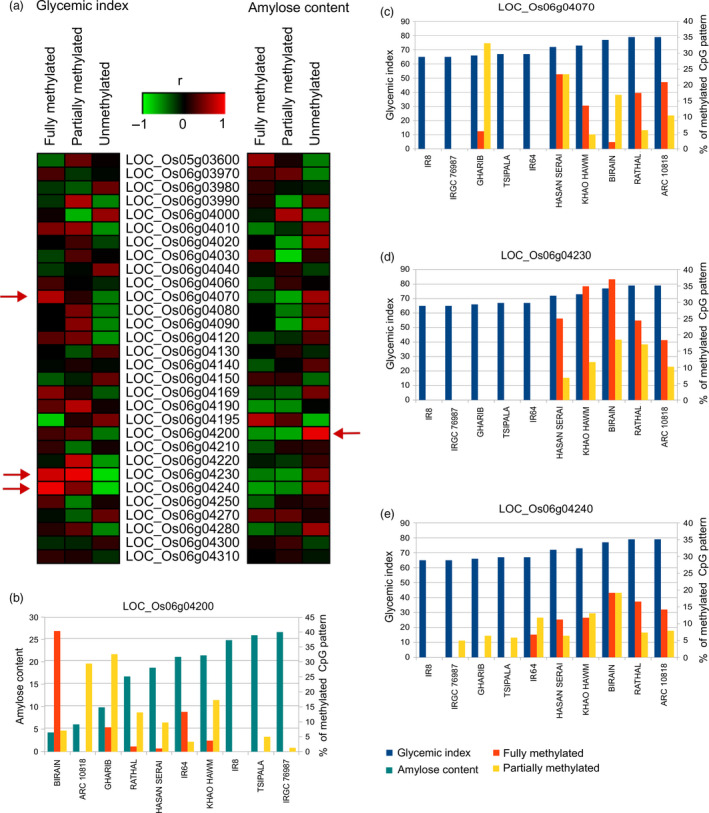
Reliably generating rice varieties with low glycaemic index (GI) is an important nutritional intervention given the high rates of Type II diabetes incidences in Asia where rice is staple diet. We integrated a genome-wide association study (GWAS) with a transcriptome-wide association study (TWAS) to determine the genetic basis of the GI in rice. GWAS utilized 305 re-sequenced diverse indica panel comprising ~2.4 million single nucleotide polymorphisms (SNPs) enriched in genic regions. A novel association signal was detected at a synonymous SNP in exon 2 of LOC_Os05g03600 for intermediate-to-high GI phenotypic variation. Another major hotspot region was predicted for contributing intermediate-to-high GI variation, involves 26 genes on chromosome 6 (GI6.1). These set of genes included GBSSI, two hydrolase genes, genes involved in signalling and chromatin modification. The TWAS and methylome sequencing data revealed cis-acting functionally relevant genetic variants with differential methylation patterns in the hot spot GI6.1 region, narrowing the target to 13 genes. Conversely, the promoter region of GBSSI and its alternative splicing allele (G allele of Wxa ) explained the intermediate-to-high GI variation. A SNP (C˃T) at exon-10 was also highlighted in the preceding analyses to influence final viscosity (FV), which is independent of amylose content/GI. The low GI line with GC haplotype confirmed soft texture, while other two low GI lines with GT haplotype were characterized as hard and cohesive. The low GI lines were further confirmed through clinical in vivo studies. Gene regulatory network analysis highlighted the role of the non-starch polysaccharide pathway in lowering GI.
Keywords: final viscosity; gene-regulatory network analysis; genome-wide association study; glycaemic index; transcriptome-wide association study; whole-genome bisulfite sequencing.
© 2018 The Authors. Plant Biotechnology Journal published by Society for Experimental Biology and The Association of Applied Biologists and John Wiley & Sons Ltd.
Conflict of interest statement
The authors declare no conflict of interest.
Figures


Similar articles
-
Nucleotide diversity in starch synthase IIa and validation of single nucleotide polymorphisms in relation to starch gelatinization temperature and other physicochemical properties in rice (Oryza sativa L.).Theor Appl Genet. 2006 Nov;113(7):1171-83. doi: 10.1007/s00122-006-0355-6. Epub 2006 Jul 19. Theor Appl Genet. 2006. PMID: 16850313
-
Multiomics of a rice population identifies genes and genomic regions that bestow low glycemic index and high protein content.Proc Natl Acad Sci U S A. 2024 Sep 3;121(36):e2410598121. doi: 10.1073/pnas.2410598121. Epub 2024 Aug 27. Proc Natl Acad Sci U S A. 2024. PMID: 39190344 Free PMC article.
-
Genome-Wide Association Study of Root System Development at Seedling Stage in Rice.Genes (Basel). 2020 Nov 25;11(12):1395. doi: 10.3390/genes11121395. Genes (Basel). 2020. PMID: 33255557 Free PMC article.
-
Rice with a healthier glycaemic profile: Unveiling the molecular mechanisms and breeding strategies for the future.Plant Physiol Biochem. 2025 Apr;221:109543. doi: 10.1016/j.plaphy.2025.109543. Epub 2025 Feb 1. Plant Physiol Biochem. 2025. PMID: 39952157 Review.
-
Insights into Recent Updates on Factors and Technologies That Modulate the Glycemic Index of Rice and Its Products.Foods. 2023 Oct 4;12(19):3659. doi: 10.3390/foods12193659. Foods. 2023. PMID: 37835312 Free PMC article. Review.
Cited by
-
Balancing the double-edged sword effect of increased resistant starch content and its impact on rice texture: its genetics and molecular physiological mechanisms.Plant Biotechnol J. 2020 Aug;18(8):1763-1777. doi: 10.1111/pbi.13339. Epub 2020 Feb 11. Plant Biotechnol J. 2020. PMID: 31945237 Free PMC article.
-
Rice Compounds with Impact on Diabetes Control.Foods. 2021 Aug 25;10(9):1992. doi: 10.3390/foods10091992. Foods. 2021. PMID: 34574099 Free PMC article. Review.
-
The Genetic Basis and Nutritional Benefits of Pigmented Rice Grain.Front Genet. 2020 Mar 13;11:229. doi: 10.3389/fgene.2020.00229. eCollection 2020. Front Genet. 2020. PMID: 32231689 Free PMC article. Review.
-
GWAS for Starch-Related Parameters in Japonica Rice (Oryza sativa L.).Plants (Basel). 2019 Aug 19;8(8):292. doi: 10.3390/plants8080292. Plants (Basel). 2019. PMID: 31430915 Free PMC article.
-
GWAS Atlas: an updated knowledgebase integrating more curated associations in plants and animals.Nucleic Acids Res. 2023 Jan 6;51(D1):D969-D976. doi: 10.1093/nar/gkac924. Nucleic Acids Res. 2023. PMID: 36263826 Free PMC article.
References
-
- Adkins, N.L. , Hagerman, T.A. and Georgel, P. (2006) GAGA protein: a multi‐faceted transcription factor This paper is one of a selection of papers published in this Special Issue, entitled 27th International West Coast Chromatin and Chromosome Conference, and has undergone the Journal's usual peer review process. Biochem. Cell Biol., 84, 558–567. - PubMed
-
- Balding, D.J. and Nichols, R.A. (1995) A method for quantifying differentiation between populations at multi‐allelic loci and its implications for investigating identity and paternity. Genetica, 96, 3–12. - PubMed
-
- Brand‐Miller, J.C. (2003) Glycemic load and chronic disease. Nutr. Rev. 61, S49–S55. - PubMed
Publication types
MeSH terms
LinkOut - more resources
Full Text Sources
Miscellaneous
