Review
. 2018 Dec 26;118(24):11707-11794.
doi: 10.1021/acs.chemrev.8b00333. Epub 2018 Dec 14.

Genetically Encoded Fluorescent Biosensors Illuminate the Spatiotemporal Regulation of Signaling Networks

Affiliations
Review

Genetically Encoded Fluorescent Biosensors Illuminate the Spatiotemporal Regulation of Signaling Networks

Eric C Greenwald et al. Chem Rev. .

Abstract

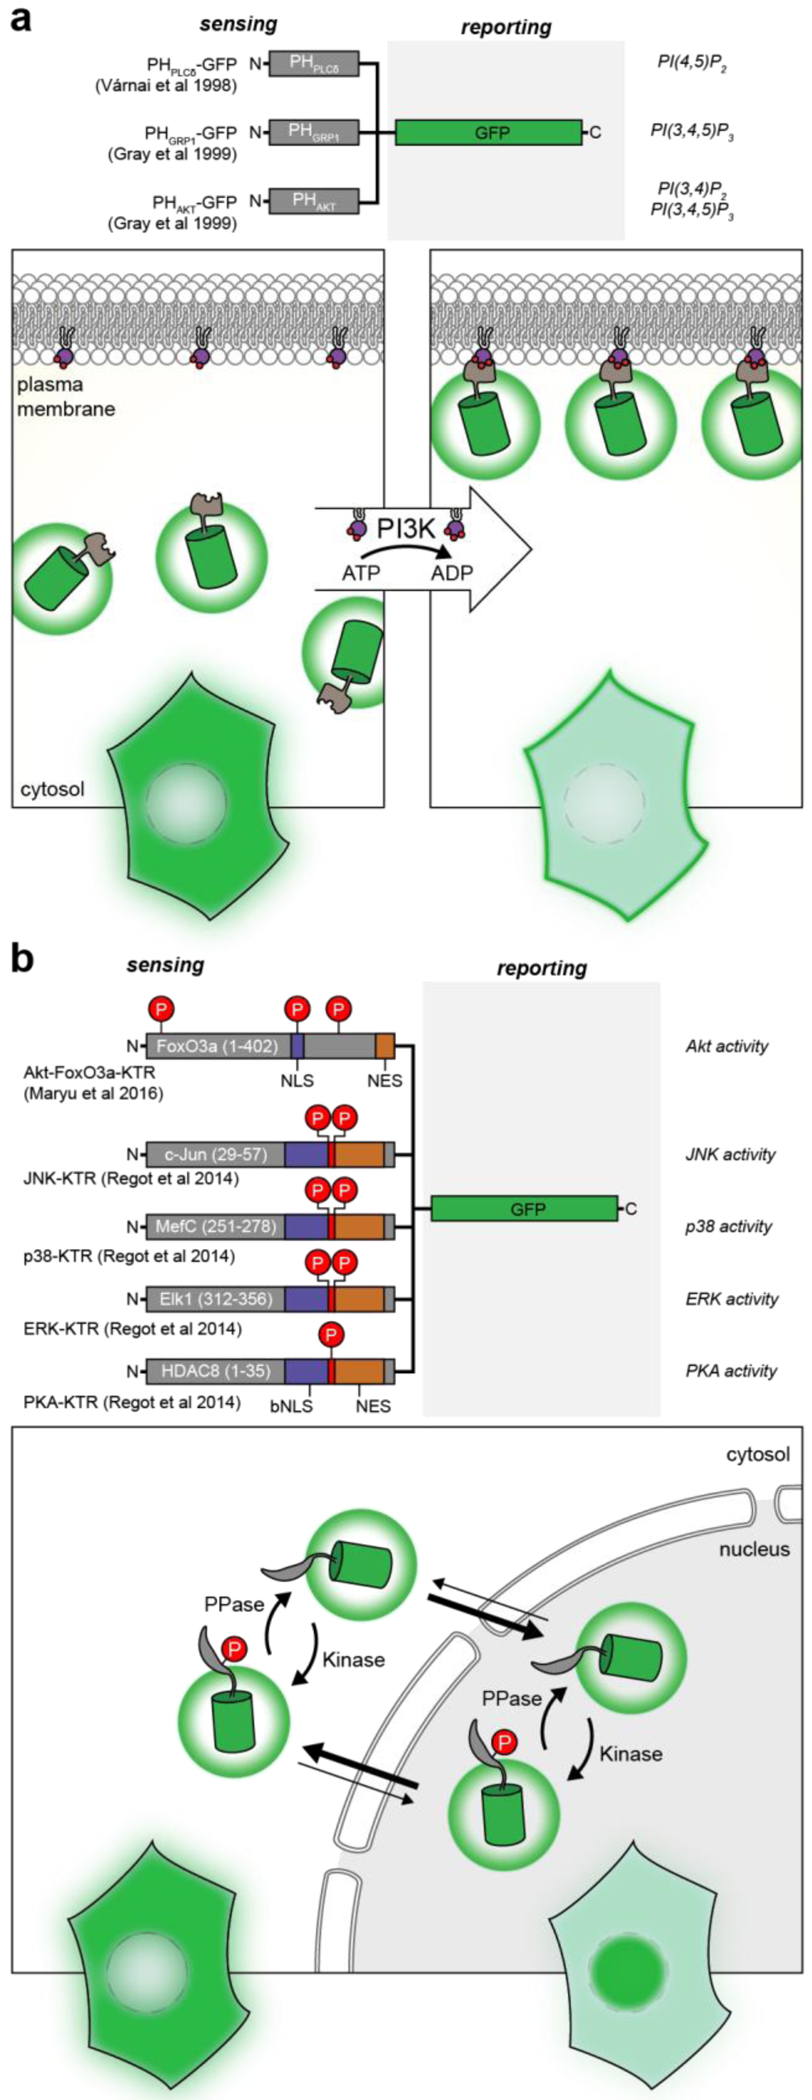
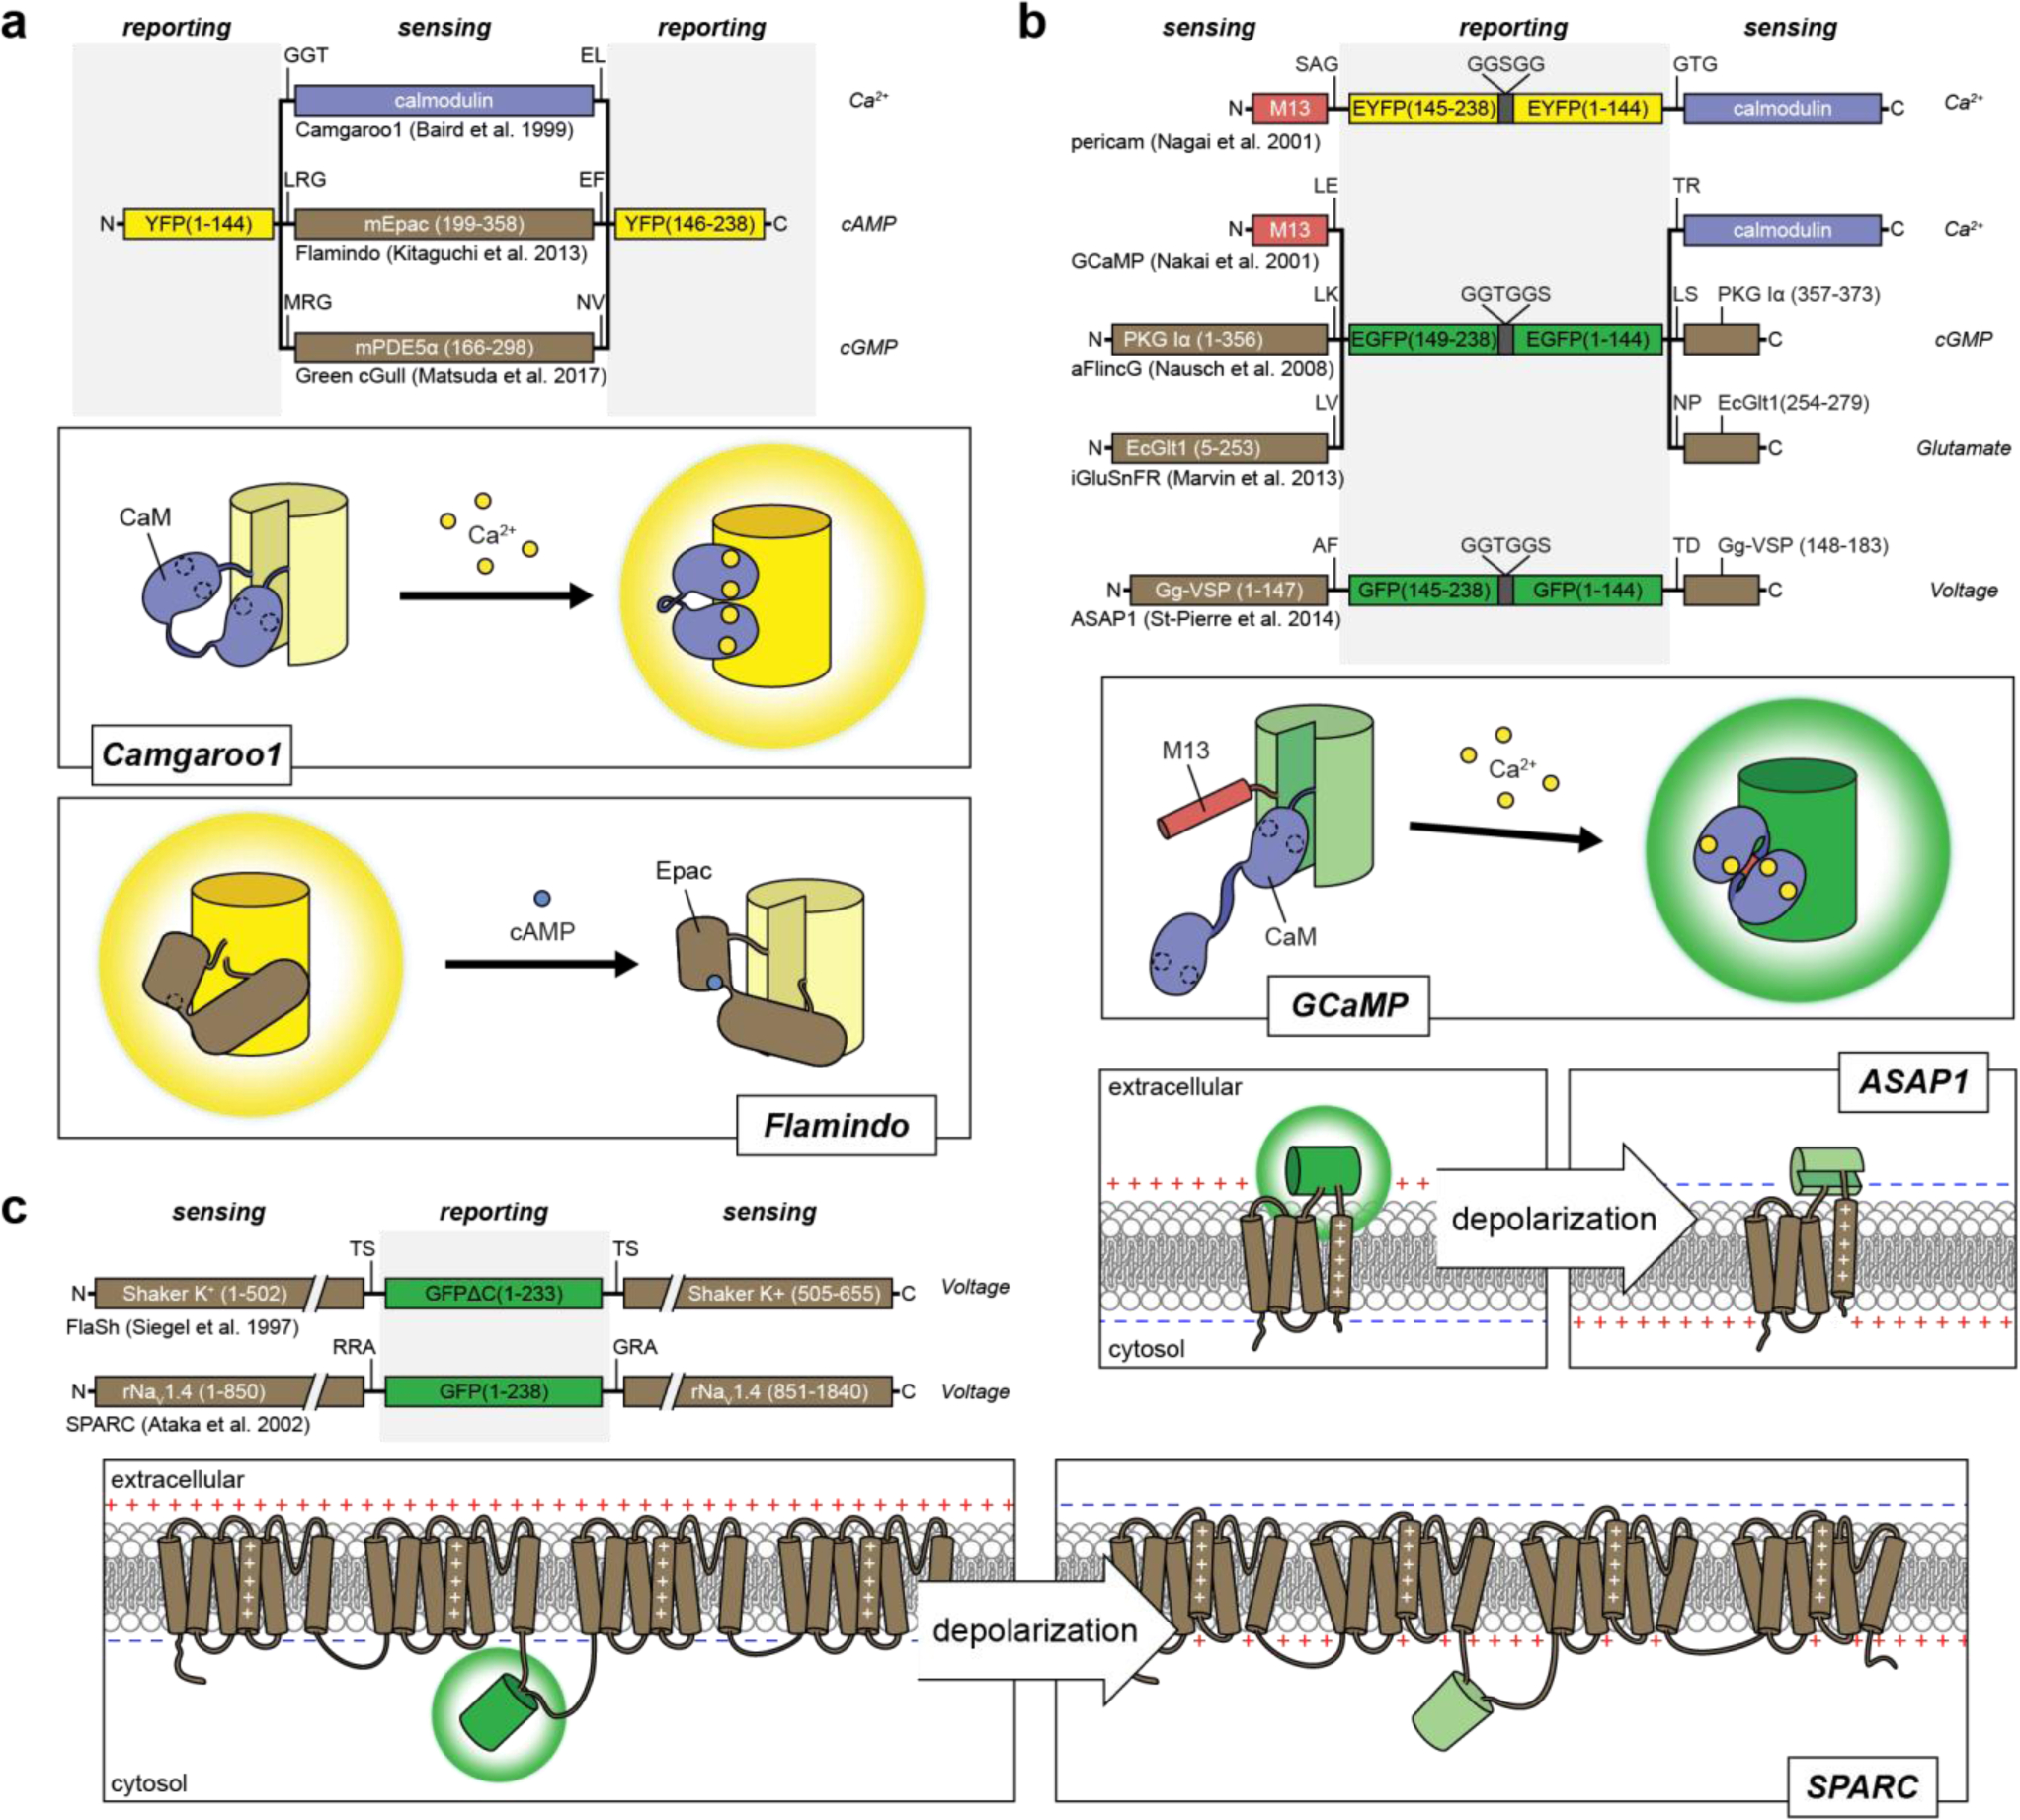
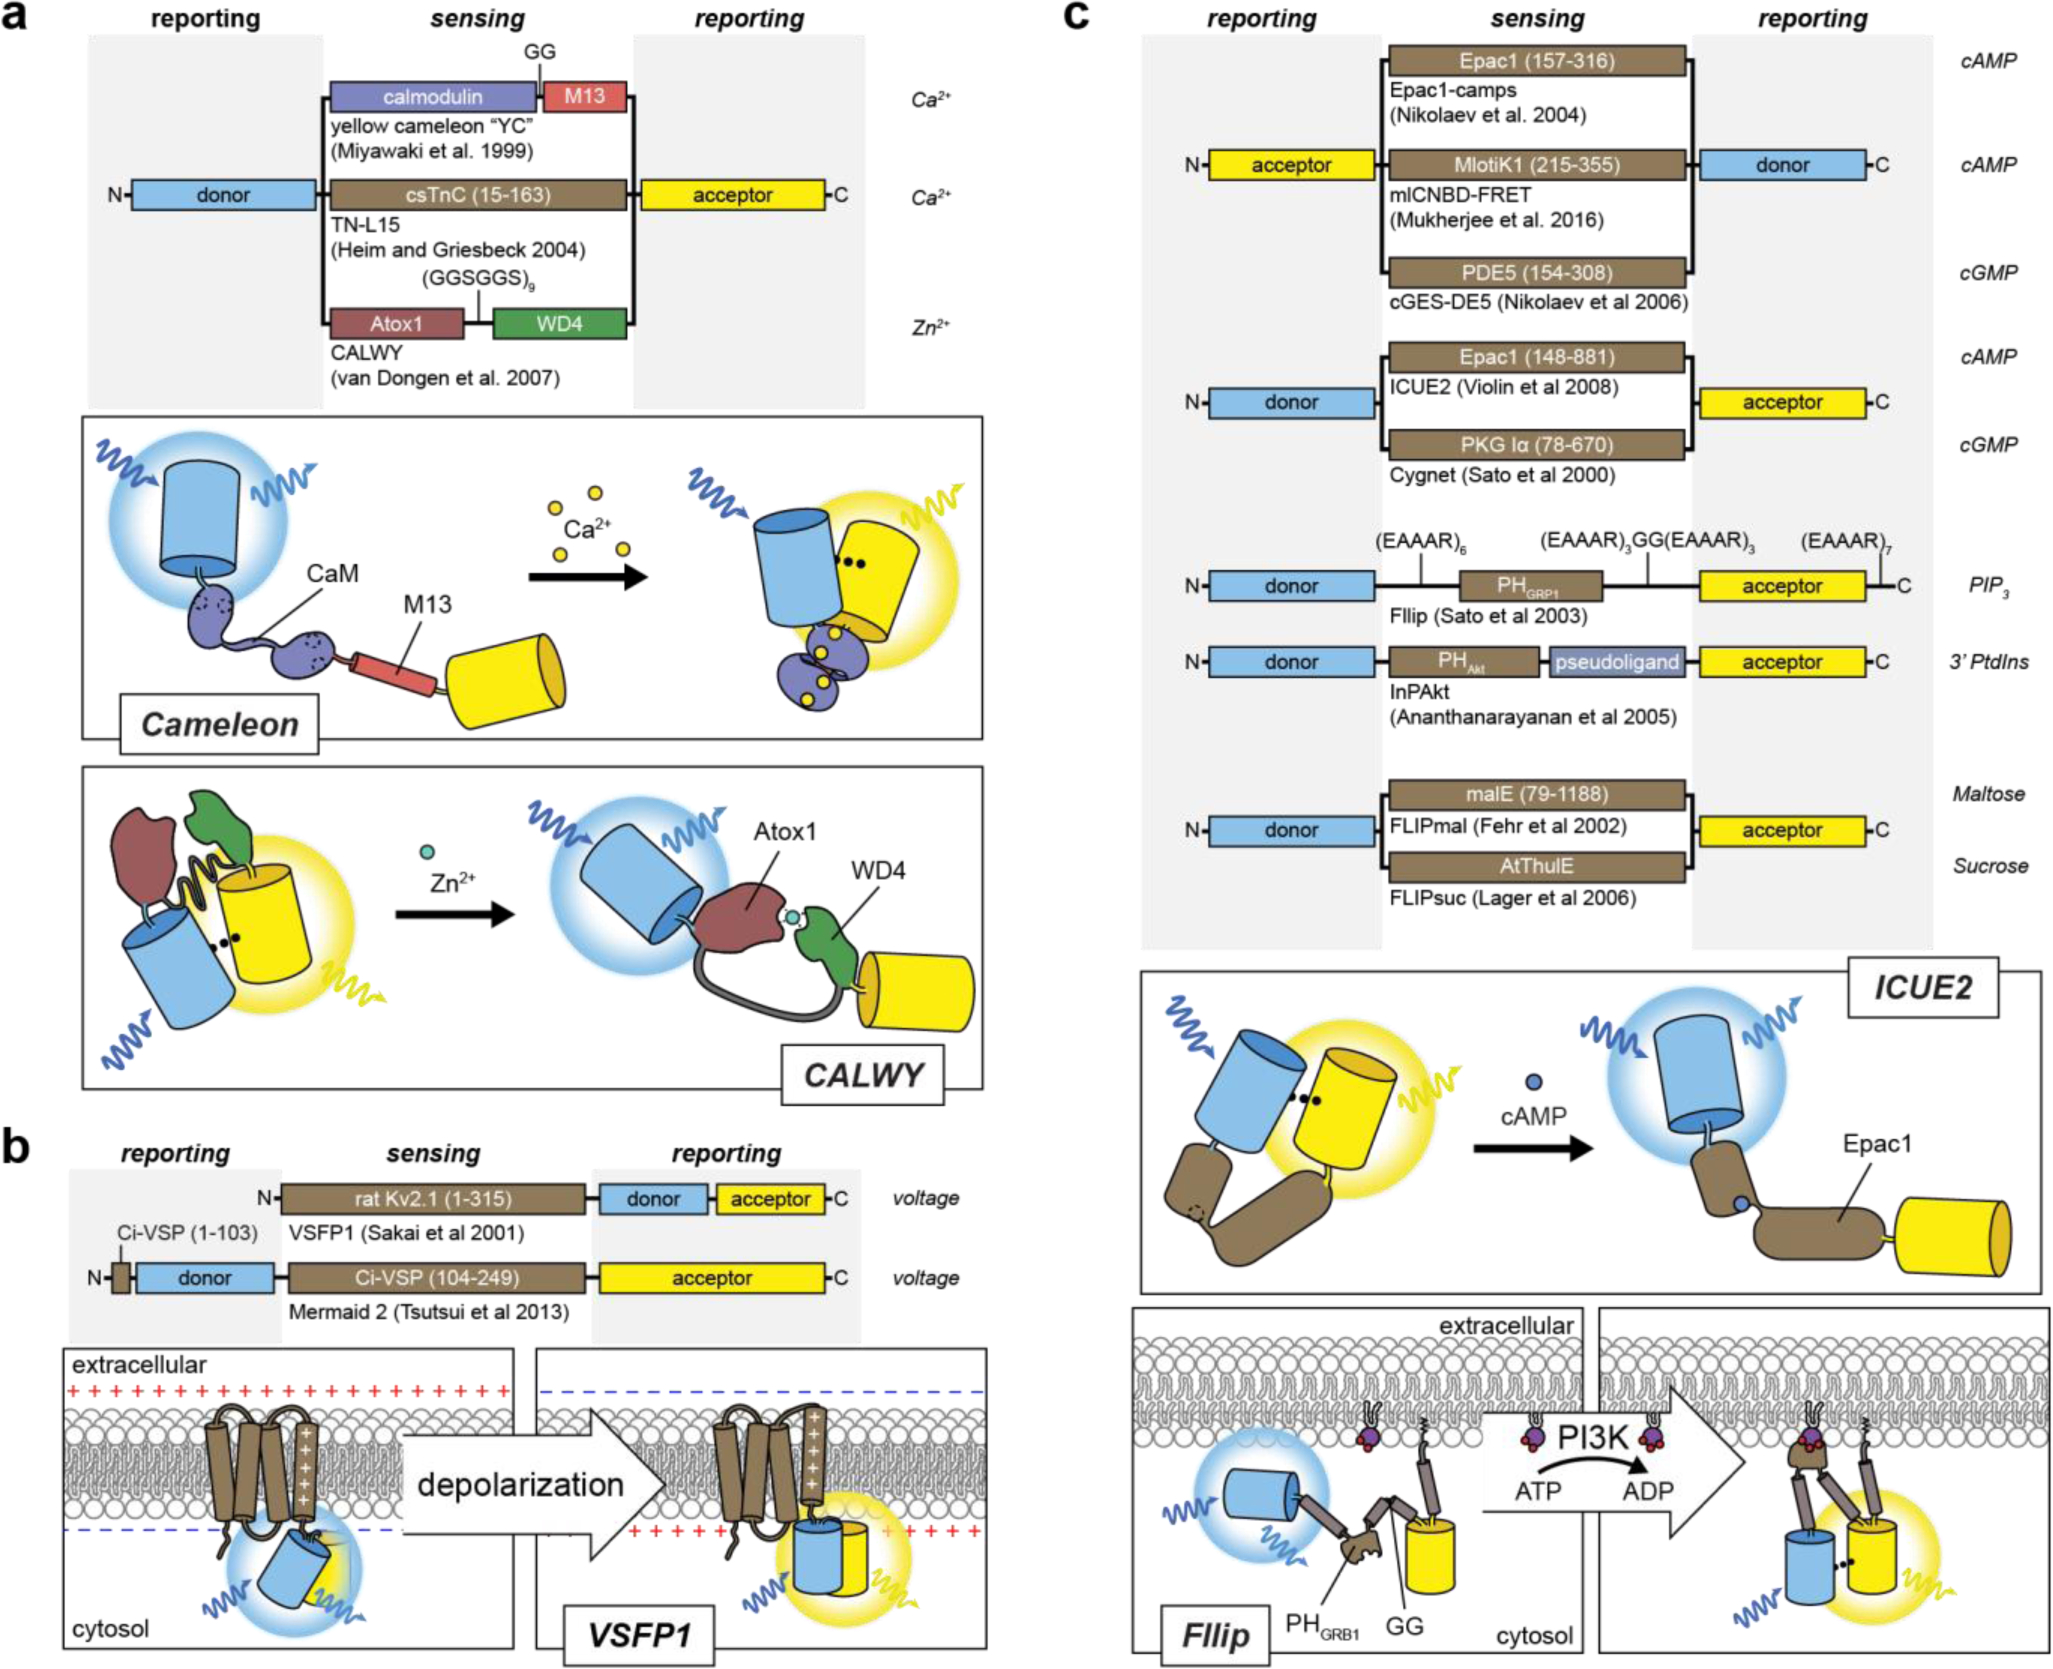
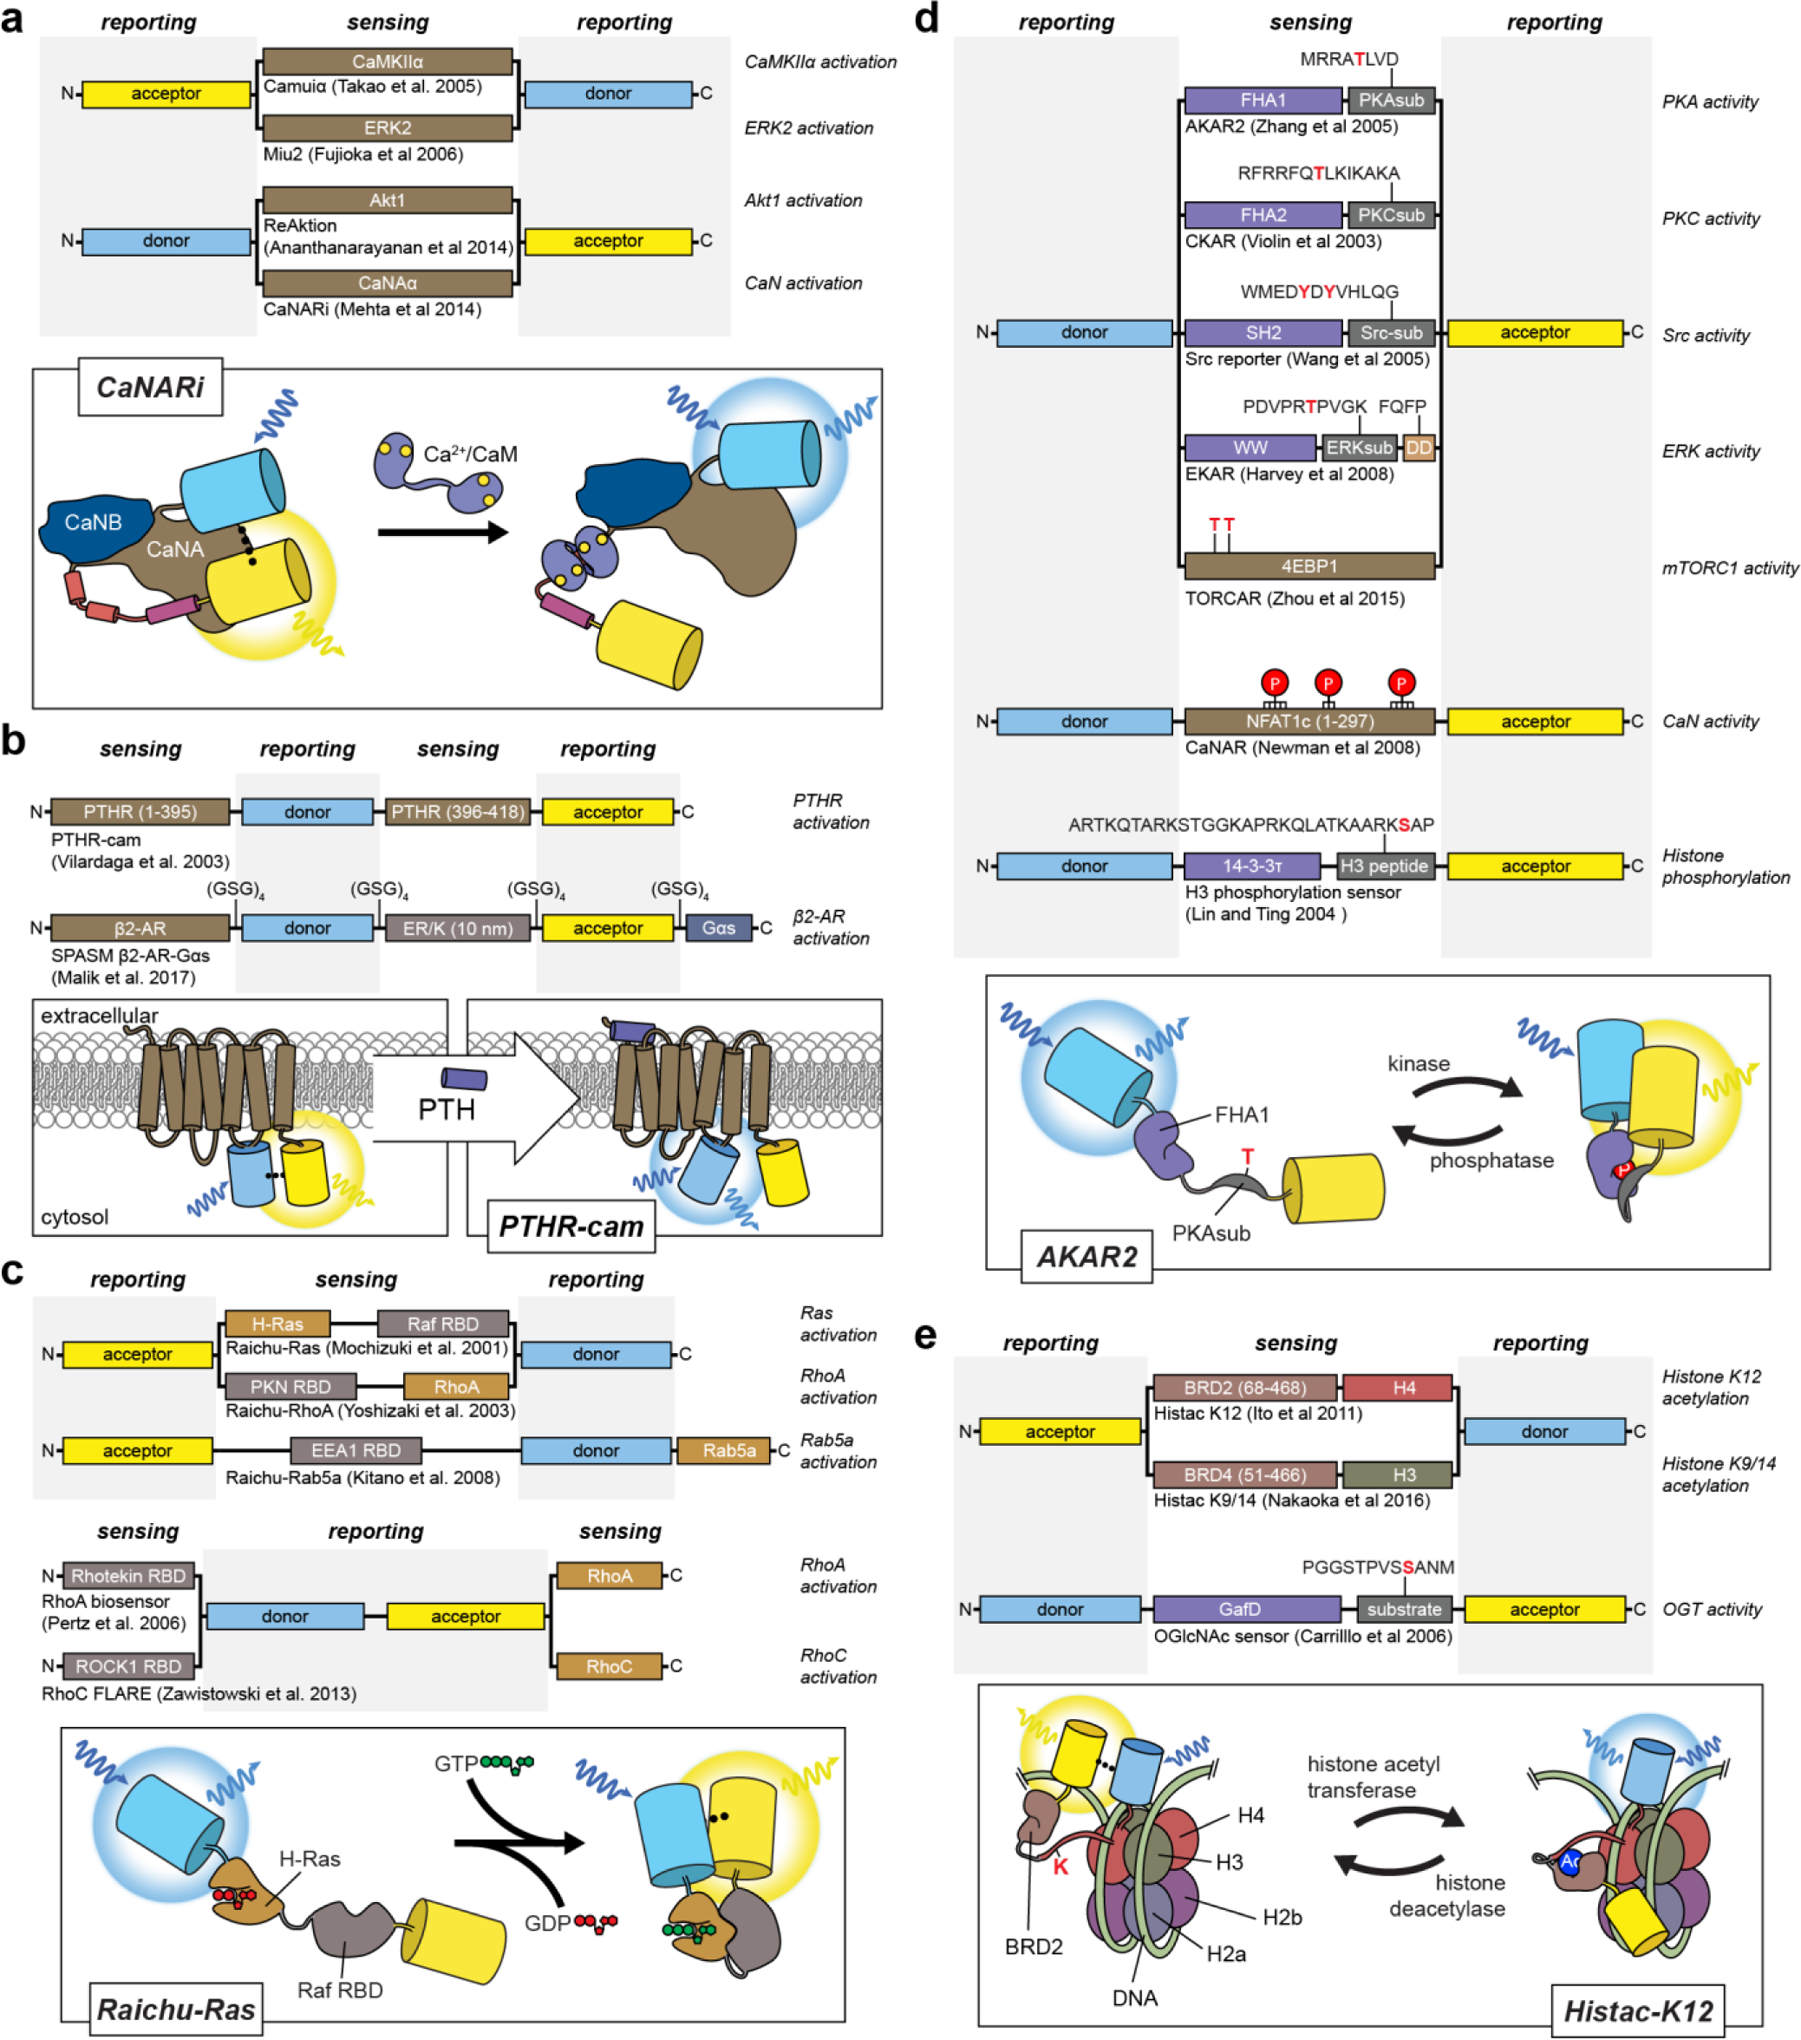
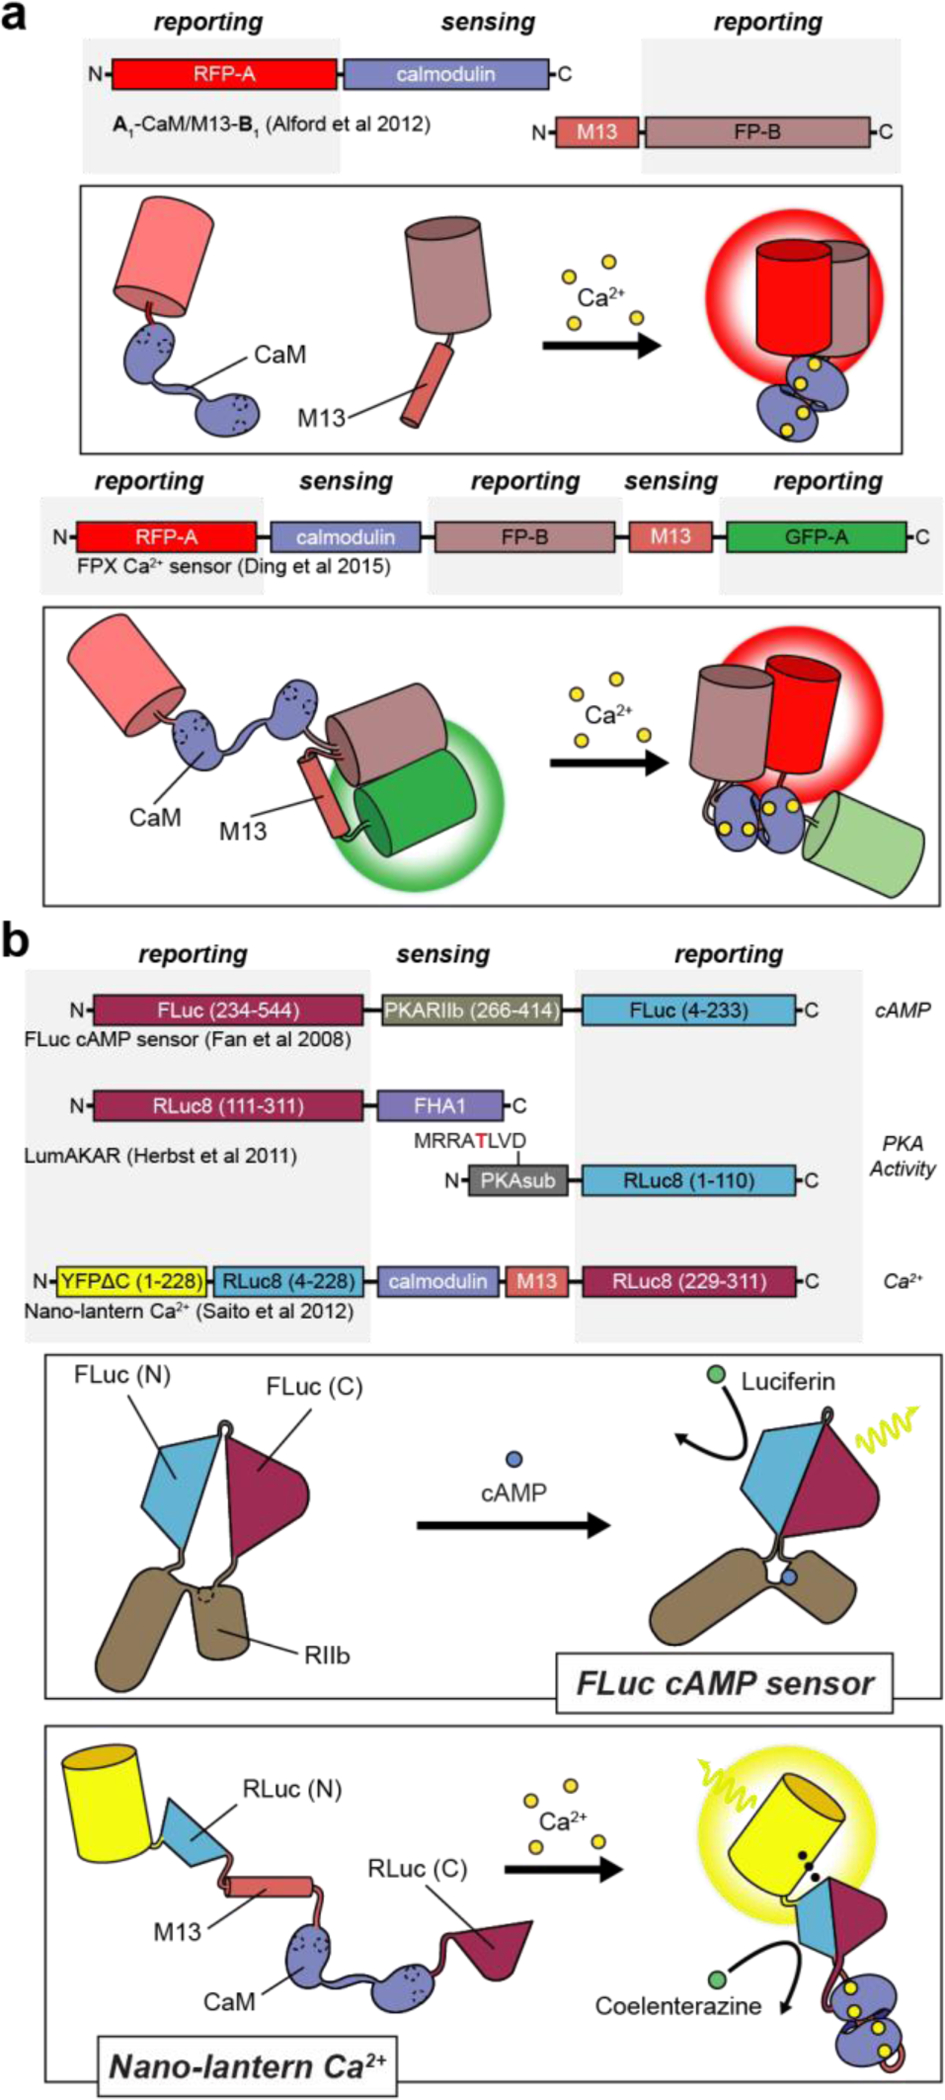
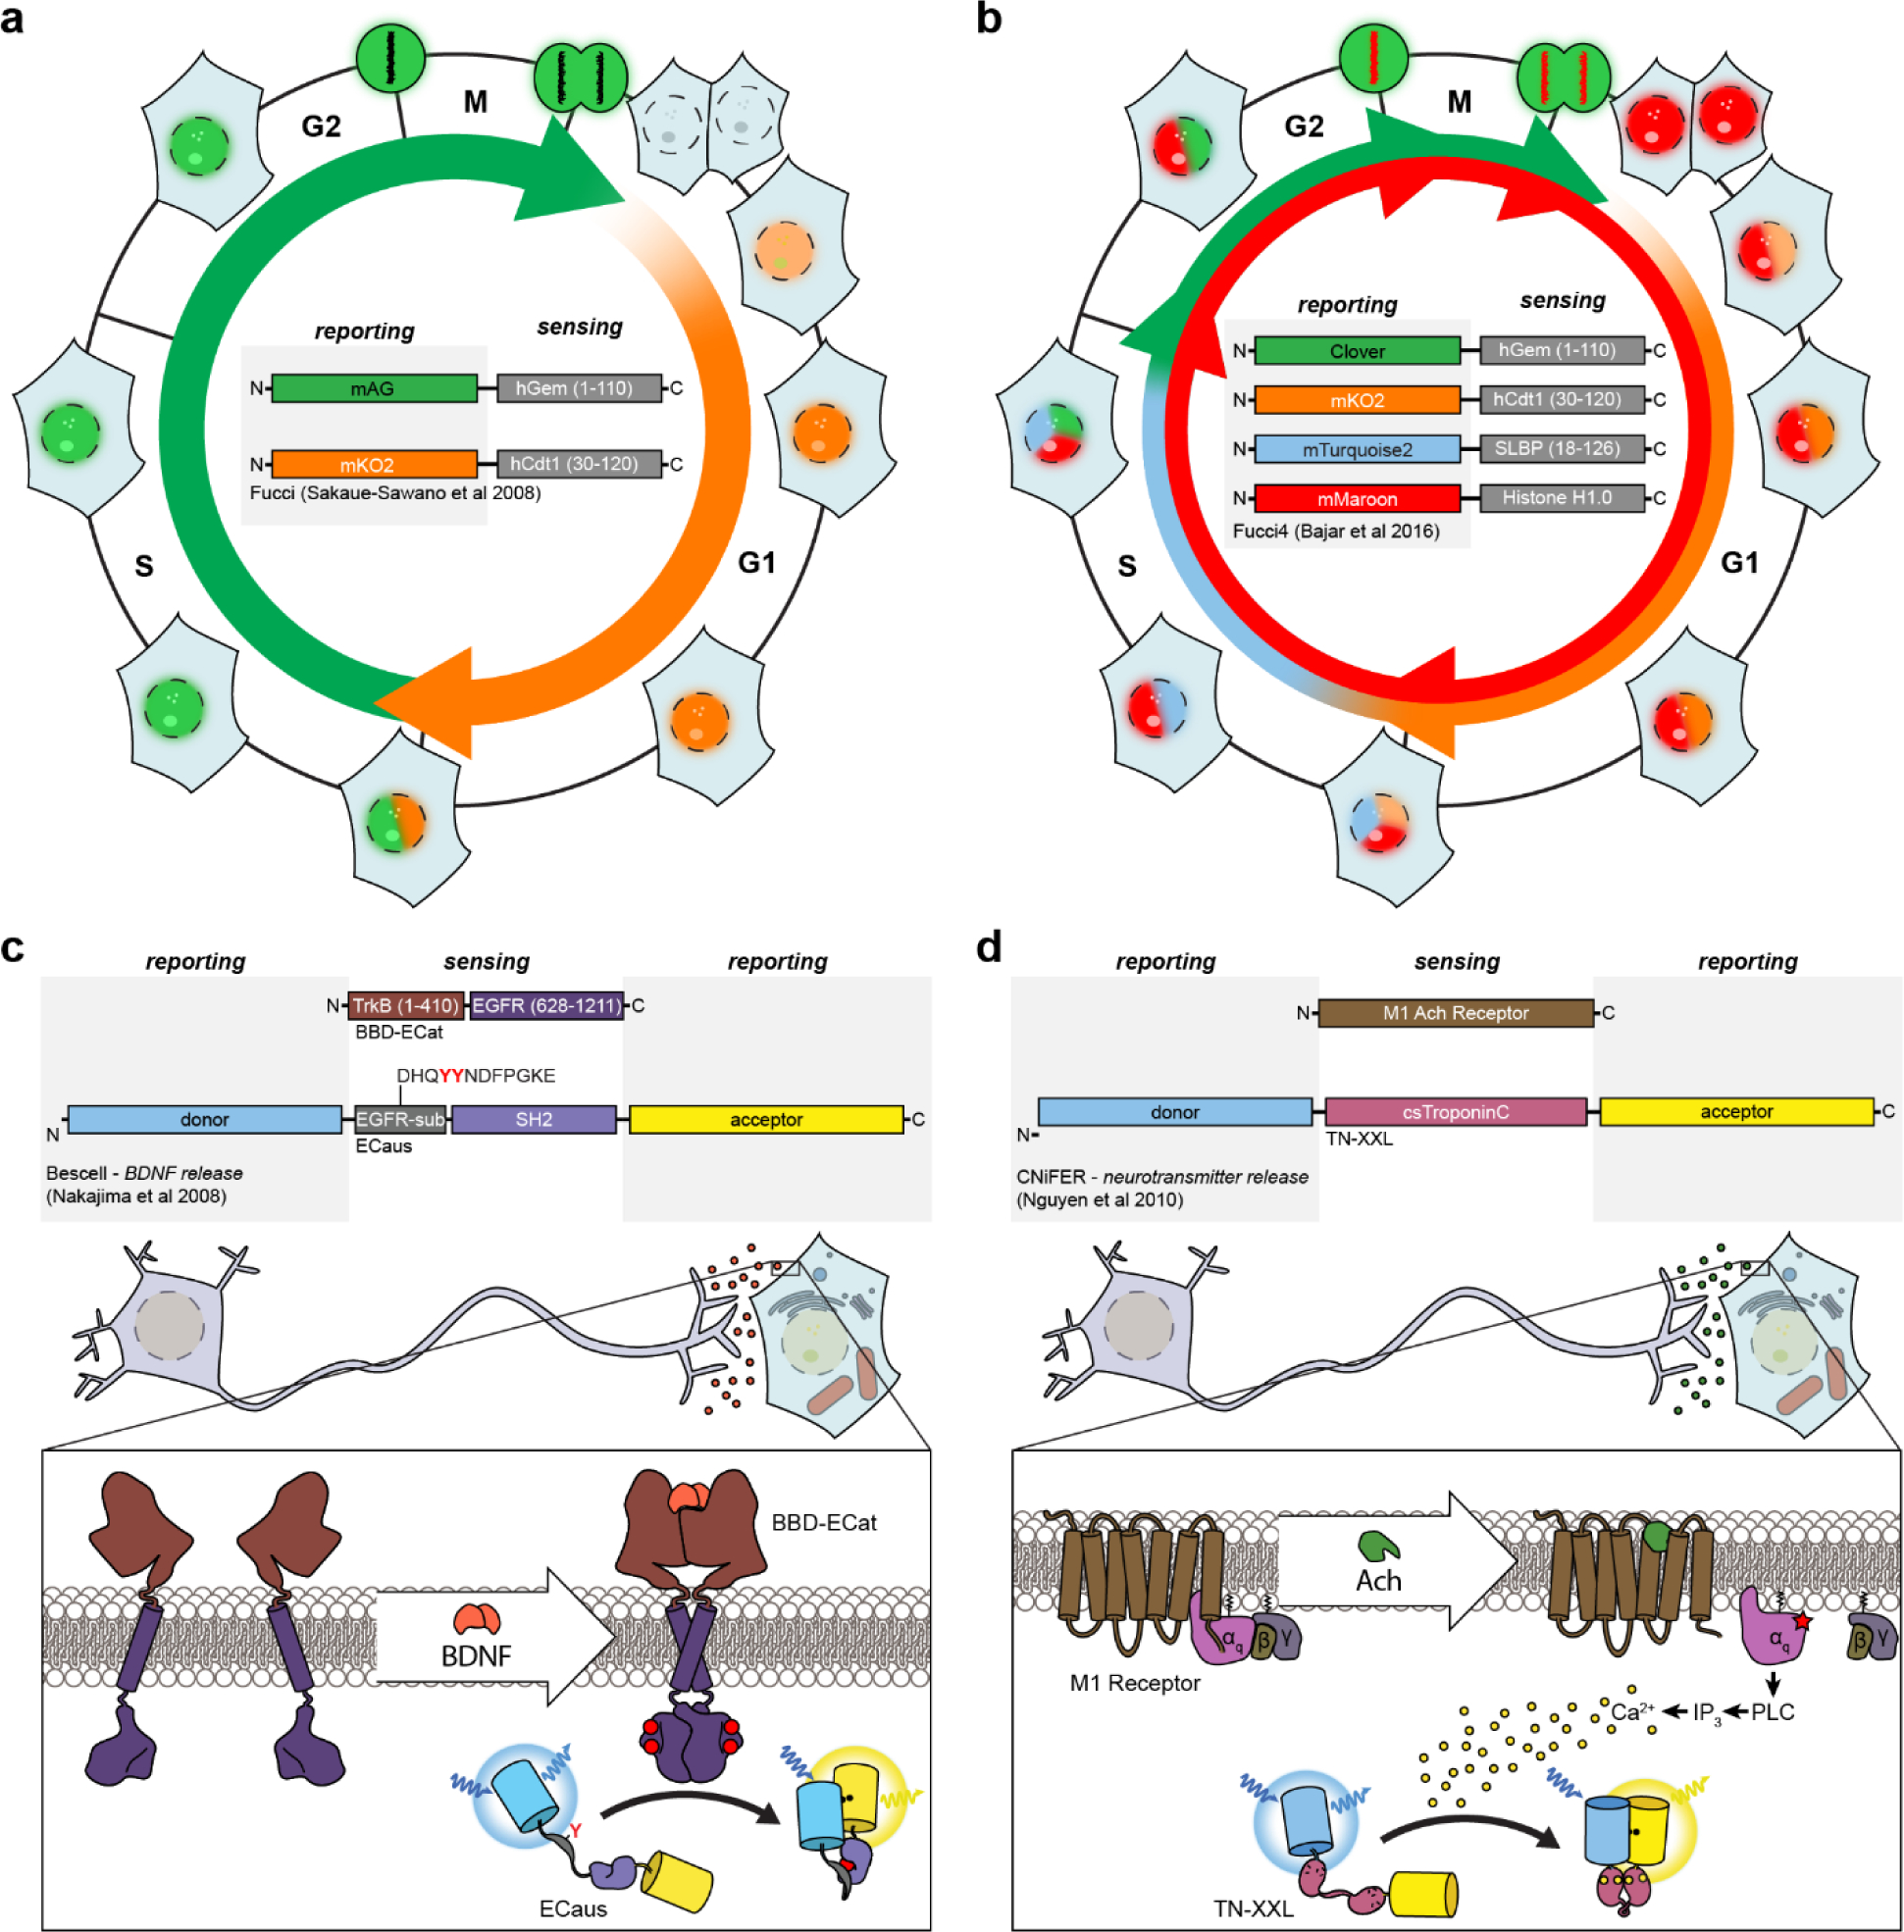
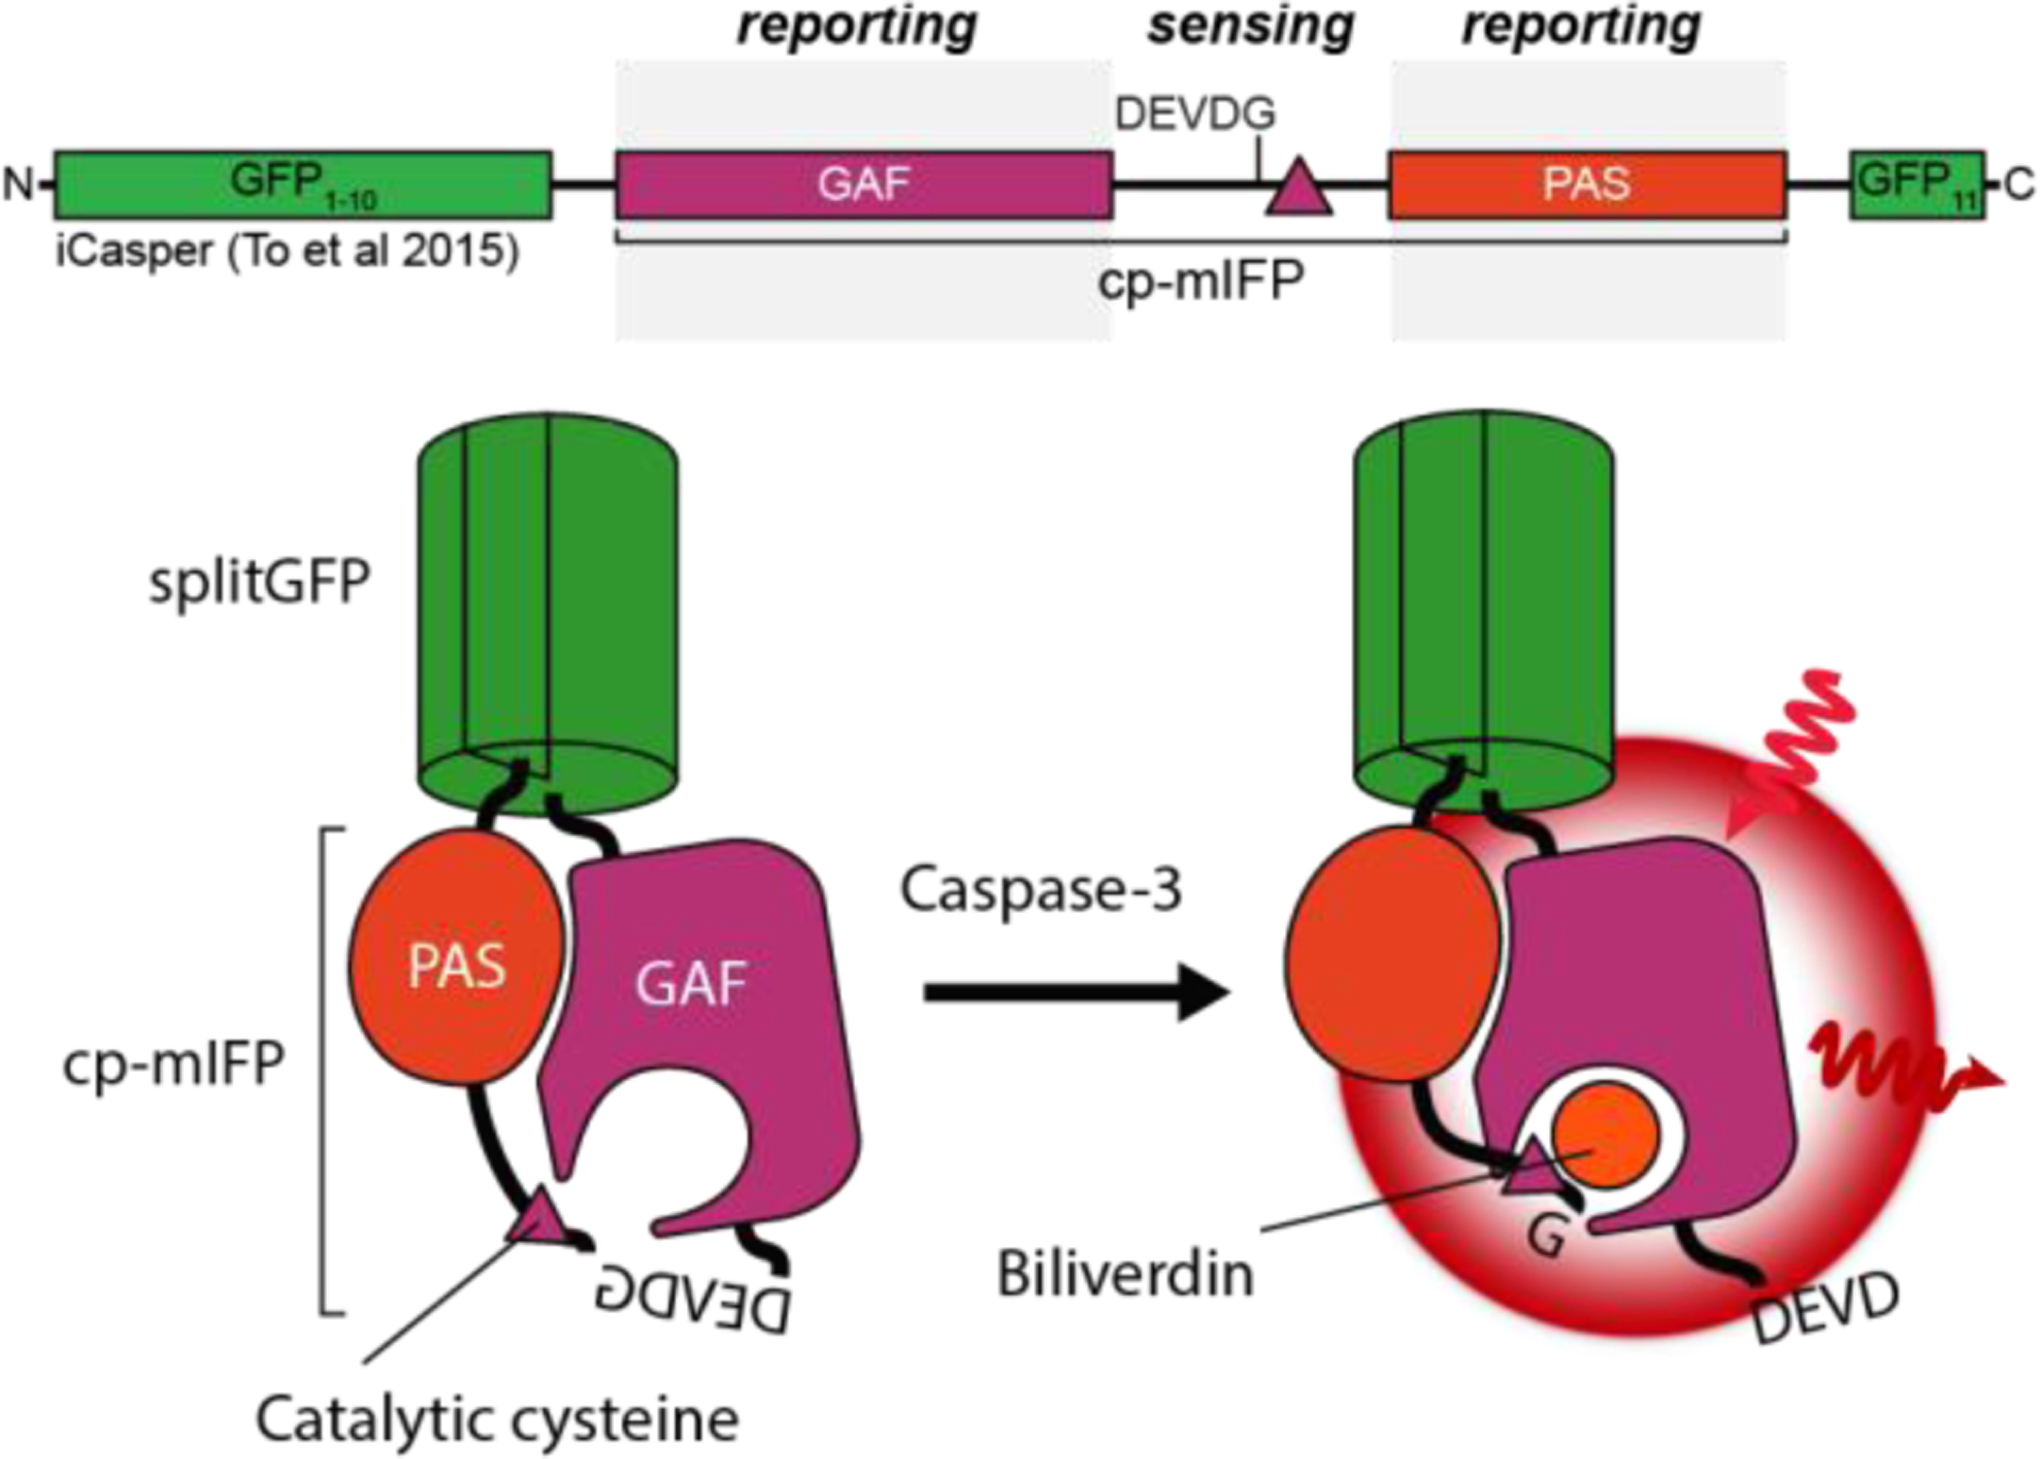
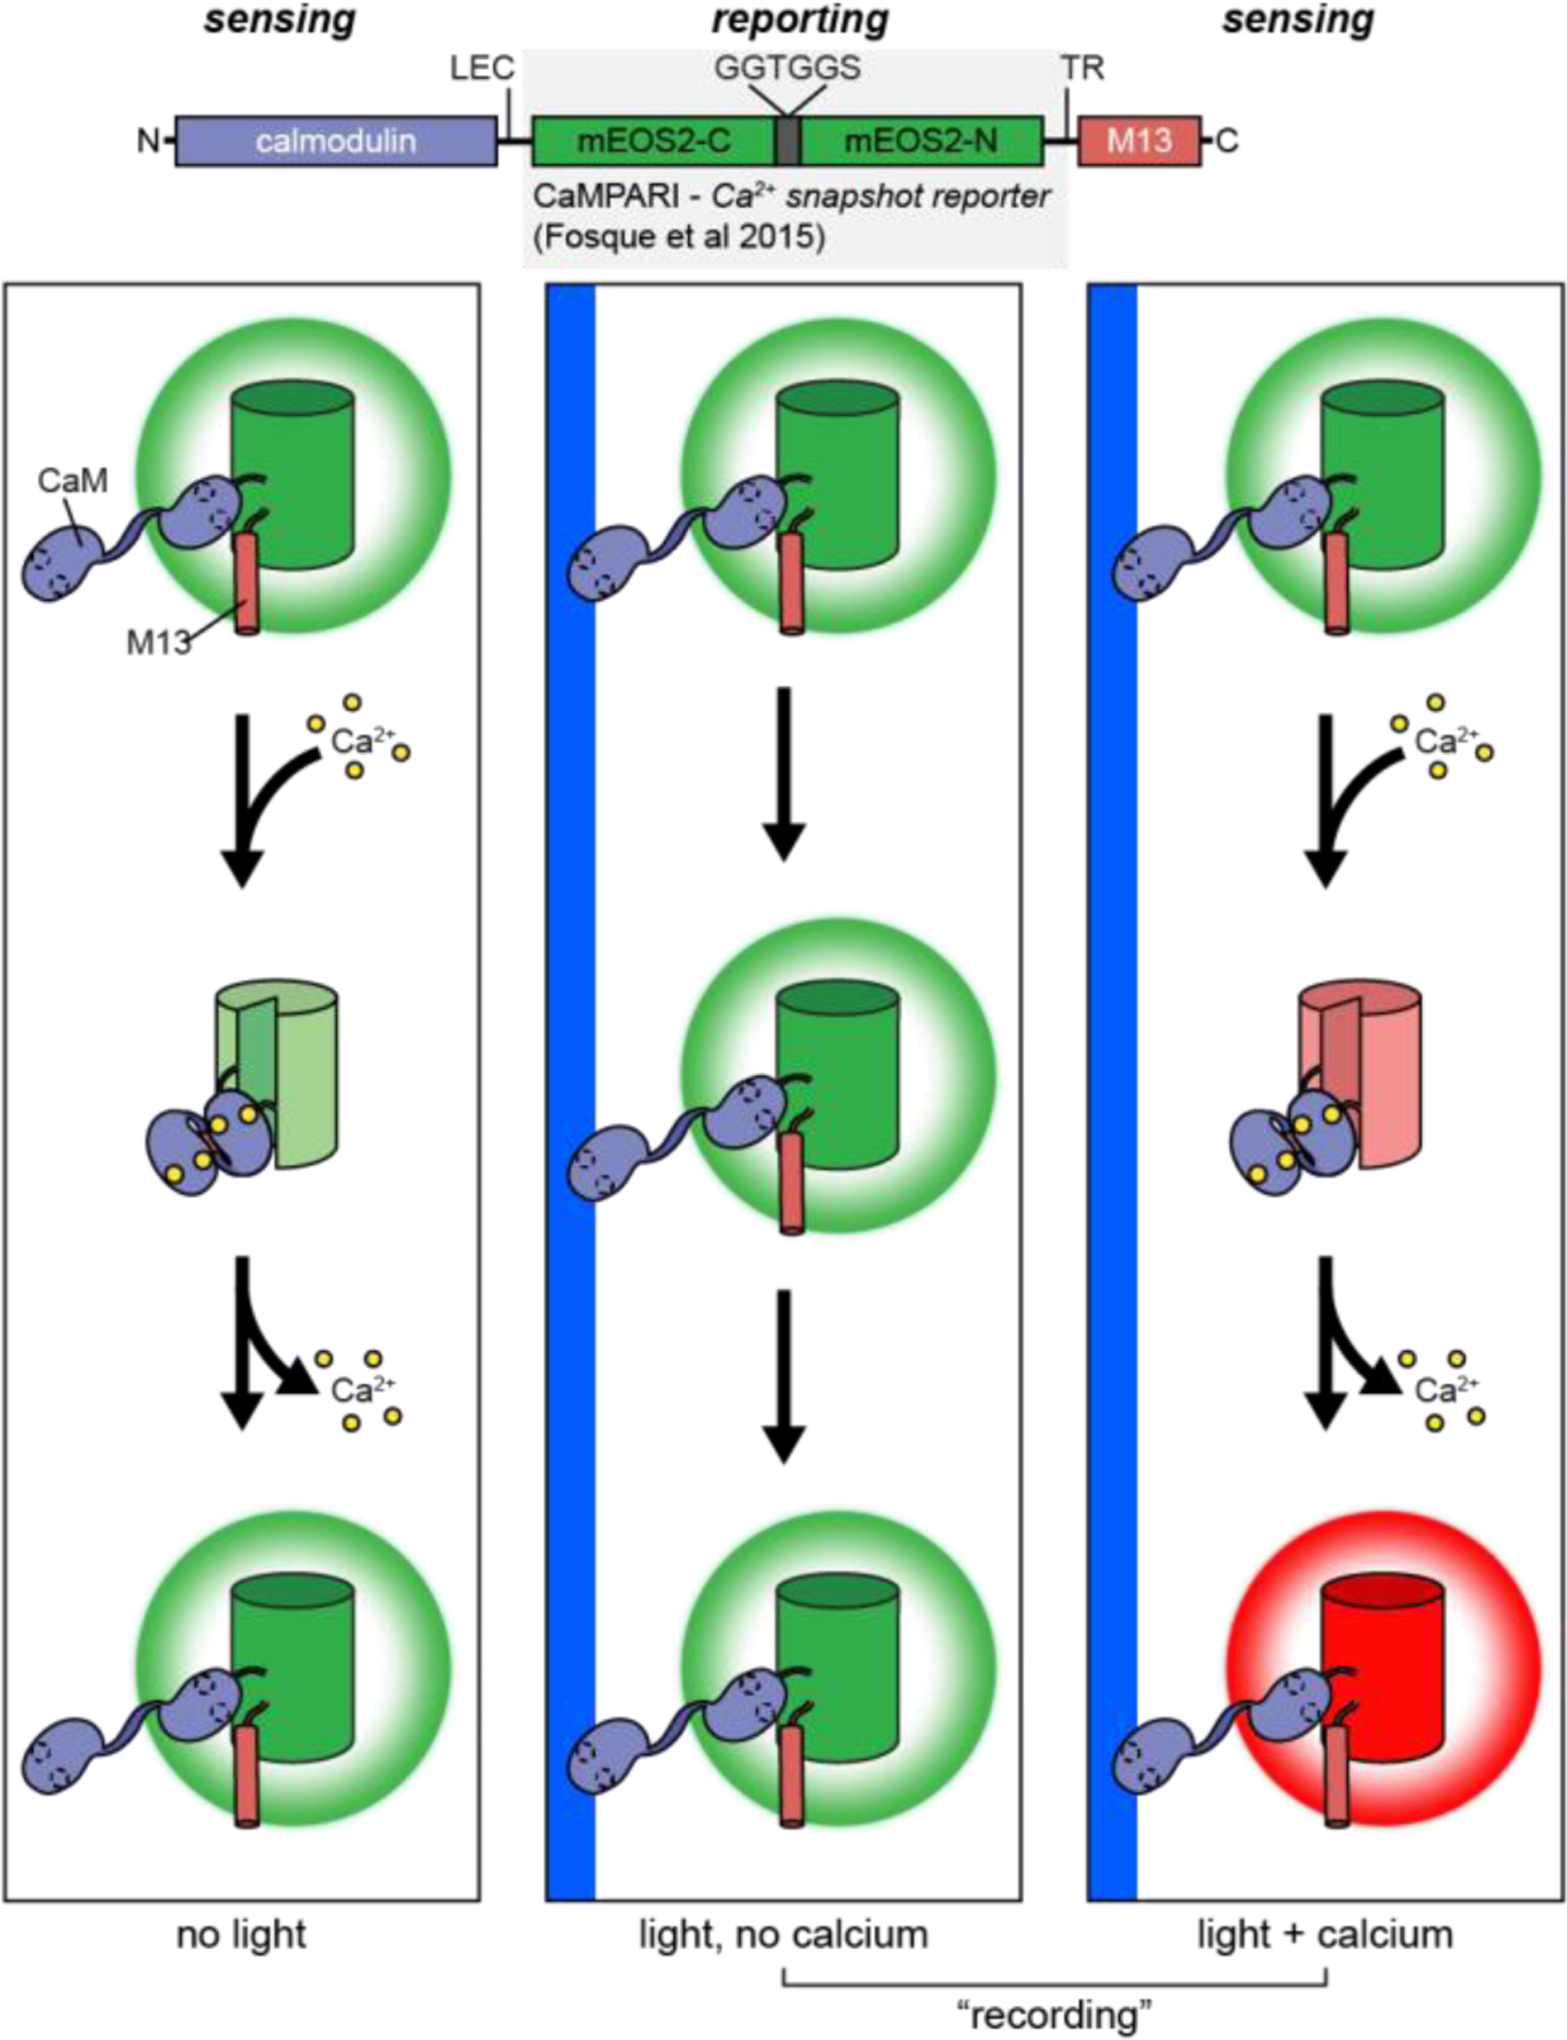
Cellular signaling networks are the foundation which determines the fate and function of cells as they respond to various cues and stimuli. The discovery of fluorescent proteins over 25 years ago enabled the development of a diverse array of genetically encodable fluorescent biosensors that are capable of measuring the spatiotemporal dynamics of signal transduction pathways in live cells. In an effort to encapsulate the breadth over which fluorescent biosensors have expanded, we endeavored to assemble a comprehensive list of published engineered biosensors, and we discuss many of the molecular designs utilized in their development. Then, we review how the high temporal and spatial resolution afforded by fluorescent biosensors has aided our understanding of the spatiotemporal regulation of signaling networks at the cellular and subcellular level. Finally, we highlight some emerging areas of research in both biosensor design and applications that are on the forefront of biosensor development.


Figures

Figure 1:
Figure 1:
Translocation based fluorescent biosensors. A) PH domains from different proteins are fused to a FP and translocate to the plasma membrane upon the production of specific phosphoinositides,. For example, phosphorylation of PIP2 by PI3K to produce PIP3 at the plasma membrane causes translocation of the biosensor from the cytosol to the plasma membrane. B) Kinase translocation reporters utilize kinase specific substrate sequences within nuclear localization sequences (NLS) and/or nuclear export sequences (NES) to promote the import into the nucleus when dephosphorylated and export out of the nucleus when phosphorylated,.
Figure 2:
Figure 2:
Single FP fluorescent biosensor designs for cellular analytes and membrane potential. Insertion of a sensing unit into a FP. Calmodulin, mEpac and mPDE5α undergo conformational changes in response to binding Ca2+ , cAMP, and cGMP, respectively, which perturbs the chromophore and alters the fluorescence. Binding can either lead to an increase in fluorescence, as seen in the Ca2+ biosensor camgaroo1, or a decrease in fluorescence, as seen in the cAMP biosensor flamindo. B) Sandwiching a cpFP between sensing units. Biosensors have utilized sensing units that comprise either separate receiver and switch domains, or split proteins that re-constitute during protein folding. For example, GCaMP biosensors utilize separate domains of CaM and M13, where calcium binding to CaM promotes the binding of CaM to M13 and results in a conformational change that leads to an increase in GFP fluorescence. On the other hand, the membrane voltage sensor ASAP1 inserts cpGFP into the voltage-sensing domain of the chicken voltage-sensitive phosphatase Gg-VSP, which reconstitutes after folding and depolarization leads to a conformational change in the 4th transmembrane segment that alters the fluorescence of cpGFP C) Insertion of a FP into a voltage-sensitive channel. The conformational changes induced in voltage-sensitive K+ and Na+ channels alter the fluorescence of GFP to act as biosensors of membrane potential,.
Figure 3:
Figure 3:
Designs of FRET-based reporters for ions, cellular analytes and membrane potential. FRET-based metal ion biosensors utilize receiver and switch domains that bind to each other,, or endogenous proteins that undergo a conformational change in response to binding of metal ions. These conformational changes alter the intramolecular distance and orientation of a pair of FPs and thus changes the amount of energy transferred from the donor FP to the acceptor FP. B) Voltage sensors that utilize a FRET-based readout often rely primarily on changing the orientation of dipoles of FPs,. VSFP1 contains a CFP inserted between the 3rd and 4th transmembrane domain and a YFP fused to the C terminal tail of a truncated portion of the rat Kv2.1 channel where cell depolarization induces a conformational shift in the 4th transmembrane domain, thus changing the relative angle of the two dipoles of the fluorescent proteins. C) Several biosensors for cellular analytes have utilized the design of sandwiching a conformationally switching domain between a FP FRET pair,,,,,,,,. For example, the cAMP biosensor ICUE2 utilizes the conformational change induced by cAMP binding to the CNB domain of Epac1 to increase the intramolecular distance between the donor and acceptor FPs. Alternatively, having both a PIP3 binding PH domain from GRP1 and a C-terminal membrane localization sequence in combination with engineered rigid α-helical linkers yielded a chimeric protein that exhibits significant conformational changes in response to PIP3 production, leading to changes in FRET between a FRET pair flanking the chimeric protein.
Figure 4:
Figure 4:
FRET-based biosensor designs for signaling proteins. Biosensors for signaling enzyme activation consist of whole or truncated portions of the enzyme sandwiched between a FP FRET pair,,,. For example, the conformational change in the phosphatase CaNAα upon activation by Ca2+ bound CaM increases the distance between the two FPs in CaNARi. B) The insertion of FPs into a receptor or between a GPCR and Gαs have been utilized to create FRET-based biosensors of receptor activation. C) Biosensors for small G-protein activation utilize G-protein binding domains (e.g., Raf RBD, PKN RBD, EEA1 RBD), which bind to specific G-proteins upon activation to create a conformational change,,,,. D) FRET-based biosensors for kinase activity consist of either an endogenous kinase substrate or a kinase substrate sequence paired with a phospho-amino acid binding domain,,,, sandwiched between two FPs, which undergo a conformational change upon phosphorylation. Conversely, the phosphatase biosensor CaNAR uses a fragment of NFAT1c, which is phosphorylated at basal levels and exhibits a conformational shift upon dephosphorylation by CaN. E) Similarly, biosensors for other PTMs use substrates paired with protein domains that recognize the modified substrates. The Histac biosensors contain a full-length histone, H3 or H4, and a fragment of a bromodomain (BRD)containing protein that binds the acetylated substrate,.
Figure 5:
Figure 5:
ddFP- and luminescence-based biosensors. Bimolecular (top) or unimolecular (bottom) Ca2+-biosensor designs based on ddFPs,. The dimeriaztion of the dim ddFP partner, FP-B, with either RFP-A or GFP-A increases their fluorescence, and this dimerization is modulated by the Ca2+dependent binding of calmodulin to M13. B) Modulating the structure of split luciferaces by conformational switches has been utilized in cAMP, PKA and Ca2+ biosensors,,. In the FLuc cAMP sensor, the conformational switch induced by binding of cAMP to PKA RIIβ allows the firefly luciferase (FLuc) to properly form, thus allowing the enzyme to catalyze the degradation of luciferin and emit photons. Similarly, the Nano-lantern Ca2+ biosensor undergoes a Ca2+-dependent reconstitution of renilla luciferace (RLuc), which is then capable of BRET with the adjacent, brighter YFP.
Figure 6:
Figure 6:
Coupled reporter systems. (A and B) Biosensors reporting the cell cycle phase of cells utilize fluorescent proteins fused to protein fragments that are selectively degraded during specific phases of the cell cycle,. In the Fucci system, Gem is degraded during the G1 and late M phases and, conversely, Cdt1is degraded in S and G2 phases. The improved Fucci4 adds the condensation of chromatin around Histone H1 to report the M phase, as well as SLBP, which is degraded after S phase, in addition to labeled Cdt1 and Gem from Fucci. C) The chimeric receptor BBD-ECat, which consists of an extracellular TrkB domain, which dimerizes upon binding BDNF, and an intracellular EGFR domain, is coupled with an EGFR activity reporter ECaus to act as a reporter for BDNF release by neurons. D) Similarly, the expression of the M1 receptor and the Ca2+ biosensor TN-XXL in a co-cultured reporter cell, uses the endogenous coupling of the GPCR M1R to Gαq which, upon receptor stimulation, leads to an increase in intracellular Ca2+ to report the presense of a neurotransmitter, acetylcholine (Ach).
Figure 7:
Figure 7:
Infrared FP-based Caspase-3 reporter, iCasper. The introduction of the Caspase-3 cleavage sequence into the circularly permuted mIFP prevents the incorporation of BV into the GAF domain, but cleavage by Caspase-3 liberates the catalytic cysteine to promote the incorporation of BV and the formation of the chromophore.
Figure 8:
Figure 8:
Photoconversion-based snapshot recorder of Ca2+. CaMPARi acts similarly to other green single color Ca2+ biosensors where the green fluorescence intensity is dependent on the Ca2+ concentration (left), except it can also “record” the presence of high Ca2+ during a snapshot in time. When the CaMPARi biosensor is illuminated with blue/violet light and the intracellular Ca2+ is high, the biosensor will irreversibly convert to a red (right) Ca2+ biosensor.
Figure 9:
Figure 9:
Transcription-based snapshot reporters. The Cal-Light and FLARE Ca2+ biosensors create an “AND gate” design by combining the optogenetically controlled AsLOV2 domain with a Ca2+ switch controlled split-TEV protease, which leads to the cleavage of the tTa-VP16 transcriptional activator only in the presence of high Ca2+ and blue light,. The cleavage of the transcriptional activator will then turn on the expression of a reporter gene such as GFP expression.
Figure 10:
Figure 10:
Fluctuation-based PKA biosensor FLINC-AKAR1. Fluorescence of TagRFP-T is modulated by its interaction with Dronpa through a process termed FLINC, such that when in close proximity to Dronpa, TagRFP-T exhibits increased fluorescence fluctuation. This enables this biosensor to report PKA activity at a sub-diffraction spatial resolution through the use of the super-resolution technique pcSOFI.
Figure 11:
Figure 11:
Temporal dynamics quantified by fluorescent biosensors. The kinetics of GPCR signaling. First, the receptor undergoes a conformational change in response to ligand binding, which was observed to occur with a time constant on the order of 40 ms in the α2-Adrenergic Receptor using the biosensor α2-AR-CAM. Next, the heterotrimeric G protein associates with the activated receptor. A2A Adenosine Receptor, A2AR, fused with YFP at the C-terminal tail and CFP-labeled Gγ2 exhibited an increase in FRET upon stimulation with adenosine with a time constant of approximately 50 ms. Finally, the receptor stimulates the exhange of GTP for GDP on the Gα subunit, thus activating Gα and promoting the dissociation of Gα from Gβγ. Biosensors consisting of a CFP-labeled Gγ subunit and either Gαi or Gαs fused to YFP showed activation time constants on the order of 500 ms. B) Adaptation is the return of a signaling pathway towards its previous state while under continued stimulation. PC12 cells expressing the ERK biosensor EKAR show an adaptive response to EGF stimulation (gray lines) but a much more sustained response to NGF stimulation (black lines), reproduced with permission from Herbst et al. Mol and Cell Bio 2011. Negative feedback by ERK onto Raf activation is hypothesized to lead to a transient response, whereas positive feedback in the NGF signaling pathway is hypothesized to lead to bistability. C) Oscillations are the regular or semi-regular cycling between activity/concentration states, as can be seen in the TEA-induced Ca2+ and PKA activity oscillations in MIN6 cells. These oscillations were observed through the simultaneous measurement of Ca2+ concentration with the Ca2+ dye Fura-2 (black line) and a Green/Red variant of AKAR, GR-AKAR, (red line) at the single-cell level in MIN6 cells. While the inhibition of K+ channels by ATP and the interplay between voltage and Ca2+ are the primary driver of the Ca2+ oscillations, the negative feedback of Ca2+ through cAMP and PKA is hypothesized to strengthen these oscillations and tune their frequencies. Reproduced with permission from Ni et al. Nat Chem Bio 2011. D) Bistability and ultrasensitivity describe phenomena wherein a signaling pathway is insensitive to stimulation below a certain threshold dose but responds in a switch-like fashion to super-threshold stimuli. HeLa cells expressing the JNK biosensor JNKAR1 did not respond to anisomycin at concentrations of 20 (cyan diamonds), or 50 (blue triangles) nM, but exhibited a strong response to 500 nM (red circle) and 5 μM (black squares), reproduced with permission from Fosbrink et al. PNAS 2010. In addition to the multistep activation along the JNK signaling pathway, positive feedback by JNK onto the activation of upstream regulator MKK7 is hypothesized to contribute to the ultrasensitive nature of activation by anisomycin.
Figure 12:
Figure 12:
Probing spatial compartmentalization with fluorescent biosensors. GPCRs are activated at the plasma membrane but can continue to stimulate downstream signaling after internalization. Activation of β2AR at the plasma membrane by an extracellular ligand leads to the production of cAMP. This activation of β2AR can be monitored both directly, by GFP labeled nanobody Nb80 which binds the active conformation of β2AR, and indirectly, through biosensors of cAMP concentration such as Epac1-camps. The activation of GPCRs is reversed by the binding of βarrestin (βarr) which attenuates downstream signaling and promotes receptor trafficking to clathrin-coated pits for endocytosis. After internalization, βarr can dissociate from the receptor and some GPCRs have been shown to then continue downstream signaling from the endosome, as shown by Nb80-GFP translocation to the endosomes and monitoring of cAMP production after perturbing internalization or blocking the membrane pool of the receptors by using membrane-impermeable antagonists. B) The fusion of targeting domains to biosensors enables the measurement the signaling dynamics in several different subcellular microdomains by promoting the trafficking and localization of the biosensor to these regions. C) For example, Zhou et al. targeted TORCAR to the plasma membrane (PM-TORCAR), lysosome (Lyso-TORCAR) and nucleus (TORCAR-NLS) to examine the mTORC1 activity in each of these microdomains. With these targeted biosensors, it was shown that growth factor stimulation leads to mTORC1 activation in all three microdomains, whereas stimulation with nutrients activated mTORC1 at the lysosome and nucleus but not at the plasma membrane.
Figure 13:
Figure 13:
Spatial regulation of diffusible signaling molecules. Spatial Ca2+ gradients are primarily shaped by 4 effects: the rate of Ca2+ influx into the cytosol from the extracellular environment and intracellular stores, the efflux of Ca2+ out of the cytosol by Ca2+ pumps, Ca2+ binding proteins which buffer the changes in the free Ca2+ concentration and diffusion of Ca2+ through the cytosol. B) While the effect of Ca2+ influx by a single channel may be limited by the rate of Ca2+ flux through the channel and the rate of diffusion (top), Ca2+-induced Ca2+ release (CICR), where an increase in Ca2+ can stimulate the opening of neighboring Ca2+ channels, creates a positive feedback loop that can create a wave of Ca2+ release that spreads faster than possible by diffusion alone (bottom). C) The spatial arrangement of adenylyl cyclases (ACs), which produce cAMP, and phosphodiesterases (PDEs), which degrade cAMP, regulate the formation of gradients of the diffusible messenger cAMP. For example, rat hippocampal neurons at 5 days in vitro (DIV5), when the axons have started to become more thoroughly established, have been observed to exhibit an axon-directed gradient of cAMP accumulation in response to Forskolin stimulation of ACs. Conversely, at an earlier time point of 3 days in vitro (DIV3), cAMP production was observed to be much more limited in response to Forskolin, which was hypothesized to be due to negative feedback mediated by PKA and PDE, which are localized to distal regions of an axon by an A-Kinase Anchoring Protein (AKAP).
Figure 14:
Figure 14:
Integrated approach combining biosensor imaging and computational modeling. A) Computational model development utilizes an iterative approach where the hypothesized structure of the signaling network is implemented into a computational model (top). The results of the computational model are then compared with experimental biosensor data, which serves to approximate unknown model parameters (model fitting) and identify aspects of the experimental data that the model is not capturing. This comparison is then used to refine the hypothesized model structure. This process is iterated until the model adequately reflects the experimental data. This model is then, in turn, capable of generating previously untested conditions (e.g., different stimulation, inhibition of a signaling enzyme) to generate new hypotheses (bottom). Biosensors then serve as a powerful tool to validate these model predictions. B&C) Kinetic computational models simulate changes in the activity and concentration of different signaling reactants as defined by the hypothsized connections within the signaling networks. These models do not directly approximate changes in space (B) but sub-cellular compartments can be defined where specific model species can exchange between compartments (C). D) Spatiotemporal models simulate the changes in signal transduction across both space and time; therefore, the model outputs the model species concentration or activity as it varies across the defined geometry and through time.
Figure 15:
Figure 15:
Single-color FRET-based methods. Fluorescence quenching resonance energy transfer (FqRET)-based CaMKIIα biosensor green-Camuiα. In the inactive state, the energy from excited EGFP is non-radiatively transferred to the dark acceptor REACh, which then dissipates that energy without emitting a photon. Upon activation, the conformational change moves REACh away from the EGFP, leading to increased EGFP emission. FqRET can also be quantified by fluorescence lifetime imaging (FLIM), where the lifetime, τ, is low in the high-FqRET state and vice versa. B) Homo-FRET-based NADP+ biosensor Apollo-NADP+. Upon binding NADP+, G6PD dimerizes and thus allow FRET between the two FPs. Fluorescence polarization microscopy can be used where a polarized excitation source will only excite FP in the appropriate dipole orientation, resulting in the emitted photon also being polarized. Conversely, when FRET occurs between these two FPs, the emitted photons exhibit a mix of polarizations and thus decrease the polarized fluorescence signal.

References

    1. Coons AH The Beginnings of Immunofluorescence. J. Immunol 1961, 87, 499–503. - PubMed
    1. Taylor DL; Amato PA; Luby-Phelps K; McNeil P Fluorescent Analog Cytochemistry. Trends Biochem. Sci 1984, 9 (3), 88–91.
    1. Tsien RY Fluorescent Probes of Cell Signaling. Annu. Rev. Neurosci 1989, 12 (1), 227–253. - PubMed
    1. Prasher DC; Eckenrode VK; Ward WW; Prendergast FG; Cormier MJ Primary Structure of the Aequorea Victoria Green-Fluorescent Protein. Gene 1992, 111 (2), 229–233. - PubMed
    1. Heim R; Cubitt AB; Tsien RY Improved Green Fluorescence. Nature 1995, 373 (6516), 663–664. - PubMed

Publication types

Substances