

A data-driven individual-based model of infectious disease in livestock operation: A validation study for paratuberculosis
- PMID: 30550580
- PMCID: PMC6294356
- DOI: 10.1371/journal.pone.0203177
A data-driven individual-based model of infectious disease in livestock operation: A validation study for paratuberculosis
Abstract
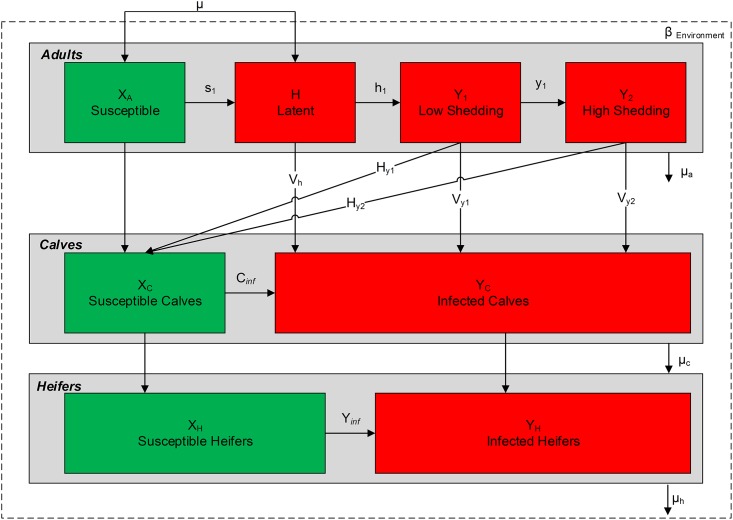
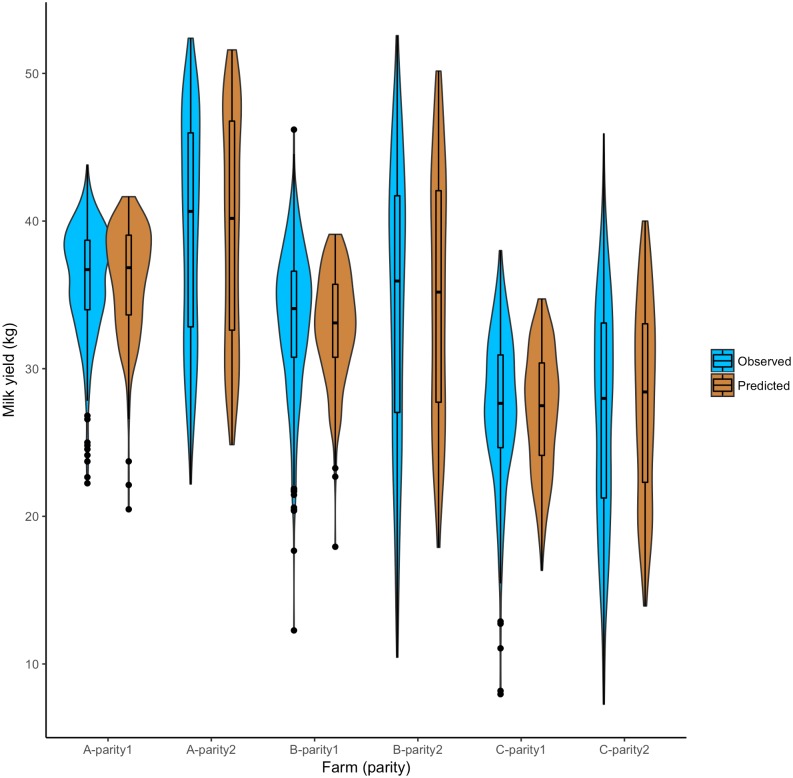
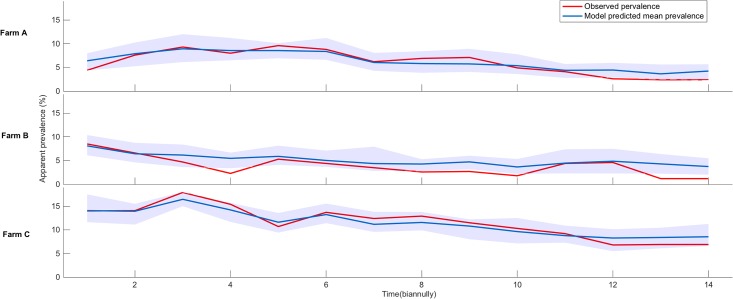
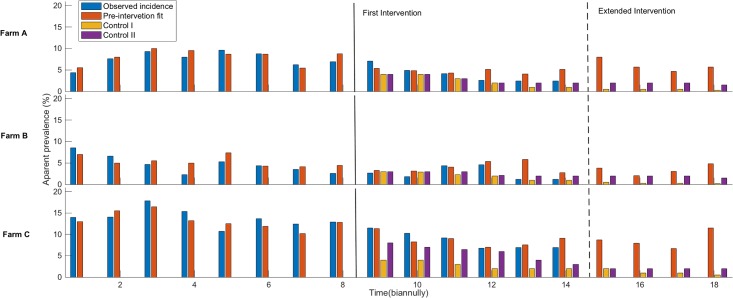
Chronic livestock diseases cause large financial loss and affect animal health and welfare. Controlling these diseases mostly requires precise information on both individual animal and population dynamics to inform the farmer's decisions, but even successful control programmes do by no means assure elimination. Mathematical models provide opportunities to test different control and elimination options rather than implementing them in real herds, but these models require robust parameter estimation and validation. Fitting these models to data is a difficult task due to heterogeneities in livestock processes. In this paper, we develop an infectious disease modeling framework for a livestock disease (paratuberculosis) that is caused by Mycobacterium avium subsp. paratuberculosis (MAP). Infection with MAP leads to reduced milk production, pregnancy rates, and slaughter value and increased culling rates in cattle and causes significant economic losses to the dairy industry. These economic effects are particularly important motivations in the control and elimination of MAP. In this framework, an individual-based model (IBM) of a dairy herd was built and MAP infection dynamics was integrated. Once the model produced realistic dynamics of MAP infection, we implemented an evaluation method by fitting it to data from three dairy herds from the Northeast region of the US. The model fitting exercises used least-squares and parameter space searching methods to obtain the best-fitted values of selected parameters. The best set of parameters were used to model the effect of interventions. The results show that the presented model can complement real herd statistics where the intervention strategies suggest a reduction in MAP prevalence without elimination. Overall, this research not only provides a complete model for MAP infection dynamics in a dairy herd but also offers a method for estimating parameters by fitting IBM models.
Conflict of interest statement
The authors have declared that no competing interests exist.
Figures
References
-
- BROUGHAN JM, JUDGE J, ELY E, DELAHAY RJ, WILSON G, CLIFTON-HADLEY RS, et al. A review of risk factors for bovine tuberculosis infection in cattle in the UK and Ireland. Epidemiol Infect. Cambridge University Press; 2016;144: 2899–2926. 10.1017/S095026881600131X - DOI - PMC - PubMed
-
- Rathnaiah G, Zinniel DK, Bannantine JP, Stabel JR, Gröhn YT, Collins MT, et al. Pathogenesis, Molecular Genetics, and Genomics of Mycobacterium avium subsp. paratuberculosis, the Etiologic Agent of Johne’s Disease. Front Vet Sci. 2017;4: 187 10.3389/fvets.2017.00187 - DOI - PMC - PubMed
-
- Brooks-Pollock E, Roberts GO, Keeling MJ. A dynamic model of bovine tuberculosis spread and control in Great Britain. Nature. Nature Publishing Group; 2014;511: 228–231. 10.1038/nature13529 - DOI - PubMed
-
- NAHMS. National Animal Health Monitoring System (2007) Dairy 2007-Johne’s Disease on U.S. Dairies, 1991–2007,National Animal Health Monitoring Systems. Fort Collins, CO; 2007.
-
- Behr M, Collin D. Paratuberculosis:Organism, Disease, Control. CABI; 2010.
Publication types
MeSH terms
LinkOut - more resources
Full Text Sources
