. 2018 Dec 13;175(7):1917-1930.e13.
doi: 10.1016/j.cell.2018.08.044.

Protein Interaction Mapping Identifies RBBP6 as a Negative Regulator of Ebola Virus Replication

Affiliations

Protein Interaction Mapping Identifies RBBP6 as a Negative Regulator of Ebola Virus Replication

Jyoti Batra et al. Cell. .

Abstract

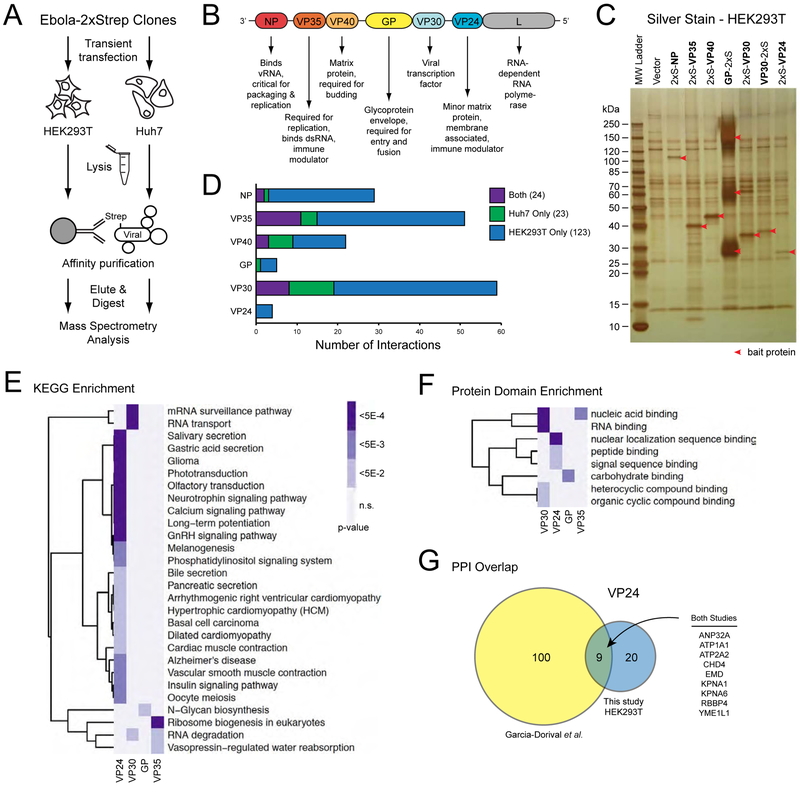
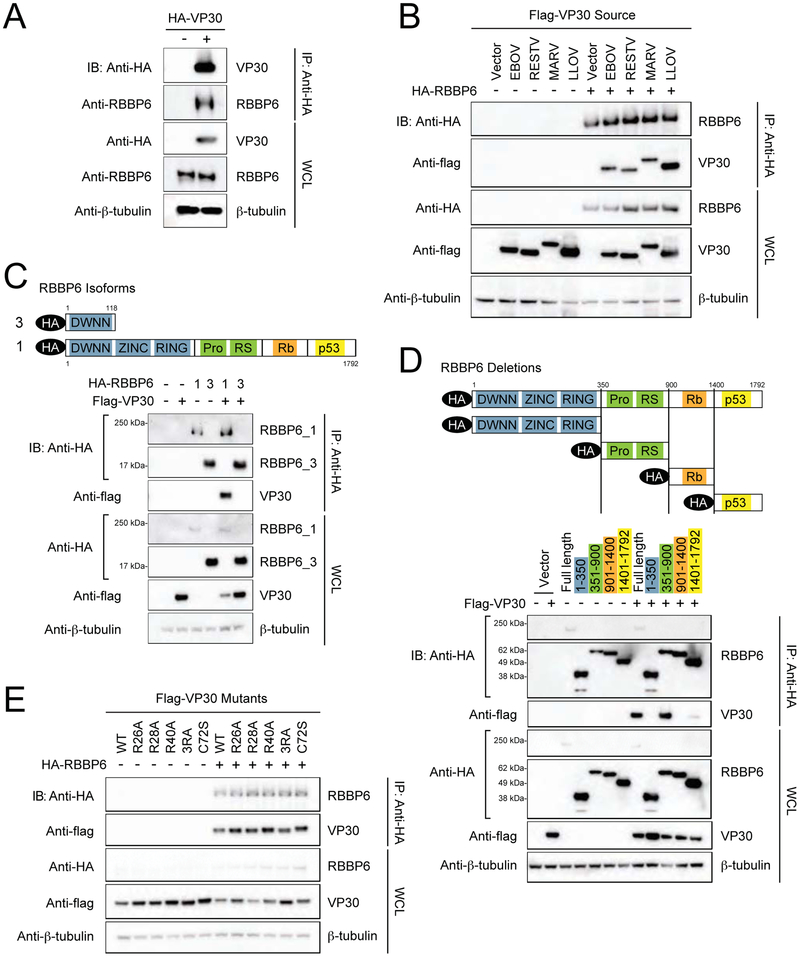
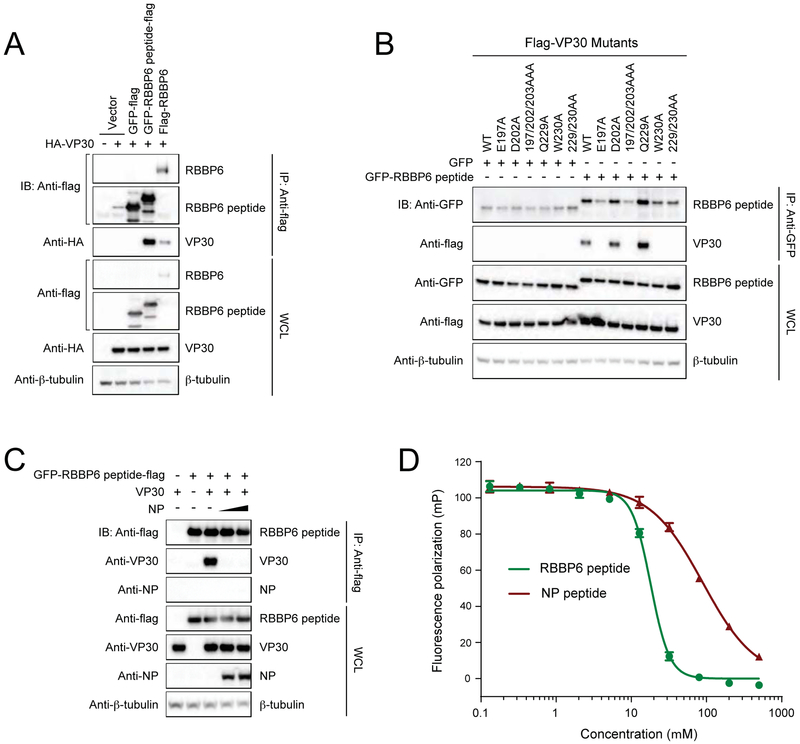
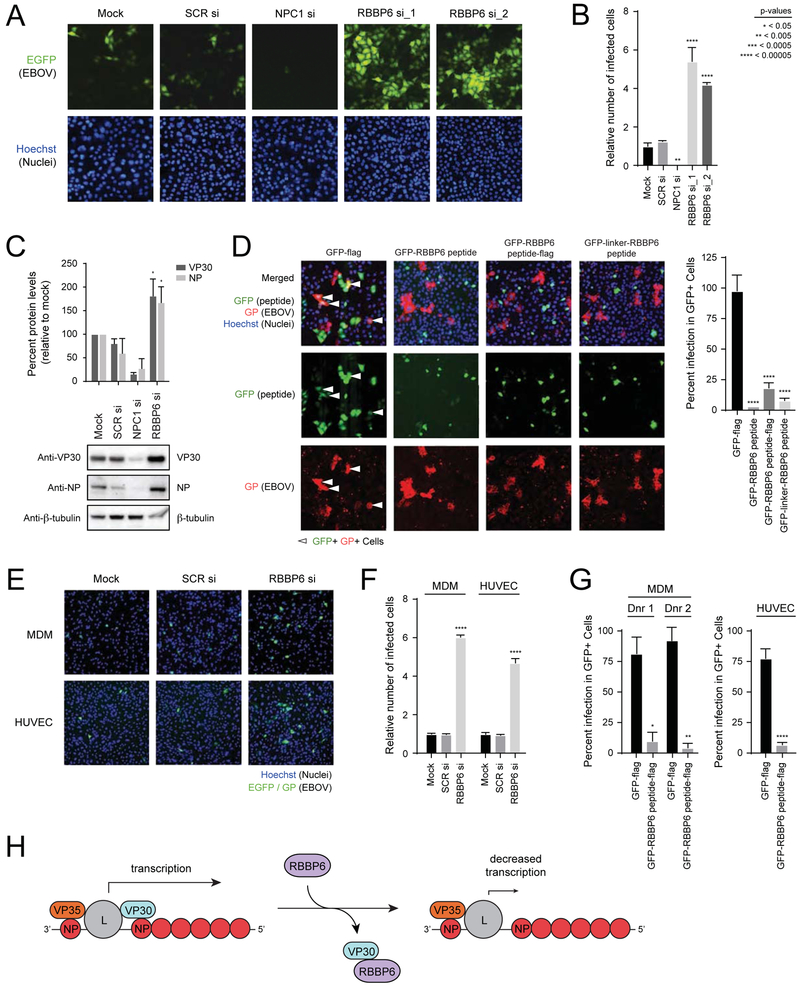
Ebola virus (EBOV) infection often results in fatal illness in humans, yet little is known about how EBOV usurps host pathways during infection. To address this, we used affinity tag-purification mass spectrometry (AP-MS) to generate an EBOV-host protein-protein interaction (PPI) map. We uncovered 194 high-confidence EBOV-human PPIs, including one between the viral transcription regulator VP30 and the host ubiquitin ligase RBBP6. Domain mapping identified a 23 amino acid region within RBBP6 that binds to VP30. A crystal structure of the VP30-RBBP6 peptide complex revealed that RBBP6 mimics the viral nucleoprotein (NP) binding to the same interface of VP30. Knockdown of endogenous RBBP6 stimulated viral transcription and increased EBOV replication, whereas overexpression of either RBBP6 or the peptide strongly inhibited both. These results demonstrate the therapeutic potential of biologics that target this interface and identify additional PPIs that may be leveraged for novel therapeutic strategies.

Keywords: Ebola virus; RBBP6; RNA viruses; VP30; antiviral factor; host-pathogen interactions; protein-protein interactions; virus-host interactions.


Figures

FIGURE 1.
FIGURE 1.. An affinity tag-purification mass spectrometry approach for the study of EBOV virus protein-protein interactions.
(A) A schematic representation of the AP-MS approach for identifying EBOV-human protein-protein interactions in HEK293T and Huh7 cells. (B) A schematic representation of the EBOV genome and the principal functions of each encoded viral protein. The secreted glycoproteins (sGP and ssGP) are not represented and were not examined in this study. (C) Silver stain of the eluted fraction following Strep affinity purification of the indicated bait proteins from HEK293T cells. Red arrows denote the bait protein in each lane. (D) Bar graph summarizing the number of human proteins identified as interacting with each of the indicated EBOV baits. See also Supplemental Table S1. (E) Heat map of KEGG terms significantly enriched (p-value < 0.05) among the human interacting proteins of the indicated EBOV baits. Darker shading indicates a more significant enrichment of the given KEGG term. There were no significantly enriched KEGG terms among the human proteins interacting with VP40 or NP. KEGG terms are clustered on the vertical axis by correlation between enrichment profiles across the depicted baits. (F) Heat map of protein domain types significantly enriched (p-value < 0.05) among the human interacting proteins of the indicated EBOV baits. Darker shading indicates a more significant enrichment of the given domain type. There were no significantly enriched domain types among the human proteins interacting with VP40 or NP. KEGG terms are clustered on the vertical axis by correlation between enrichment profiles across the depicted baits. (G) Venn diagram demonstrating the overlap in identified PPIs between this study and a previously published study by Garcia-Dorival et al. that focused on VP24 interactions in HEK293T cells. Nine PPIs were conserved among both studies as listed on the right.
FIGURE 2.
FIGURE 2.. An EBOV-human protein-protein interaction network.
194 high-confidence, EBOV-human protein-protein interactions are represented (blue lines) between 6 EBOV proteins and 169 human proteins. Each EBOV bait node is colored according to the genome schematic (upper left). Each human prey node is colored according to the cell line in which it was identified: blue indicates HEK293T cells, green indicates Huh7 cells, and blue-green bifurcation indicates the protein was identified as an interactor in both cell types. The shade of the prey node correlates with the MiST score of the interaction (scale at lower left). Grey lines correspond to 164 human-human protein-protein interactions curated in the publicly available CORUM database. Human protein-protein complexes that are represented by at least three nodes are labeled. See also Supplemental Table S1.
FIGURE 3.
FIGURE 3.. Interaction between EBOV VP30 and human RBBP6.
(A) Co-immunoprecipitation of HA-VP30 with endogenous RBBP6. HEK293T cells were transfected with HA-VP30 and immunoprecipitation (IP) was performed using anti-HA magnetic beads. Representative western blots of whole cell lysates (WCL) and eluates after IP are shown, β-tubulin was used as a loading control in WCLs. See also Supplemental Figure S1. (B) Flag-VP30 from Zaire ebolavirus (EBOV), Reston virus (RESTV), Lloviu virus (LLOV) and Marburg virus (MARV) co-immunoprecipitate with HA-RBBP6. (C) A schematic representation of domain organization of RBBP6 isoform 1 and 3 (top). RBBP6 functional domains consists of domain with no name (DWNN), zinc knuckle, ring finger domain, proline and arginine-serine rich domains followed by retinoblastoma (Rb) and p53 binding domains. Bottom panel depicts co-immunoprecipitation of flag-tagged VP30 with transiently expressed HA-RBBP6 isoform 1 or 3. HEK293T cells were transfected with HA-RBBP6 alone or in combination with flag-VP30, as indicated followed by IP with anti-HA. (D) Schematic drawing of RBBP6 truncation mutants used in domain mapping studies (top). Anti-HA IP was performed after co-expression of HA-tagged full-length RBBP6 or different truncations in combination with empty vector or flag-VP30. (E) Immunoprecipitation with anti-HA in cell lysates expressing HA-RBBP6 and flag-tagged RNA binding mutants of VP30. 3RA: R26A/R28A/R40A.
FIGURE 4.
FIGURE 4.. An X-ray crystal structure reveals that RBBP6 and NP bind the CTD of VP30 at the same interface.
(A) Summary of in vitro pull-down based binding results for RBBP6 truncated constructs to VP3089-288. +, binding; −, no binding. See also Supplemental Figure S2A-B. (B) Representative ITC raw data and corresponding binding isotherm for VP30130-272 binding to RBBP6549.571. KD = 0.75 ± 0.095 μM. Reported measurements are the average of at least two independent experiments. (C) Comparison between the X-ray crystal structures of VP30CTD/RBBP6 peptide complex (PDB: 6E5X, top) and VP30CTD/NP peptide complex (PDB: 5VAP, bottom). VP30CTD is shown in surface representation (teal), while RBBP6 (green) and NP (red) peptides are shown in stick representation. See also Supplemental Figure S2C and Supplemental Table S2. (D) Overview of interacting residues at the interface between VP30 and peptides derived from RBBP6 and NP. See also Supplemental Figure S2D. (E) Co-immunoprecipitation of HA-RBBP6 with flag-tagged VP30 mutants. (F) Anti-flag immunoprecipitation of RBBP6 with VP30 in the presence of wtNP or NP mutants unable to interact with VP30. IP: immunoprecipitation; IB: immunoblot; WCL: whole-cell lysate.
FIGURE 5.
FIGURE 5.. VP30 interacts with 549-571aa region of RBBP6.
(A) Representative immunoblots after Co-IP between HA-VP30 and RBB6P peptide fused to GFP-flag. GFP-flag was used as a control. (B) Interaction between RBBP6 peptide and NP binding mutants of VP30. (C) Co-IP experiment demonstrating that NP interferes with VP30-RBBP6 peptide interaction. IP was performed with anti-flag beads after co-expression of VP30, RBBP6 peptide fused to GFP-flag and NP. IP: immunoprecipitation; IB: immunoblot; WCL: whole-cell lysate. (D) Fluorescence polarization assay showing RBBP6 peptide (green) displaces FITC-NP peptide (red) from the eVP30CTD-FITC-NP peptide complex. Error bars represent standard deviation of three independent experiments.
FIGURE 6.
FIGURE 6.. RBBP6 suppresses EBOV RNA synthesis.
(A) Schematic diagram of the EBOV minigenome assay. Luc: Renilla luciferase (B) Minigenome activity upon knockdown of RBBP6. HEK293T cells were transfected with 25nM scrambled siRNA or siRNA targeting RBBP6. 24 h post-transfection minigenome assay was performed using different concentrations of VP30. Data represent mean± S.D. from one representative experiment (n=3) of at least three independent experiments. See also Supplemental Figure S3A. (C) Minigenome activity in RBBP6 overexpressing cells. RBBP6 was transiently expressed along with plasmids for minigenome assay at two different doses (50 and 500ng) in HEK293T cells. Reporter activity was read 48 h post-transfection. Data represent mean± S.D. from one representative experiment (n=4) of at least three independent experiments. Statistical significance was calculated using Student’s t-test. See also Supplemental Figure S3B. (D) Minigenome assay was performed upon over-expression of peptides derived from RBBP6 and NP using VP30-wt and E197A mutant. Graph represents percent activity values and set relative to GFP expressing cells for each dose. Representative immunoblots are shown detecting protein levels of RBBP6/peptide and VP30. β-tubulin was used as a loading control. Data represent mean ± S.D. from one representative experiment (n=3) of at least three independent experiments. Statistical significance was calculated using ANOVA with Tukey’s multiple comparisons test. See also Supplemental Figure S3C-F and Supplemental Figure S4A-E.
FIGURE 7.
FIGURE 7.. RBBP6 restricts Ebola virus replication.
(A) HeLa cells were mock-transfected or transfected with a scrambled siRNA (SCR si) or siRNAs targeting either NPC1 (NPC1 si) or RBBP6 (RBBP6 si_1, RBBP6 si_2). After 48 h, cells were infected with EBOV-EGFP at an MOI of 0.1. Twenty-four hours later, samples were fixed, incubated with Hoechst dye to stain nuclei, and imaged. (B) The numbers of nuclei and EGFP-positive (infected) HeLa cells were counted using CellProfiler software, and infection efficiencies were determined as the ratio of infected cells to nuclei and shown relative to the infection level seen for the mock control. Mean relative infection efficiencies from three replicates ± SD are shown. Statistical significance was calculated relative to SCR siRNA treated cells using ANOVA with Tukey’s multiple comparisons test. See also Supplemental Figure S5A. (C) Expression levels of VP30 and NP in EBOV infected HeLa cell lysates upon knockdown of RBBP6 and NPC1. Percent protein levels were calculated relative to mock treated cells from two replicates. Statistical significance was calculated relative to SCR siRNA treated cells using ANOVA with Tukey’s multiple comparisons test. (D) HeLa cells were transfected with plasmids encoding (i) GFP-flag (ii) GFP-RBBP6 peptide (iii) GFP-RBBP6 peptide-flag (iv) GFP-linker-RBBP6 peptide. Transfected cells were distributed in 7 wells of a 96 well plate. Each well was challenged with EBOV for 24 h followed by Hoechst staining to identify nuclei and staining for viral glycoprotein (GP) to identify infected cells. Images were analyzed by CellProfiler software to quantify the intensity of GP signal. The impact of peptide expression on infection efficiency was measured as the relative infection efficiency seen in cells expressing GFP-flag compared to cells expressing GFP with the indicated RBBP6 peptide constructs. Statistical significance was calculated relative to GFP-flag expressing cells using ANOVA with Tukey’s multiple comparisons test. (E) Primary cells (MDM and HUVEC) were mock transfected or transfected with scrambled siRNA or siRNA targeting RBBP6, followed by infection with EBOV-EGFP at an MOI=0.04. Twenty-four hours post-infection, cells were fixed, stained and imaged. (F) The number of infected cells was calculated in MDM and HUVEC siRNA-treated cells and mean infection efficiencies relative to mock treatment from three replicates ± SD are shown. Statistical significance for RBBP6 siRNA treatment was calculated relative to SCR siRNA treated cells using ANOVA with Tukey’s multiple comparisons test. See also Supplemental Figure S5B and C. (G) MDM from two different donors and HUVEC cells were transfected with plasmids expressing GFP-flag or GFP-RBBP6 peptide-flag, followed by infection with EBOV (MOI=1). Twenty-four hours post-infection, cells were fixed and stained for GP and nuclei (Hoechst dye). The impact of peptide expression on infection efficiency was measured as for (D) and percent infection ± SD values were plotted. Statistical significance was calculated using unpaired Student’s t-test. See also Supplemental Figure S5D. (H) Model for the inhibition of EBOV replication by RBBP6.

Comment in

References

    1. Afonso CL, Amarasinghe GK, Banyai K, Bao Y, Basler CF, Bavari S, Bejerman N, Blasdell KR, Briand FX, Briese T, et al. (2016). Taxonomy of the order Mononegavirales: update 2016. Arch Virol 161, 2351–2360. - PMC - PubMed
    1. Anantpadma M, Kouznetsova J, Wang H, Huang R, Kolokoltsov A, Guha R, Lindstrom AR, Shtanko O, Simeonov A, Maloney DJ, et al. (2016). Large-Scale Screening and Identification of Novel Ebola Virus and Marburg Virus Entry Inhibitors. Antimicrob Agents Chemother 60, 4471–4481. - PMC - PubMed
    1. Baltz AG, Munschauer M, Schwanhausser B, Vasile A, Murakawa Y, Schueler M, Youngs N, Penfold-Brown D, Drew K, Milek M, et al. (2012). The mRNA-bound proteome and its global occupancy profile on protein-coding transcripts. Mol Cell 46, 674–690. - PubMed
    1. Banadyga L, Hoenen T, Ambroggio X, Dunham E, Groseth A, and Ebihara H (2017). Ebola virus VP24 interacts with NP to facilitate nucleocapsid assembly and genome packaging. Sci Rep 7, 7698. - PMC - PubMed
    1. Baron RC, McCormick JB, and Zubeir OA (1983). Ebola virus disease in southern Sudan: hospital dissemination and intrafamilial spread. Bull World Health Organ 61, 997–1003. - PMC - PubMed

Publication types

MeSH terms