. 2018 Dec 13;175(7):1972-1988.e16.
doi: 10.1016/j.cell.2018.11.021.

Organoid Modeling of the Tumor Immune Microenvironment

Affiliations

Organoid Modeling of the Tumor Immune Microenvironment

James T Neal et al. Cell. .

Abstract

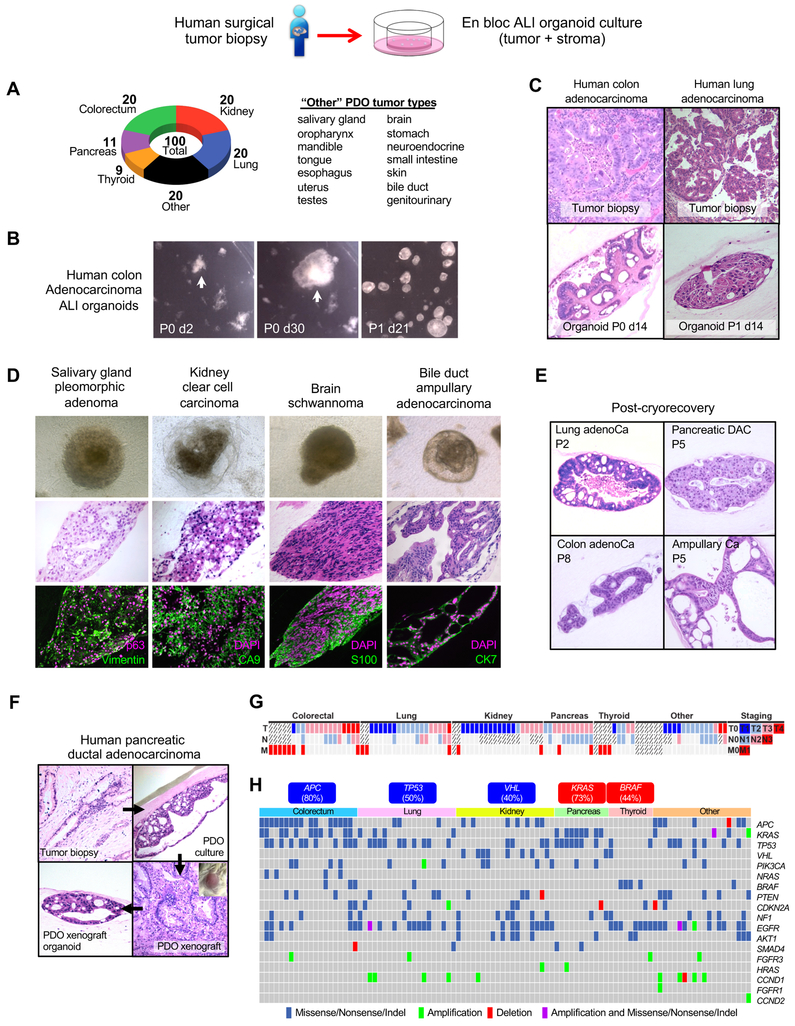
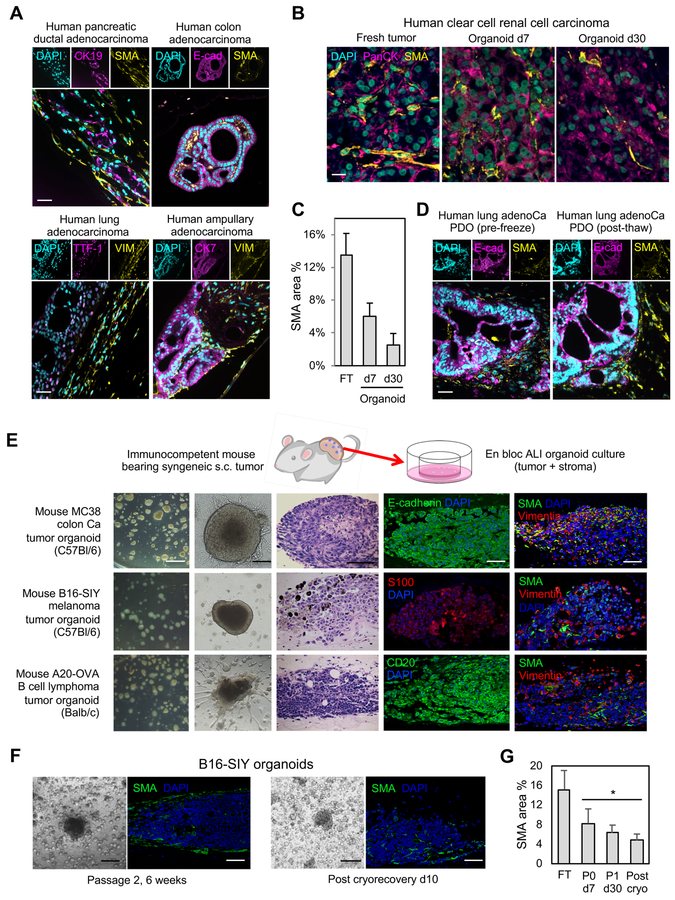
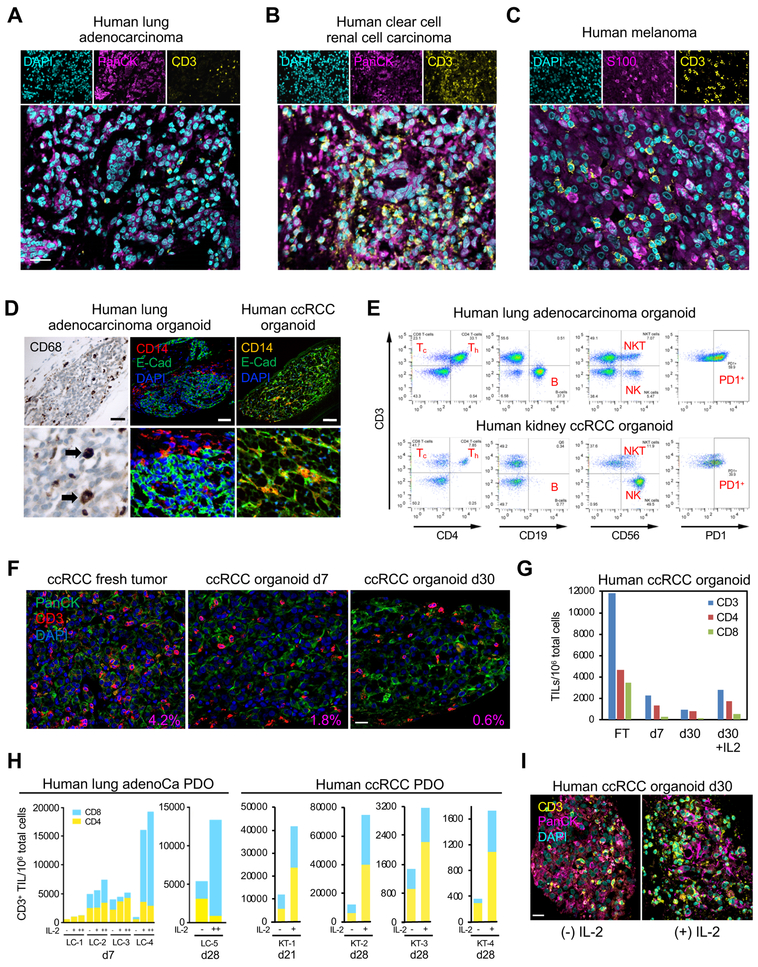
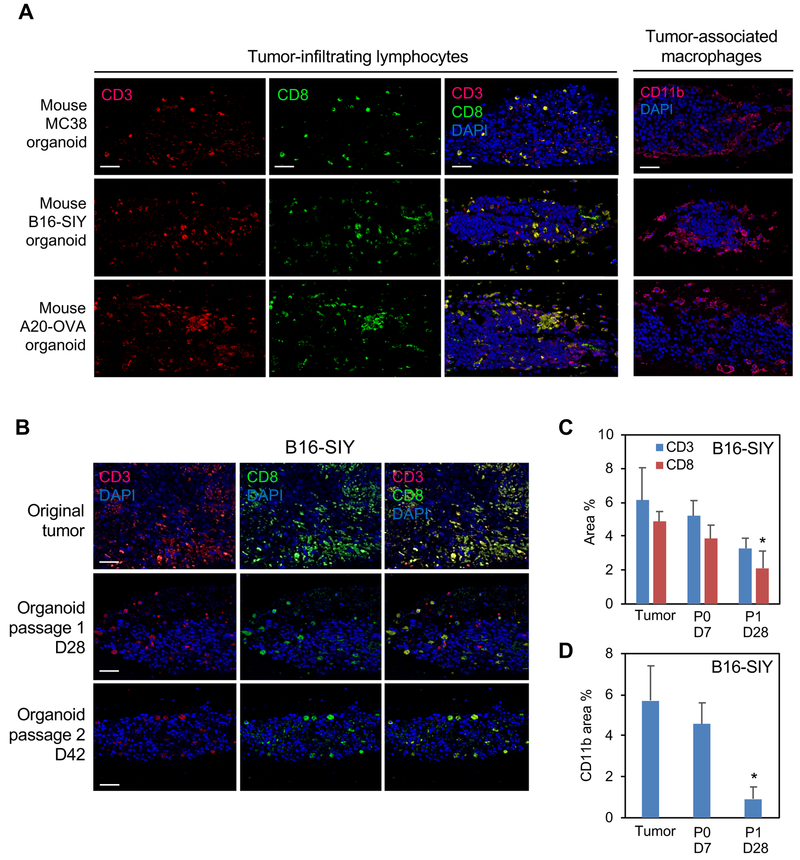
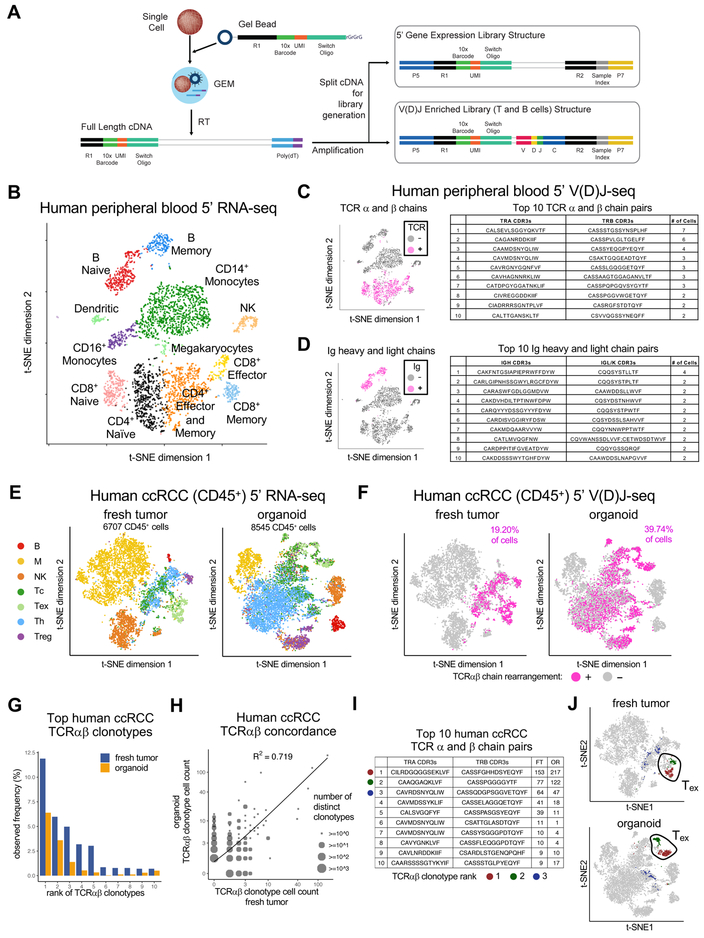
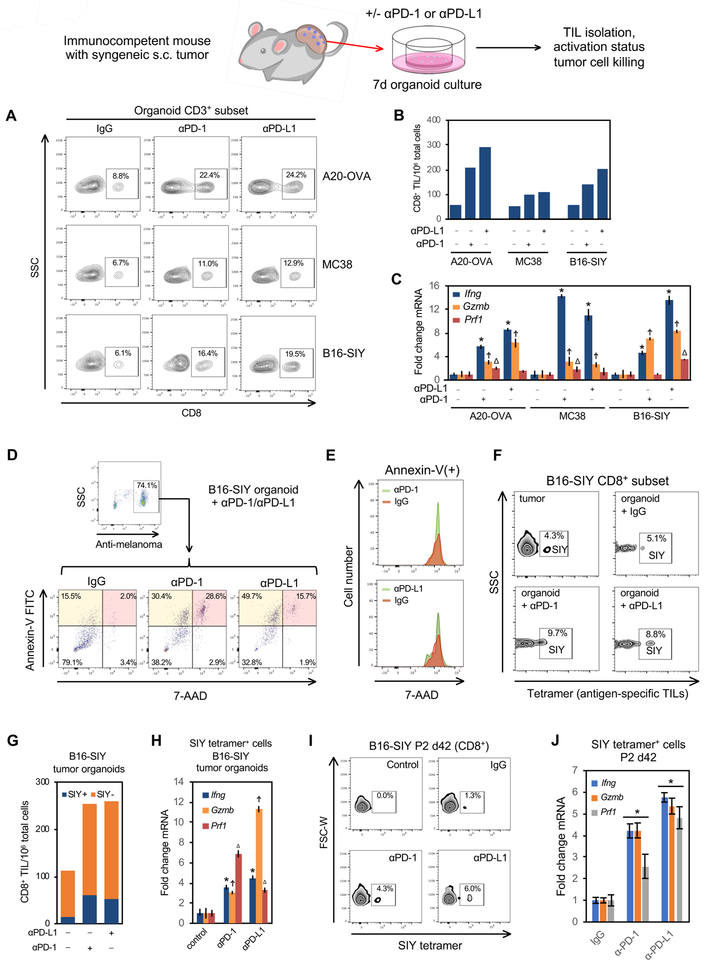
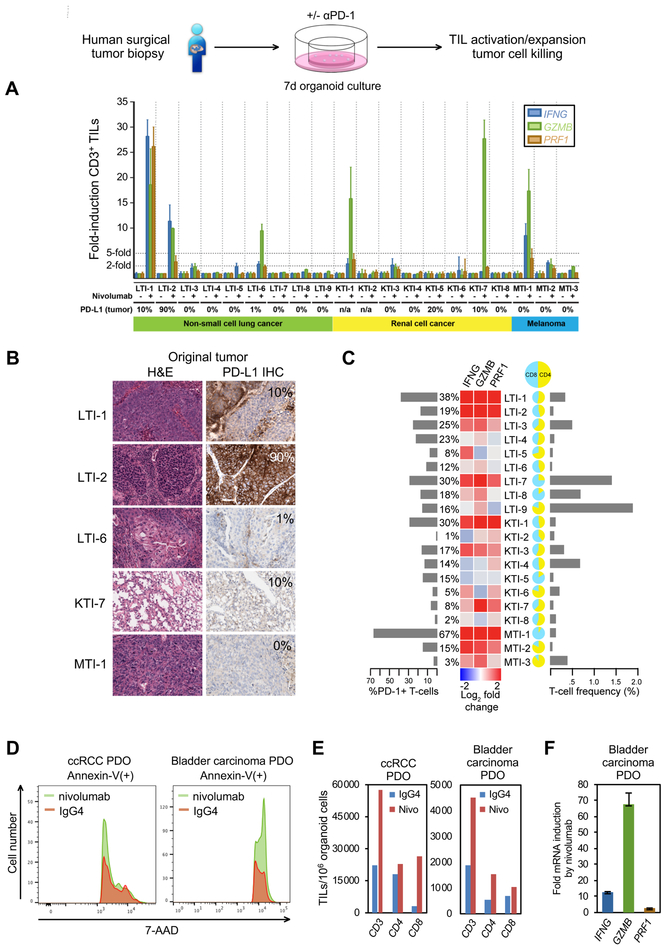
In vitro cancer cultures, including three-dimensional organoids, typically contain exclusively neoplastic epithelium but require artificial reconstitution to recapitulate the tumor microenvironment (TME). The co-culture of primary tumor epithelia with endogenous, syngeneic tumor-infiltrating lymphocytes (TILs) as a cohesive unit has been particularly elusive. Here, an air-liquid interface (ALI) method propagated patient-derived organoids (PDOs) from >100 human biopsies or mouse tumors in syngeneic immunocompetent hosts as tumor epithelia with native embedded immune cells (T, B, NK, macrophages). Robust droplet-based, single-cell simultaneous determination of gene expression and immune repertoire indicated that PDO TILs accurately preserved the original tumor T cell receptor (TCR) spectrum. Crucially, human and murine PDOs successfully modeled immune checkpoint blockade (ICB) with anti-PD-1- and/or anti-PD-L1 expanding and activating tumor antigen-specific TILs and eliciting tumor cytotoxicity. Organoid-based propagation of primary tumor epithelium en bloc with endogenous immune stroma should enable immuno-oncology investigations within the TME and facilitate personalized immunotherapy testing.

Keywords: PD-1; PDO; T cell receptor; TCR; cancer; checkpoint inhibitor; immunotherapy; organoid; single-cell RNA-seq; tumor-infiltrating lymphocyte.


Conflict of interest statement

DECLARATION OF INTERESTS

C.J.K. and J.T.N. are inventors on a patent describing the ALI PDO method. G.X.Y.Z and V.G. are employees and shareholders of 10X Genomics. C.J.K. is a founder, scientific advisory board member and shareholder of both TOMA Biosciences and Surrozen, Inc. C.J.K. is a consultant for BioTechne. D.M-V., F.M.DLV are employees and shareholders in TOMA Biosciences. WCH is a consultant for Thermo Fisher, AjuIB, MPM Capital, and Paraxel and receives research support from Deerfield. WCH is a founder, has equity and consults for KSQ Therapeutics.

Figures

Figure 1.
Figure 1.. Air-liquid interface culture of human patient-derived tumor organoids (PDOs).
(A) Air-liquid interface PDO cultures from diverse tumor types and histologies. (B) PDO primary culture and secondary passage. Stereomicroscopy, human colon adenocarcinoma PDO. (C) PDOs from primary colorectal adenocarcinoma or lung adenocarcinoma recapitulate original tumor histology. (D) Phase contrast (top), H&E (middle), and marker staining (bottom) of diverse day 30 PDOs. (E) Cryorecovery and serial passage of representative PDOs. (F) PDOs can be xenografted and re-derived as ALI organoids. Pancreatic ductal adenocarcinoma (PDAC) original histology (upper left) is recapitulated by PDO (upper right). PDOs grafted s.c. in NOG mice (lower right) generated tumors with PDAC histology which was preserved in organoids derived from the xenograft (lower left). (G) Successful PDO culture irrespective of disease stage. Bars represent TNM staging for tumors used for PDOs. Crosshatched bars indicate unavailable staging information. Each column represents a distinct tumor. (H) Significantly altered genes in 100 PDOs from end-to-end targeted exome and hot-spot exome PCR sequencing, with single nucleotide variation (SNV) and copy number alterations (CNA). Abbreviations: P = passage number. d=culture day. See also Mendeley Figures 1–6 and Tables S1–S2.
Figure 2.
Figure 2.. Human and mouse PDO cultures preserve integrated stromal cancer-associated fibroblasts.
(A) SMA+ and VIM+ cancer-associated fibroblasts (CAFs) in human PDOs. Top, SMA+ CAFs in human PDAC, colorectal adenocarcinoma and thyroid carcinoma PDOs. Tumor parenchyma (CK19, E-cadherin, thyroglobulin (TG)) and SMA immunofluorescence (IF) is shown. Bottom, VIM+ CAFs from human lung adenocarcinoma, pancreatic ductal adenocarcinoma and ampullary adenocarcinoma PDOs. IF for tumor parenchyma (TTF-1, CK19 and CK7) and VIM, culture d30. (B) Time course of CAF preservation in representative human clear cell RCC PDO in fresh tumor (d0) and culture days 7 and 30. PanCK (magenta) and SMA (yellow) IF. DAPI (cyan). Scale bar = 20 μm. (C) Area quantitation of (B). N=4 areas, error bars +/− SEM, all values P<0.05 versus each other. (D) Cryopreservation of PDOs preserves architecture and epithelial/stromal compartments. Lung adenocarcinoma PDO at day 30 and passage 2 day 21 after cryorecovery. H&E and IF for epithelium (E-cadherin) and stroma (SMA), scale bar = 50 μm. (E) ALI cultures from the indicated s.c. mouse tumors borne in syngeneic immunocompetent hosts. Column 1: stereomicroscopy after passage 1 (P1) d10 (scale bar = 400 μm). Column 2: phase contrast of P0 d7 (scale bar = 200 μm). Column 3: H&E (scale bar = 100 μm). Columns 4 and 5: tumor lineage marker IF staining (E-cadherin, S100, CD20) or stroma (SMA, VIM) (4th and 5th column; scale bar = 50 μm). Columns 3–5 are culture d7. (F) Passage and cryopreservation of B16-SIY mouse ALI tumor cultures. SMA IF is depicted (green) (scale bars: light microscopy = 200 μm; IF=50 μm). (G) Area quantitation of (F), B16-SIY organoids vs. fresh tumor with SMA IF. n=5, average +/−SEM, * = P < 0.05 (organoids at indicated time vs. tumor). Abbreviations: FT= fresh tumor, P=passage number, d=culture day. See also Mendeley Figure 7.
Figure 3.
Figure 3.. Immune components within human PDOs.
(A-C) IF staining of d14 PDOs from lung adenocarcinoma (A), clear cell renal cell carcinoma (ccRCC) (B), and melanoma (C) identifies CD3+ TILs (yellow) closely associated with tumor epithelium (magenta, PanCK, S100), DAPI (cyan), scale bar = 25 μm. (D) PDOs contain TAMs. PDO anti-CD14, E-Cad or CD68 IF staining in human clear cell renal cell carcinoma (ccRCC) (top) or human lung adenocarcinoma (middle, bottom). Scale bar = 50 μm. (E) Diverse immune components upon FACS analysis of d7 lung adenocarcinoma and ccRCC PDOs. (F) CD3+ TIL content in representative human ccRCC PDO in fresh tumor (d0) and culture days 7 and 30. PanCK (green) and CD3+ TIL (red) IF and DAPI (blue) co-stain. % area ratio of CD3+ cells indicated in red in the lower right corner. Scale bar = 20 μm. (G) FACS quantitation of CD3, CD4 and CD8 TIL number/106 organoid cells from representative ccRCC PDO, +/− IL-2 for fresh tumor (FT) and culture d7 and d30. (H) FACS analysis of IL-2-expanded organoid TILs. LC-1 – LC-4: independent lung NSCLC PDOs grown for 7d +/− IL-2. −, no IL-2; +, 600 IU/mL IL-2; ++, 6000 IU/mL IL-2. LC-5 and KT-1–4 (ccRCC) PDO-infiltrating T-cells persist at d21–28 without IL-2 but are significantly expanded with IL-2 (6000 IU/mL). ccRCC: d28 ccRCC PDO analyzed as in LC-1–5. Blue=CD8, Yellow=CD4. (I) CD3+ TIL IF staining in representative d30 ccRCC PDO +/− IL-2 (100 IU/ml). CD3 (yellow), PanCK (magenta), DAPI (cyan). Scale bar = 20 μm.
Figure 4.
Figure 4.. Immune components within mouse ALI tumor organoids.
(A) Mouse ALI organoids from syngeneic s.c. mouse MC38, B16-SIY and A20-OVA tumors retain integrated TILs and TAMs at culture d7. Rows 1–3: IF for CD3 (red, left column), CD8 (green, middle column) or merge (yellow, right column). Row 4: CD11b IF (red). DAPI (blue). Scale bar = 50 μm. d=culture day. (B) Integrated TILs persist in mouse B16-SIY ALI organoids after serial passage and extended time points. CD3 (red) and CD8 (green) IF, DAPI (blue). Scale bar = 50 μm. (C,D) Area quantitation of B16-SIY organoids vs. fresh tumor. NN=2 sections from 2 biological replicates (N=4 total), error bars +/− SEM, *= P < 0.05 (CD8:P1 d28 vs. CD8:tumor) or (CD11b:P1 d28 vs. CD11b:tumor).
Figure 5.
Figure 5.. Droplet-based tandem single cell 5’ V(D)J and 5’ RNA-seq of immune cells.
(A) Chromium single cell Immune Profiling Solution. Single cell 5’ GEX and enrichment libraries can be generated from the same sample. (B) t-SNE plot of 5’ scRNA-seq human healthy donor PBMCs. (C, D) (Left) t-SNE plot of (B) with PBMCs having rearranged TCR (C) or Ig (D) clonotypes by single cell 5’ V(D)J-seq and T cell enrichment assay (magenta). (Right) Top 10 paired TCR (C) or Ig (D) clonotypes from T or B cells, respectively. (E) t-SNE plots of 5’ RNA-seq of human ccRCC CD45+ FACS-sorted cells from fresh tumor (FT, left) or day 7 PDO (right). (F) t-SNE plots of single cell 5’ V(D)J-seq of human ccRCC CD45+ cells from FT (left) vs. day 7 PDO (right). Cells with detected TCR clonotypes by 5’ V(D)J T cell enrichment assay from (E) are colored in magenta and correspond to T cell identity by 5’ scRNA-seq in (E). (G) Observed frequency of top 10 TCR clonotypes in FT vs. PDO from (E) (ranked by order in FT). (H) Scatter plot of cell counts between matching FT and PDO clonotypes from (F) (log scale). Circles with larger sizes indicate multiple overlapping data points, i.e., distinct clonotypes having same frequencies in fresh tumor and organoid. Concordance (R2 = 0.719) between FT and PDO is significant (p < 0.01, permutation test). (I) Paired TCRαβ chain sequences and exact cell counts of the number of individual TILs expressing each unique TCR clonotype in F and G. The top 3 clonotypes are denoted by dark red, green and blue dots. (J) t-SNE plots denoting the top 2 clonotypes in FT and PDO localize to exhausted T cells identified by 5’ RNA-seq in (E). See also Figures S1–S5, Mendeley Figures 8–9, Table S3 and STAR Methods.
Figure 6.
Figure 6.. A functional PD-1/PD-L1 immune checkpoint in organoids derived from s.c. mouse tumors in syngeneic immunocompetent hosts.
(A) FACS analysis of CD3+CD8+ T cells in B16-SIY, A20-OVA and MC38 mouse tumor-derived organoids after 7 days in vitro αPD-1/αPD-L1 treatment vs. IgG, from a single representative experiment from n=3 biological replicates for each tumor line. (B) FACS quantification of CD8+ TILs/106 organoid cells from (A) after 7 days organoid αPD-1 and αPD-L1 treatment. (C) Quantitative RT-PCR (qRT-PCR) analysis of FACS-sorted CD3+ TILs from (A) after 7 days of αPD-1 and αPD-L1 treatment. Ifng, Gzmb and Prf1 mRNA expression normalized to control IgG. N=3. Error bars, +/− SEM * Ifng, Ϯ Gzmb or Δ Prf1 control vs. αPD-1/αPD-L1 = P<0.05. (D) αPD-1 and αPD-L1 induce tumor organoid epithelial cell cytotoxicity. B16-SIY ALI organoids from syngeneic C57BL/6 s.c tumors were cultured for 7d +/− αPD-1, αPD-L1 or IgG. Tumor epithelial cell death was analyzed by FACS using anti-melanoma antibody pre-gating to denote Annexin-V(+)/7-AAD(−) early apoptotic (orange) and Annexin-V(+)/7-AAD(+) late apoptotic/necrotic cells (pink). Representative of n=3 independent experiments. (E) FACS histogram plot of 7-AAD staining within late apoptotic/necrotic Annexin-V(+) cells from (D). (F) SIY tetramer FACS staining of antigen-specific T cells per total CD8+ T cells in freshly dissociated parental B16-SIY tumor (upper left) vs, B16-SIY organoids (panels 2–4) after 7d αPD-1, αPD-L1 or IgG treatment. Negative control SIIN tetramer was devoid of signal. Representative of n=3 independent experiments. (G) Quantification of SIY tetramer-reactive CD8+ TILs per total organoid cells from (F). (H) qRT-PCR of FACS-sorted SIY tetramer-reactive CD8+ TILs from (F). N=3 technical replicates. Error bars, +/− SEM, * Ifng, Ϯ Gzmb or Δ Prf1 control vs.: αPD-1/αPD-L1 = vs. IgG control, P<0.05. (I) αPD-1 and αPD-L1 induce SIY-specific TILs in passage 2 B16-SIY organoids, culture d42. FACS of CD8+ SIY tetramer-reactive TILs. Representative of n=3 independent experiments. (J) qRT-PCR analysis of CD8+ SIY tetramer-reactive TILs from (I). N=3 technical replicates. Error bars, +/− SEM, *= P<0.05 vs. IgG. See also Figure S6, Mendeley Figure 10 and STAR Methods.
Figure 7.
Figure 7.. In vitro recapitulation of the PD-1-dependent immune checkpoint in PDOs derived from human surgical tumor resections.
(A) IFNG, GZMB, and PRF1 qRT-PCR of FACS-sorted CD3+ TILs from NSCLC, RCC and melanoma PDOs, after 7 days nivolumab or control IgG4 treatment, nivolumab-treated normalized to IgG4. 28–8 PD-L1 IHC % is depicted (n/a: original tumor not available for PD-L1 IHC), N=3 technical replicate determination. Error bars, +/− SEM. (B) Clone 28–8 PD-L1 IHC of fresh tumor from PDO responders from (A). Original histology from a sixth responding PDO was not available for analysis. (C) FACS T-cell profiling of PDOs versus qRT-PCR +/− nivolumab with % PD-1 T cells, % T cells per total viable organoid cells, and CD4:CD8 ratio. (D) Anti-PD-1/nivolumab induction of PDO tumor epithelial cell death. 7-AAD FACS histogram of Annexin V(+) tumor epithelial cells. Human ccRCC or bladder urothelial carcinoma PDOs received nivolumab or IgG4 with anti-CD3 + anti-CD28 for 7 days. (E) FACS analysis of CD3+, CD8+ and CD4+ PDO TILs per 106 organoid cells from (D). (F) qRT-PCR of PRF1, GZMB and IFNG from FACS-sorted CD3+ PDO TILs from (D) as fold-change mRNA for nivolumab vs. IgG4 (all significant at P<0.001). N=3 technical replicates, error bars, +/− SEM. See also Figures S6B–D, S7 and STAR Methods.

Comment in

References

    1. Anagnostou V, Smith KN, Forde PM, Niknafs N, Bhattacharya R, White J, Zhang T, Adleff V, Phallen J, Wali N, et al. (2017). Evolution of Neoantigen Landscape during Immune Checkpoint Blockade in Non-Small Cell Lung Cancer. Cancer Discov 7, 264–276. - PMC - PubMed
    1. Azizi E, Carr AJ, Plitas G, Cornish AE, Konopacki C, Prabhakaran S, Nainys J, Wu K, Kiseliovas V, Setty M, et al. (2018). Single-Cell Map of Diverse Immune Phenotypes in the Breast Tumor Microenvironment. Cell 174, 1293–1308.e1236. - PMC - PubMed
    1. Bailey P, Chang DK, Nones K, Johns AL, Patch AM, Gingras MC, Miller DK, Christ AN, Bruxner TJ, Quinn MC, et al. (2016). Genomic analyses identify molecular subtypes of pancreatic cancer. Nature 531, 47–52. - PubMed
    1. Barretina J, Caponigro G, Stransky N, Venkatesan K, Margolin AA, Kim S, Wilson CJ, Lehar J, Kryukov GV, Sonkin D, et al. (2012). The Cancer Cell Line Encyclopedia enables predictive modelling of anticancer drug sensitivity. Nature 483, 603–607. - PMC - PubMed
    1. Boj SF, Hwang CI, Baker LA, Chio II, Engle DD, Corbo V, Jager M, Ponz-Sarvise M, Tiriac H, Spector MS, et al. (2015). Organoid models of human and mouse ductal pancreatic cancer. Cell 160, 324–338. - PMC - PubMed

Publication types