. 2019 Mar:77:55-65.
doi: 10.1016/j.bbi.2018.12.004. Epub 2018 Dec 11.

Toll-like receptor 3 activation increases voluntary alcohol intake in C57BL/6J male mice

Affiliations

Toll-like receptor 3 activation increases voluntary alcohol intake in C57BL/6J male mice

Anna S Warden et al. Brain Behav Immun. 2019 Mar.

Abstract

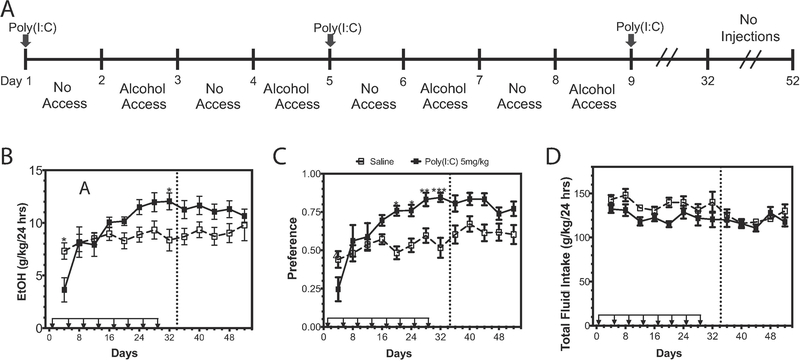
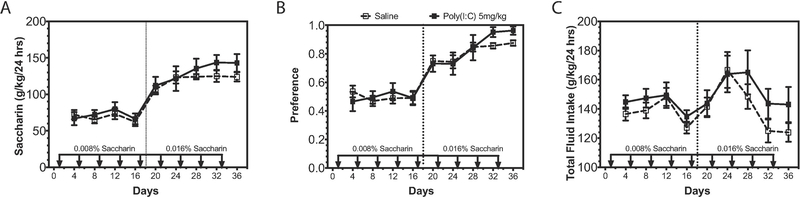
Many genes differentially expressed in brain tissue from human alcoholics and animals that have consumed large amounts of alcohol are components of the innate immune toll-like receptor (TLR) pathway. TLRs initiate inflammatory responses via two branches: (1) MyD88-dependent or (2) TRIF-dependent. All TLRs signal through MyD88 except TLR3. Prior work demonstrated a direct role for MyD88-dependent signaling in regulation of alcohol consumption. However, the role of TLR3 as a potential regulator of excessive alcohol drinking has not previously been investigated. To test the possibility TLR3 activation regulates alcohol consumption, we injected mice with the TLR3 agonist polyinosinic:polycytidylic acid (poly(I:C)) and tested alcohol consumption in an every-other-day two-bottle choice test. Poly(I:C) produced a persistent increase in alcohol intake that developed over several days. Repeated poly(I:C) and ethanol exposure altered innate immune transcript abundance; increased levels of TRIF-dependent pathway components correlated with increased alcohol consumption. Administration of poly(I:C) before exposure to alcohol did not alter alcohol intake, suggesting that poly(I:C) and ethanol must be present together to change drinking behavior. To determine which branch of TLR signaling mediates poly(I:C)-induced changes in drinking behavior, we tested either mice lacking MyD88 or mice administered a TLR3/dsRNA complex inhibitor. MyD88 null mutants showed poly(I:C)-induced increases in alcohol intake. In contrast, mice pretreated with a TLR3/dsRNA complex inhibitor reduced their alcohol intake, suggesting poly(I:C)-induced escalations in alcohol intake are, at least partially, dependent on TLR3. Together, these results strongly suggest that TLR3-dependent signaling drives excessive alcohol drinking behavior.

Keywords: Alcohol use disorder; Cytokines; Drinking; Ethanol; Neuroimmune; Poly(I:C); Toll-like receptors.


Conflict of interest statement

The authors report no biomedical financial interests or potential conflicts of interest.

Figures

Figure 1:
Figure 1:. Poly(I:C) increases innate immune mRNA levels in prefrontal cortex.
Heat map showing transcript abundance at four time points, before and following administration of poly(I:C). The transcript levels are presented using fold-change values (Log2 format) normalized to endogenous control. The red and green colors indicate high and low transcript abundance, respectively. The scale representing the relative signal intensity values is shown on the right. Data were analyzed by hierarchical clustering, n=6 per group.
Figure 2:
Figure 2:. Poly(I:C) increases alcohol intake over time.
(A) C57BL/6J male mice were injected with saline or poly(I:C) (5mg/kg) every four days for a total of eight injections during two-bottle choice, every-other-day drinking (EOD,15%). (B) Ethanol (EtOH) intake (g/kg/24 h); (C) preference for EtOH; (D) total fluid intake. Arrows indicate days when animals received injections. Dashed line represents a “no injection” period during which animals continued EOD without injections. Data represented as mean ± s.e.m. (***p<0.0002, **p<0.0021, *p<0.05 for Bonferroni post-hoc tests, n=10 per group).
Figure 3:
Figure 3:. Poly(I:C) increases alcohol intake across multiple doses.
(A) C57BL/6J male mice were injected with saline, poly(I:C) (2mg/kg), or poly(I:C) (10mg/kg) every four days during a two-bottle choice every-other-day drinking procedure (EOD, 15% or 20%). (B) Ethanol (EtOH) intake (g/kg/24 h); (C) preference for EtOH; (D) total fluid intake. Dashed line represents a “no injection” period during which animals continued EOD without injections. Data represented as mean ± s.e.m. (****p<0.0001, ***p<0.0002, **p<0.0021, *p<0.05 for Bonferroni post-hoc tests, n=10 per group).
Figure 4:
Figure 4:. Pretreatment with poly(I:C) does not alter subsequent alcohol intake.
(A) C57BL/6J male mice were pretreated with saline or poly(I:C) (5mg/kg) every four days for a total of eight injections before beginning a two-bottle-choice every-other-day procedure (EOD,15%). (B) Ethanol (EtOH) intake (g/kg/24 h); (C) preference for EtOH; (C) total fluid intake. Dashed line represents when injections were resumed during the EOD procedure. Data represented as mean ± s.e.m. (**p<0.0021, *p<0.05 for Bonferroni post-hoc tests, n=10 per group).
Figure 5:
Figure 5:. Chronic ethanol and poly(I:C) alter innate immune transcript abundance.
Male C57BL6/J mice underwent 36 days of two-bottle-choice, every-other-day drinking (EOD, 15%) with poly(I:C) (5mg/kg) injections every four days for a total of eight injections. Mice were euthanized and prefrontal cortex dissected 24 hours after the final drinking session on day 36. (A) Heat map of innate immune gene transcript abundance and correlations after both poly(I:C) and ethanol. The levels of transcripts are presented as fold-change values (Log2 format) normalized to respective saline-treated groups. The red and green colors indicate high and low transcript abundance or correlation strength. There were significant negative correlations between Myd88 (B) and amount of ethanol consumed and between Ikkβ (C) and amount of ethanol consumed in poly(I:C)-treated mice. There were significant positive correlations between Ticam1 (D) and amount of ethanol consumed and between Ikkε (E) and amount of ethanol consumed in poly(I:C)-treated mice. There was a significant negative correlation between Ifnb1 (F) and amount of ethanol consumed in poly(I:C)-treated mice. (****p<0.0001, ***p<0.0002, **p<0.0021, *p<0.05 for Tukey post-hoc tests and correlations, n=6 per group).
Figure 6:
Figure 6:. Poly(I:C) increases alcohol intake independent of MyD88.
Mutant male mice (Myd88 −/−) were injected with saline or poly(I:C) (5mg/kg) every four days for a total of six injections during a two-bottle choice every-other-day drinking procedure (EOD, 15%). (A) Ethanol (EtOH) intake (g/kg/24 h); (B), preference for EtOH; (C) total fluid intake (n=10 per group).
Figure 7:
Figure 7:. TLR3/dsRNA complex inhibitor reduces poly(I:C)-induced increases alcohol intake.
C57BL/6J male mice were injected with saline(10%DMSO) or poly(I:C) (5mg/kg) every four days for a total of nine injections during EOD (15%v/v). Once poly(I:C) increased alcohol intake above saline controls, we injected TLR3/dsRNA complex inhibitor (2mg, i.p.) then injected poly(I:C) (5mg/kg, i.p.) and allowed mice to undergo eight days EOD. (A) Ethanol (EtOH) intake (g/kg/24 h); (B) preference; (C) total fluid intake (g/kg/24h). There was a significant decrease in alcohol intake after each inhibitor pretreatment (Injection #1: t(16)=2.336, p=0.033; Injection #2, t(16)=2.83, p=0.013). Preference (Injection #1: t(16)=0.12, p=0.91; Injection #2, t(16)=0.64, p=0.52) and total fluid intake (Injection #1: t(16)=1.19, p=0.25; Injection #2, t(16)=1.96, p=0.07) were unaffected by treatment. Student’s t-tests (*p<0.05, **p<0.02 compared with saline/poly(I:C) group, n=10 per group).
Figure 8:
Figure 8:. Poly(I:C) does not change taste perception.
C57BL/6J male mice were injected with saline or poly(I:C) (5mg/kg) every four days for a total of nine injections during a two-bottle choice every-other-day saccharin procedure (0.0008% or 0.016%). Dashed line represents change in saccharin concentration. (A) Saccharin consumption (g/kg/24 h); (B) preference for saccharin; (C) total fluid intake (g/kg/24 h) (n=10 per group).

References

    1. Robinson G, Most D, Ferguson LB, Mayfield J, Harris RA, Blednov YA (2014): Neuroimmune pathways in alcohol consumption: evidence from behavioral and genetic studies in rodents and humans. Int Rev Neurobiol 118:13–39. - PMC - PubMed
    1. Crews FT, Walter TJ, Coleman LG, Vetreno RP (2017): Toll-like receptor signaling and stages of addiction. Psychopharmacology (Berl) 234:1483–1498. - PMC - PubMed
    1. Montesinos J, Alfonso-Loeches S, Guerri C (2016): Impact of the Innate Immune Response in the Actions of Ethanol on the Central Nervous System. Alcohol Clin Exp Res 40:2260–2270. - PubMed
    1. Liu J, Lewohl JM, Harris RA, Iyer VR, Dodd PR, Randall PK, et al. (2006): Patterns of gene expression in the frontal cortex discriminate alcoholic from nonalcoholic individuals. Neuropsychopharmacology 31:1574–1582. - PubMed
    1. Okvist A, Johansson S, Kuzmin A, Bazov I, Merino-Martinez R, Ponomarev I, et al. (2007): Neuroadaptations in human chronic alcoholics: dysregulation of the NF-kappaB system. PLoS One 2:e930. - PMC - PubMed

Publication types