. 2018 Dec 13;9(12):627.
doi: 10.3390/genes9120627.

A-to-I RNA Editing Affects lncRNAs Expression after Heat Shock

Affiliations

A-to-I RNA Editing Affects lncRNAs Expression after Heat Shock

Roni Haas et al. Genes (Basel). .

Abstract

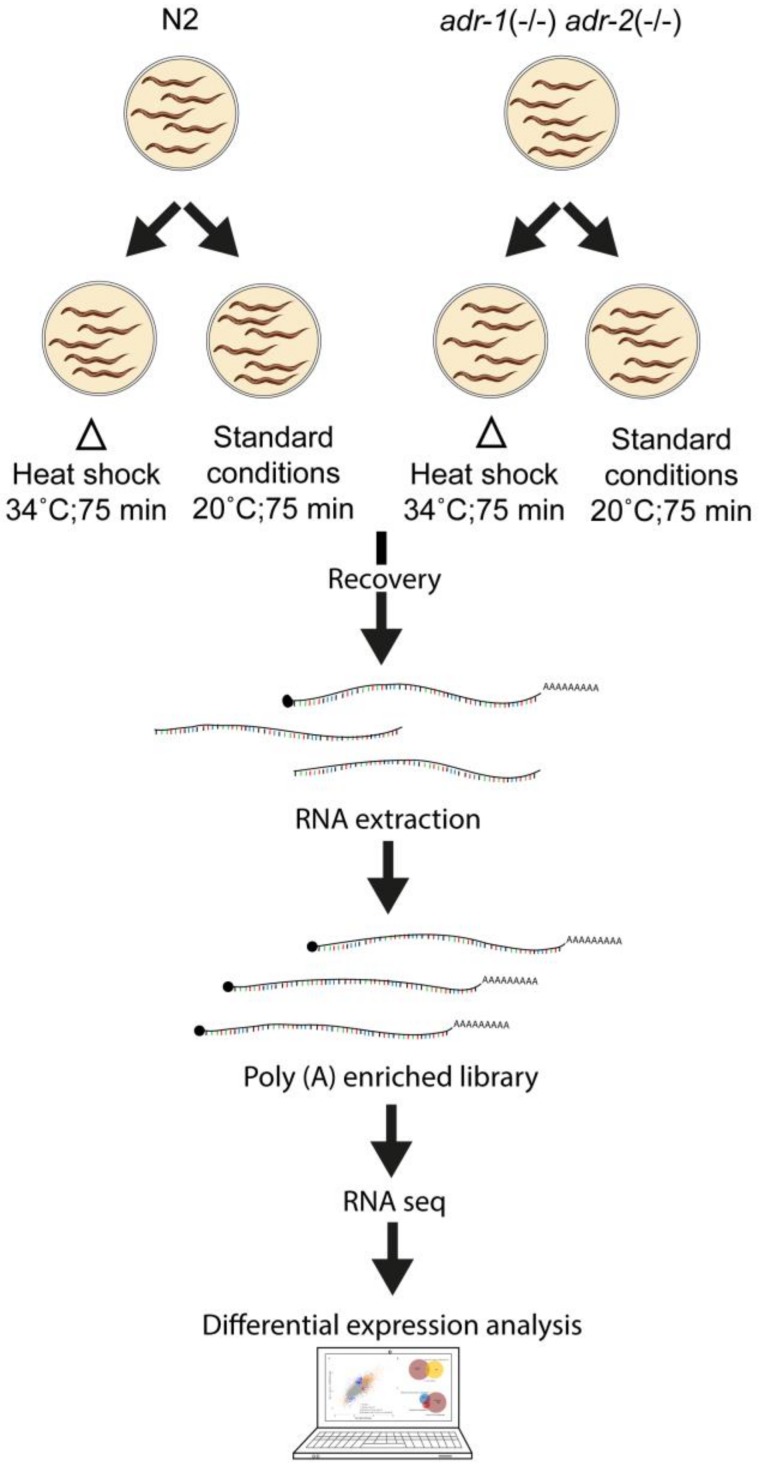
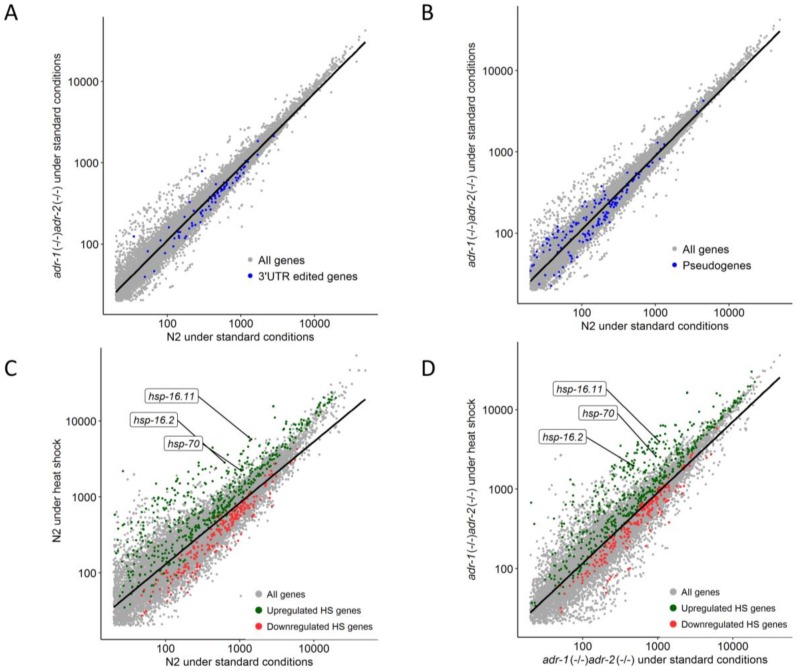
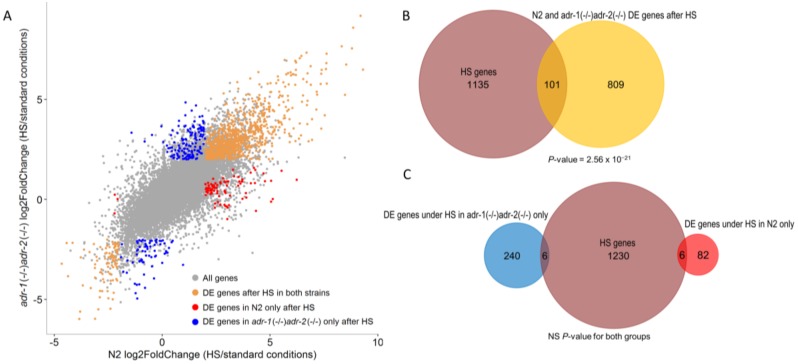
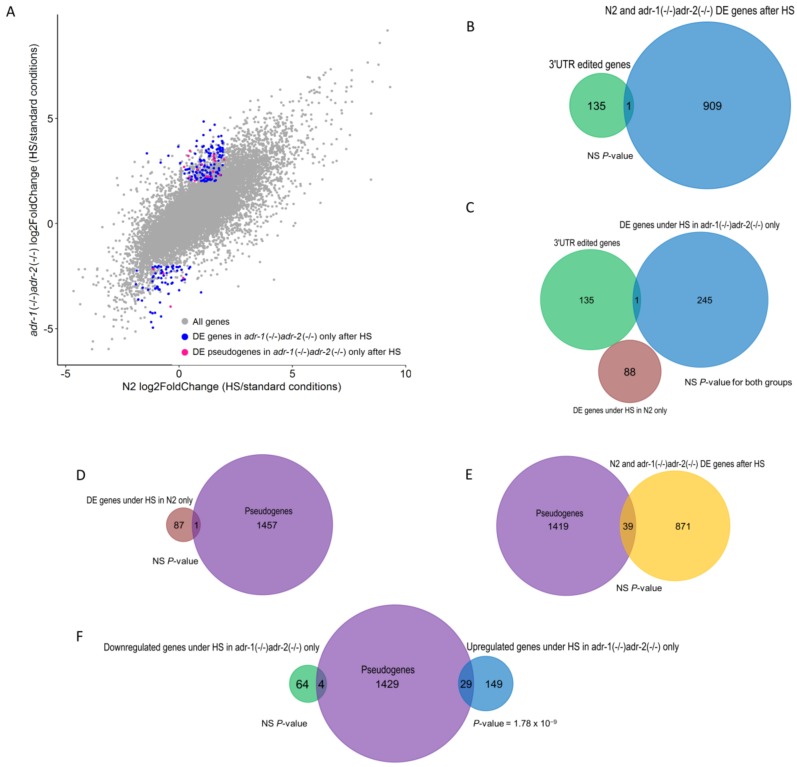
Adenosine to inosine (A-to-I) RNA editing is a highly conserved regulatory process carried out by adenosine-deaminases (ADARs) on double-stranded RNA (dsRNAs). Although a considerable fraction of the transcriptome is edited, the function of most editing sites is unknown. Previous studies indicate changes in A-to-I RNA editing frequencies following exposure to several stress types. However, the overall effect of stress on the expression of ADAR targets is not fully understood. Here, we performed high-throughput RNA sequencing of wild-type and ADAR mutant Caenorhabditis elegans worms after heat-shock to analyze the effect of heat-shock stress on the expression pattern of genes. We found that ADAR regulation following heat-shock does not directly involve heat-shock related genes. Our analysis also revealed that long non-coding RNAs (lncRNAs) and pseudogenes, which have a tendency for secondary RNA structures, are enriched among upregulated genes following heat-shock in ADAR mutant worms. The same group of genes is downregulated in ADAR mutant worms under permissive conditions, which is likely, considering that A-to-I editing protects endogenous dsRNA from RNA-interference (RNAi). Therefore, temperature increases may destabilize dsRNA structures and protect them from RNAi degradation, despite the lack of ADAR function. These findings shed new light on the dynamics of gene expression under heat-shock in relation to ADAR function.

Keywords: ADAR; Caenorhabditis elegans; stress response; transcriptomics.


Conflict of interest statement

The authors declare no conflict of interest.

Figures

Figure 1
Figure 1
Schematic view of the heat-shock experiments.
Figure 2
Figure 2
Gene expression changes under standard conditions and upon heat shock. (A,B) Log scale plots presenting normalized gene counts of at least three biological samples in adenosine-deaminases (ADAR) mutant worms compared to wild-type (N2) worms, under standard conditions. Grey dots represent all genes (n = 12,059), blue dots represent 3′ UTR-edited genes (n = 81) (A) and pseudogenes and long non-coding RNAs (lncRNAs) (n = 216) (B), and the black line is the regression line for all genes. (C,D) Log scale plots representing normalized gene counts of at least three biological samples under heat shock compared to standard conditions, for N2 (C) and for ADAR mutant (D). Grey dots are all genes, the black line is the regression line for all genes, green and red dots are upregulated and downregulated heat shock related genes, respectively, as reported by Brunquell, et al. [34] that had the same tendency in our study. HS: heat shock. For all figures (AD), only genes that their normalized gene count was higher than 20 are presented.
Figure 3
Figure 3
Differentially-expressed sets of genes under heat shock that are specific to the ADAR mutant or N2 and are not heat-shock related genes. (A) A plot representing the Log2 fold-change values (gene expression after heat shock versus standard conditions) of the ADAR mutants vs. the wild-type (N2). Grey dots represent all genes, orange dots represent significant differentially-expressed genes in both ADAR mutant and N2 worms, blue dots represent significant differentially-expressed genes specific to ADAR mutant worms, and red dots represent significant differentially-expressed genes specific to N2 worms. DE: differentially expressed. (B) A Venn diagram showing that the previously identified heat-shock related genes are highly enriched among genes that were differentially expressed in both ADAR mutants and N2. The number of heat shock genes and the differentially-expressed genes are shown in brown and orange, respectively. (C) A Venn diagram depicting that previously identified heat-shock genes are not enriched among genes that were only differentially expressed in either ADAR mutant or N2. The number of heat-shock genes, differentially-expressed genes in the ADAR mutants only, and differentially-expressed genes in N2 only are shown in brown, blue and red, respectively. NS: non-significant (p-value > 0.05).
Figure 4
Figure 4
Long non-coding RNAs and pseudogenes are upregulated upon heat shock in ADAR mutants. (A) Scatter plot presenting log2 fold-change values (gene expression after heat shock vs. standard conditions) of the ADAR mutants compared to the wild-type (N2). Grey dots are all genes, blue dots are significant differentially-expressed genes specific to ADAR mutants, purple dots are significantly differentially-expressed pseudogenes specific to ADAR mutants. (B,C) Venn diagrams showing that genes edited at their 3’UTR are not enriched among genes that were differentially expressed under heat shock. The number of 3’UTR edited genes, differentially expressed in both N2 and the ADAR mutants, differentially expressed in the wild-type only, and differentially expressed in the ADAR mutants only are shown in purple, orange, red, and blue, respectively. (D,E) Venn diagrams showing that pseudogenes and lncRNAs are not enriched among genes that were differentially expressed in both ADAR mutants and wild-type or in wild-type only. The number of pseudogenes, differentially-expressed genes in N2 only (D), and differentially-expressed genes in both N2 and ADAR mutants (E), are shown in purple, red, and orange, respectively. (F) Venn diagram depicting that pseudogenes are significantly enriched among upregulated genes, which are specific to the ADAR mutant. The number of pseudogenes, the upregulated genes, and the downregulated genes are shown in purple, blue, and green, respectively. (p-value > 0.05).

References

    1. Morimoto R.I. Regulation of the heat shock transcriptional response: Cross talk between a family of heat shock factors, molecular chaperones, and negative regulators. Genes Dev. 1998;12:3788–3796. doi: 10.1101/gad.12.24.3788. - DOI - PubMed
    1. Lindquist A., Craig E.A. The heat-shock proteins. Annu. Rev. Genet. 1988;22:631–677. doi: 10.1146/annurev.ge.22.120188.003215. - DOI - PubMed
    1. Prahlad V., Cornelius T., Morimoto R.I. Regulation of the cellular heat shock response in Caenorhabditis elegans by thermosensory neurons. Science. 2008;320:811–814. doi: 10.1126/science.1156093. - DOI - PMC - PubMed
    1. Buchumenski I., Bartok O., Ashwal-Fluss R., Pandey V., Porath H.T., Levanon E.Y., Kadener S. Dynamic hyper-editing underlies temperature adaptation in Drosophila. PLOS Genet. 2017;13:e1006931. doi: 10.1371/journal.pgen.1006931. - DOI - PMC - PubMed
    1. Garrett S.C., Rosenthal J.J.C. A Role for A-to-I RNA editing in temperature adaptation. Physiology. 2012;27:362–369. doi: 10.1152/physiol.00029.2012. - DOI - PMC - PubMed