. 2018 Dec 13;9(12):630.
doi: 10.3390/genes9120630.

Enhancer Trapping and Annotation in Zebrafish Mediated with Sleeping Beauty, piggyBac and Tol2 Transposons

Affiliations

Enhancer Trapping and Annotation in Zebrafish Mediated with Sleeping Beauty, piggyBac and Tol2 Transposons

Dan Shen et al. Genes (Basel). .

Abstract

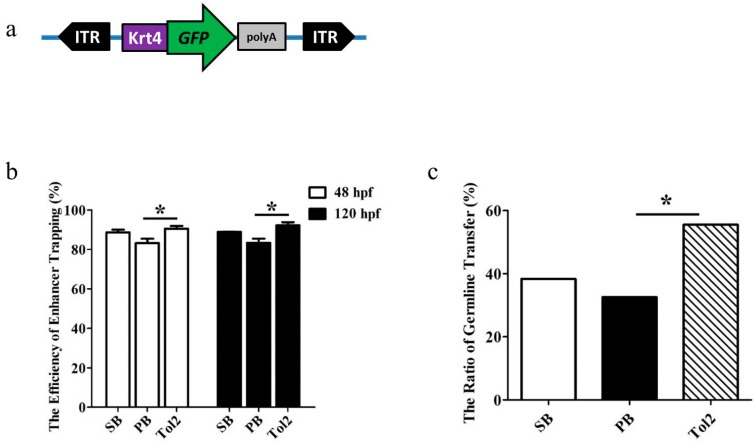
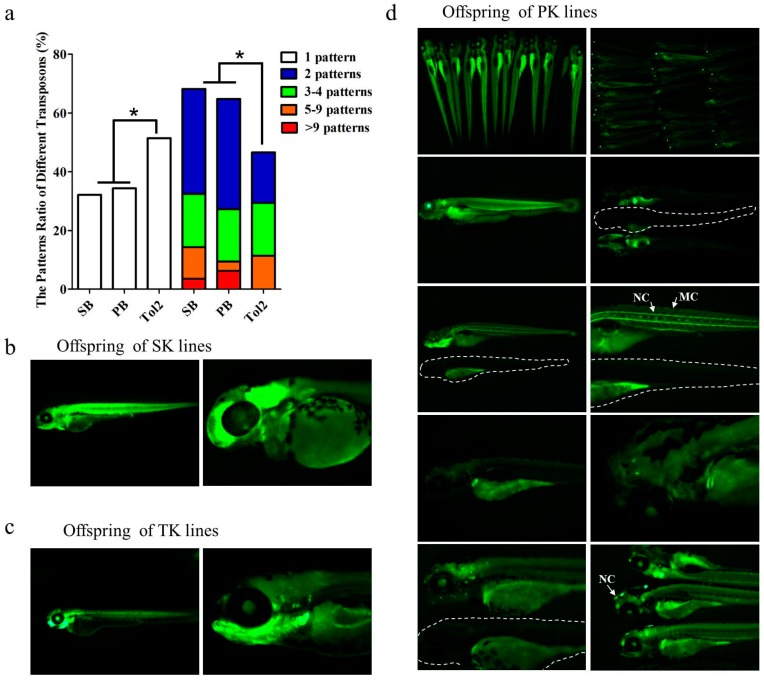
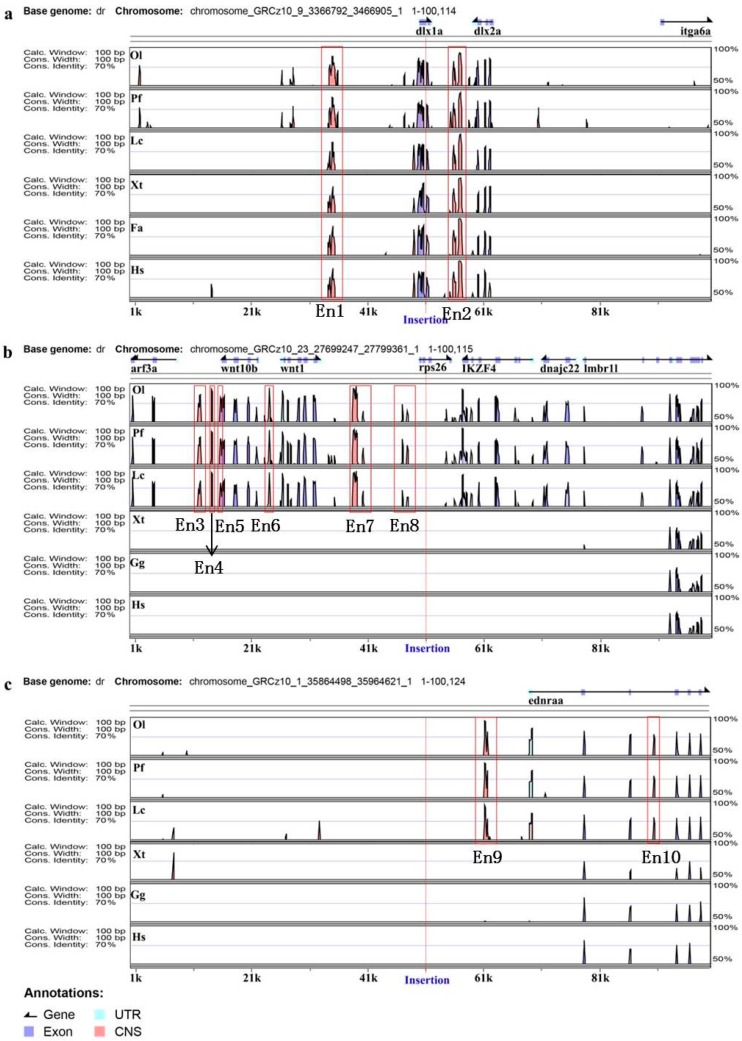
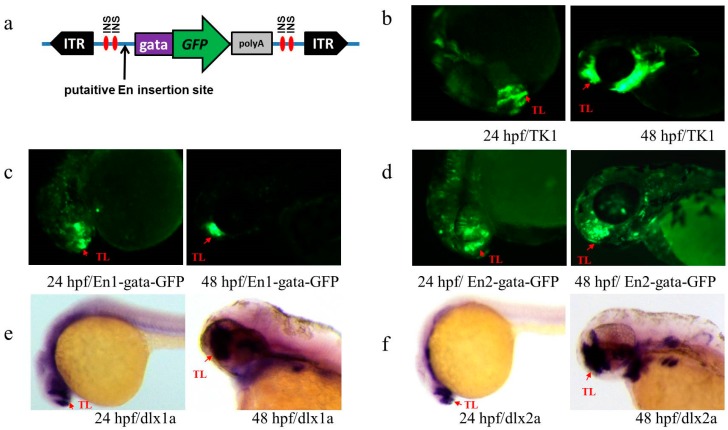
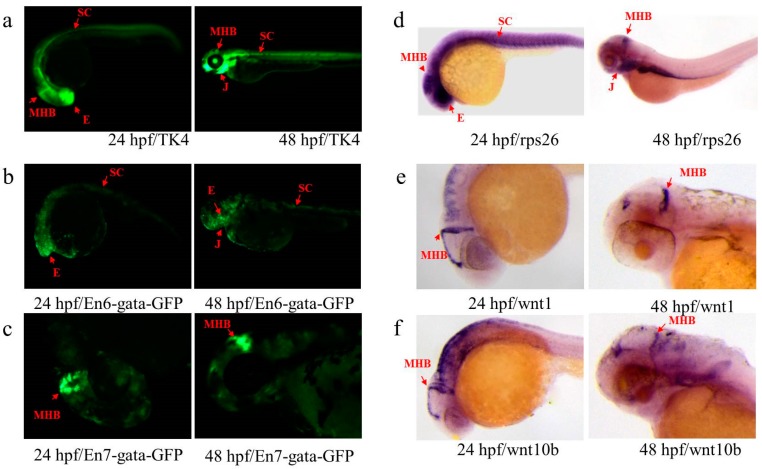
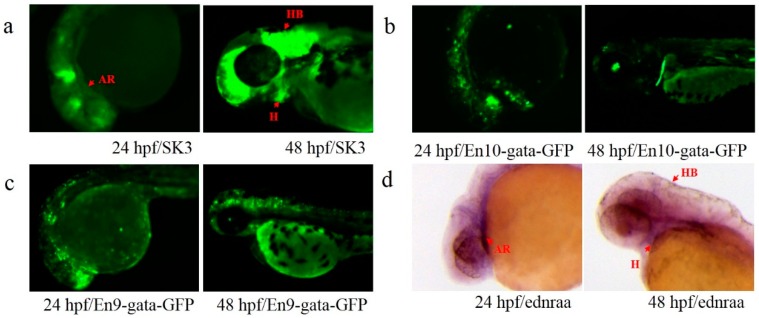
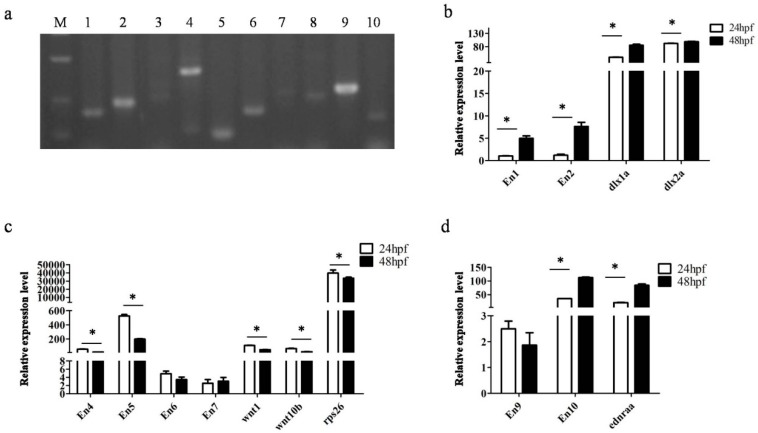
Although transposon-mediated enhancer trapping (ET) is successfully applied in diverse models, the efficiency of various transposon systems varies significantly, and little information is available regarding efficiency of enhancer trapping by various transposons in zebrafish. Most potential enhancers (Ens) still lack evidence of actual En activity. Here, we compared the differences in ET efficiency between sleeping beauty (SB), piggyBac (PB) and Tol2 transposons. Tol2 represented the highest germline transfer efficiencies at 55.56% (NF0 = 165), followed by SB (38.36%, NF0 = 151) and PB (32.65%, NF0 = 149). ET lines generated by the Tol2 transposon tended to produce offspring with a single expression pattern per line, while PB and SB tended to generate embryos with multiple expression patterns. In our tests, 10 putative Ens (En1⁻10) were identified by splinkerette PCR and comparative genomic analysis. Combining the GFP expression profiles and mRNA expression patterns revealed that En1 and En2 may be involved in regulation of the expression of dlx1a and dlx2a, while En6 may be involved in regulation of the expression of line TK4 transgene and rps26, and En7 may be involved in the regulation of the expression of wnt1 and wnt10b. Most identified Ens were found to be transcribed in zebrafish embryos, and their regulatory function may involve eRNAs.

Keywords: Sleeping Beauty; Tol2; enhancer; enhancer trapping; piggyBac; zebrafish.


Conflict of interest statement

All authors declare that they have no conflict of interest.

Figures

Figure 1
Figure 1
Green fluorescent protein (GFP) expression efficiency and germline transfer efficiency of enhancer trapping (ET) based on sleeping beauty (SB), piggyBa (PB) and Tol2 transposons in zebrafish. (a) Schematic of the transposon-based ET cassette (not to scale). The cassette includes two inverted repeat sequences (SB, PB, or Tol2 inverse terminal repeats (ITRs)), and a minimal Krt4 promoter, GFP, and β-globin polyA signal; (b) GFP expression efficiency was measured by GFP screen at 48 and 120 h postfertilization (hpf) after co-injection of a fixed amount of transposon plasmid with the corresponding transposase mRNA into zebrafish embryos. The total number of injected embryos was 1378 in SB, 1276 in PB, 1524 in Tol2. Error bars represent SD; (c) germline efficiency was measured by crossing the GFP-positive founders with wild-type (WT) fish. Significant difference was detected using a χ-squared test; asterisk indicates p < 0.05.
Figure 2
Figure 2
ET pattern difference based on SB, PB and Tol2 transposons in zebrafish. (a) Pattern difference was measured by counting the different patterns of offspring at five days postfertilization (dpf) from each single founder. Significant difference was detected using a χ-squared test; asterisk indicates p < 0.05; (bd) Offspring patterns of lines generated by SK (ET lines generated by the SB transposon), TK (ET lines generated by the Tol2 transposon), and PK (ET lines generated by the PB transposon). In various expression patterns, specific expression in tissues such as eyes, kidney tubes, muscles, and swim bladders could be detected, as well as specific expression patterns in various cells such as nerve cells (NC) and muscle cells (MC). White dotted lines in (d) indicate the WT fish.
Figure 3
Figure 3
Enhancer annotation of three ET lines. Distribution in the region between 50 kb upstream and 50 kb downstream of insertion. Genomic sequences from Danio rerio (Dr), Oryzias latipes (Ol), Poecilia formosa (Pf), Xenopus tropicalis (Xt), Ficedula albicollis (Fa), Gallus gallus (Gg) and Homo sapiens (Hs) were analyzed in the VISTA browser (https://enhancer.lbl.gov/), and 10 enhancers (Ens) were predicted in zebrafish genome as indicated (red frame); the location of each insertion site is marked with a red line. (ac) represent zebrafish lines TK1, TK4 and SK3, respectively.
Figure 4
Figure 4
(a) Transposon-mediated En test vector cassette. The cassette contains an En test box flanked by two ITRs, the ITR represents Tol2 inverted repeat sequences, and the En test box contains a minimal gata promoter, GFP, and β-globin polyA signal flanked with two insulators. INS represents a single insulator; (bf) Expression patterns of Ens and endogenous dlx1a and dlx2a in TK1; (b) GFP expression of line TK1 at 24 and 48 hpf; (c,d) GFP expression of the embryos injected with plasmids carrying En1 and En2 at 24 and 48 hpf, respectively; (e,f) expression of dlx1a and dlx2a at 24 and 48 hpf, respectively. Red arrows indicate similar patterns in telencephalon (TL).
Figure 5
Figure 5
Expression patterns of En and endogenous rps26, wnt1 and wnt10b in TK4. (a) GFP expression of line TK4 at 24 and 48 hpf; (b,c) GFP expression of the embryos injected with plasmids carrying En6 and En7 at 24 and 48 hpf, respectively; (df) gene expression of rps26, wnt1 and wnt10b at 24 and 48 hpf, respectively. Red arrows indicate similar patterns in eye (E), midbrain and hindbrain boundary (MHB), spinal cord (SC) and jaw (J).
Figure 6
Figure 6
Expression patterns of En and endogenous ednraa in SK3. (a) GFP expression of line SK3 at 24 and 48 hpf; (b,c) GFP expression of the embryos injected with plasmids carrying En10 and En9 at 24 and 48 hpf; (d) gene expression of ednraa at 24 and 48 hpf. Red arrows indicate the similar patterns in arches (AR), hindbrain (HB) and heart (H).
Figure 7
Figure 7
Expression of Ens. (a) En expression confirmed by RT-PCR, numbers 1–10 represented En1-10; M: DL500 DNA marker; (bd) relative quantification of expressions of En and endogenous genes by qPCR at 24 and 48 hpf; error bars represent SD.

References

    1. Banerji J., Rusconi S., Schaffner W. Expression of a β-globin gene is enhanced by remote SV40 DNA sequences. Cell. 1981;27:299–308. doi: 10.1016/0092-8674(81)90413-X. - DOI - PubMed
    1. Furlong E.E.M., Levine M. Developmental enhancers and chromosome topology. Science. 2018;361:1341–1345. doi: 10.1126/science.aau0320. - DOI - PMC - PubMed
    1. Li W., Notani D., Rosenfeld M.G. Enhancers as non-coding RNA transcription units: Recent insights and future perspectives. Nat. Rev. Genet. 2016;17:207–223. doi: 10.1038/nrg.2016.4. - DOI - PubMed
    1. Soldner F., Stelzer Y., Shivalila C.S., Abraham B.J., Latourelle J.C., Barrasa M.I., Goldmann J., Myers R.H., Young R.A., Jaenisch R. Parkinson-associated risk variant in distal enhancer of α-synuclein modulates target gene expression. Nature. 2016;533:95. doi: 10.1038/nature17939. - DOI - PMC - PubMed
    1. Weedon M.N., Cebola I., Patch A.M., Flanagan S.E., De F.E., Caswell R., Rodríguezseguí S.A., Shawsmith C., Cho C.H., Lango A.H. Recessive mutations in a distal PTF1A enhancer cause isolated pancreatic agenesis. Nat. Genet. 2014;46:61. doi: 10.1038/ng.2826. - DOI - PMC - PubMed