. 2018 Dec 18;49(6):1090-1102.e7.
doi: 10.1016/j.immuni.2018.10.009. Epub 2018 Dec 11.

Salmonella Persist in Activated Macrophages in T Cell-Sparse Granulomas but Are Contained by Surrounding CXCR3 Ligand-Positioned Th1 Cells

Affiliations

Salmonella Persist in Activated Macrophages in T Cell-Sparse Granulomas but Are Contained by Surrounding CXCR3 Ligand-Positioned Th1 Cells

Michael F Goldberg et al. Immunity. .

Abstract

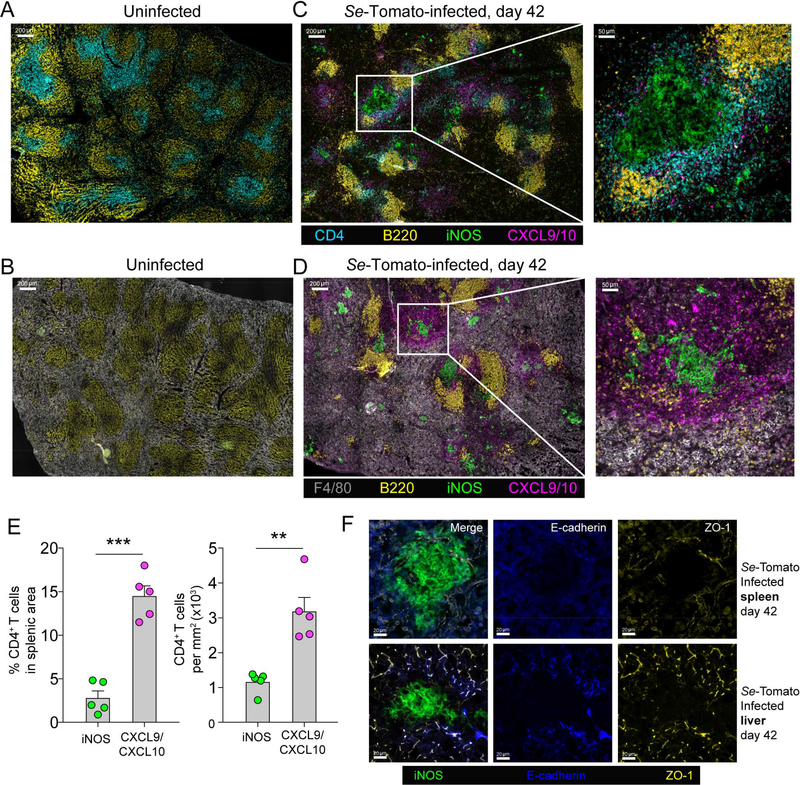
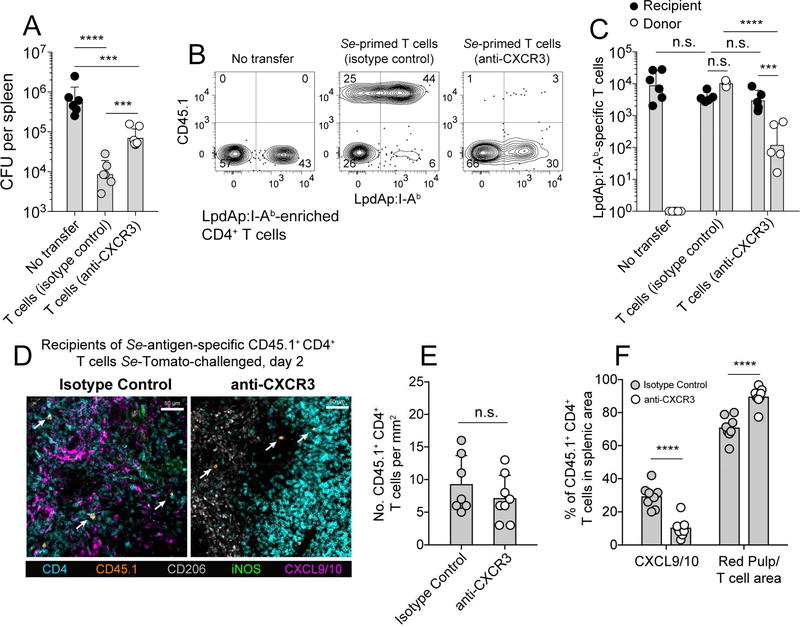
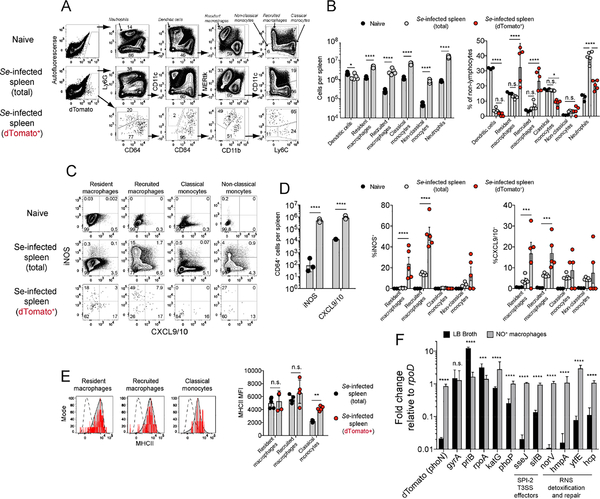
Salmonella enterica (Se) bacteria cause persistent intracellular infections while stimulating a robust interferon-γ-producing CD4+ T (Th1) cell response. We addressed this paradox of concomitant infection and immunity by tracking fluorescent Se organisms in mice. Se bacteria persisted in nitric oxide synthase (iNOS)-producing resident and recruited macrophages while inducing genes related to protection from nitric oxide. Se-infected cells occupied iNOS+ splenic granulomas that excluded T cells but were surrounded by mononuclear phagocytes producing the chemokines CXCL9 and CXCL10, and Se epitope-specific Th1 cells expressing CXCR3, the receptor for these chemokines. Blockade of CXCR3 inhibited Th1 occupancy of CXCL9/10-dense regions, reduced activation of the Th1 cells, and led to increased Se growth. Thus, intracellular Se bacteria survive in their hosts by counteracting toxic products of the innate immune response and by residing in T cell-sparse granulomas, away from abundant Th1 cells positioned via CXCR3 in a bordering region that act to limit infection.

Keywords: CXCR3; Th1; granuloma; phagosomal pathogen.


Figures

Figure 1.
Figure 1.. CD4+ T cells control persistent Se-Tomato infection.
(A) Survival of wild-type (n =13), TCRα-deficient (n = 12), or MHCII-deficient, CD4+ T cell-deficient (n = 11) 129 mice infected intragastrically with 108 Se-Tomato bacteria. Survival curves were compared using the Log rank (Mantel-Cox) test to determine significance. (B) Mean CFU (± geometric S.D.) in the spleens of wild-type (n = 7), TCRα-deficient (n = 9), or MHCII-deficient, CD4+ T cell-deficient mice (n = 8), 30 days after intragastric infection with 108 Se-Tomato bacteria. CFU values were log-transformed and columns were compared using one-way ANOVA, with Tukey’s multiple comparisons post-test (*** p ≤ 0.0002) and derived of two independent experiments. (C)Spleen CFU (± geometric S.D.) from 129 mice infected intragastrically with 108 SeTomato bacteria, rested for 60 days, injected intraperitoneally with 0.8 mg of CD4 (n = 15), CD8 (n = 4), IFN-γ (n = 9), or isotype control (n = 25) antibodies twice 3 days apart, before CFU measurement seven days later. Spleen CFU values were log-transformed and analyzed using one-way ANOVA, with Tukey’s multiple comparisons post-test (*** p < 0.001, **** p < 0.0001, n.s. = not significant) to evaluate the significance between groups.
Figure 2.
Figure 2.. Expansion and differentiation of Se epitope-specific Th1 cells in Seinfected mice.
(A)Plots of LpdAp:I-Ab-specific CD4+ T cells from uninfected (left) or Se-infected (right) mice 60 days after infection identified by tetramer-based cell enrichment and flow cytometry. (B)Mean numbers (± S.D.) of LpdAp:I-Ab tetramer+ CD4+ T cells in the indicated organs of 129 mice at the indicated times after Se infection. (C)Representative histograms showing intracellular T-bet staining of CD44low naïve CD4+ T cells and CD44high LpdAp:I-Ab tetramer+ CD4+ T cells from the same Se-infected mouse. (D)Representative contour plots of LpdAp:I-Ab tetramer+ CD4+ T cells from day 60 Se-Tomato infected 129 mice. (E)Mean numbers (± S.E.M., n ≥ 3 mice per group/timepoint) of LpdAp:I-Ab tetramer+ CXCR3+ or CX3CR1+ CD4+ T cells in the spleens of 129 mice at the indicated times after Se infection. Significance was determined on log-transformed values using twoway ANOVA with Sidak’s multiple comparisons post-test (** p < 0.01, *** p < 0.001, **** p < 0.0001). (F)Mean CFU (± geometric S.D.) per spleen from 129 mice that received total (n = 4), CXCR3+ (n = 5), CX3CR1+ (n = 4), or no CD4+ memory T cells (n = 5) from day 60 Se-infected 129 mice, seven days after intravenous infection with 104 Se-Tomato bacteria. Log-transformed values were compared using one-way ANOVA with Tukey’s multiple comparisons post-test (* p < 0.05, *** p < 0.001, **** p < 0.0001, n.s. = not significant) and is derived from three independent experiments.
Figure 3.
Figure 3.. Se infection stimulates the development of iNOS+ granulomas bordered by CXCL9/10+ mononuclear phagocytes and CD4+ T cells.
(A, B) Spleen sections from an uninfected 129 mouse stained with the indicated antibodies, imaged at 200x magnification, and tiled to cover the entire section. (C, D) Spleen sections from a day 42 Se-Tomato-infected 129 mouse stained with the indicated antibodies, imaged at 200x magnification, and tiled to cover the entire section. Parts of the images in C and D in white boxes are shown enlarged. (E) Mean percentages (± S.E.M.) of total CD4+ T cells in CXCL9/10+ or iNOS+ areas of the spleen images represented in (C), and mean density (± S.E.M.) of CD4+ T cells (per mm2) calculated from dividing the number of CD4+ T cells within each area by the total area of each region. The positions of CD4+ T cells were determined by histo-cytometry and CXCL9/10+ or iNOS+ clusters by a DBSCAN-based algorithm. Images from five individual mice were analyzed. The paired student’s T-test was used to compare the percentage (left) and density (right) of CD4+ T cells within different anatomical locations (** p = 0.007, *** p = 0.0005). (F) Images of spleen (top row) or liver sections (bottom row) from day 42 Se-Tomato infected mice (left column) stained with the indicated antibodies.
Figure 4.
Figure 4.. Detection and localization of Se epitope-specific T cells using an adoptive transfer system
(A) CD4+ memory T cells (2.5 × 10⁶) from CD45.1+ B6 × 129 F1 mice infected intravenously with 108 Listeria monocytogenes-ΔactA (Lm) or intragastrically with 108 Se bacteria 30 days earlier were transferred into CD45.2+ B6 × 129 F1 recipients. Five mice received Lm-primed memory cells, five received Se-primed memory cells, and nine did not receive any cells. All recipients were challenged intravenously with 104 Se-Tomato bacteria. Mean splenic CFU (± geometric S.D.) were measured seven days later and analyzed by one-way ANOVA, with Tukey’s multiple comparisons post-test (**** p < 0.0001). The results are derived from two independent experiments. (B)Representative flow cytometry plots of splenic T cells from mice that received Lm-primed (middle), Se-primed (right), or no (left) CD45.1+ CD4+ memory T cells and were challenged with Se-Tomato bacteria seven days earlier. Mean fold expansion (± S.D.) of transferred cells over controls that received T cells but were not infected is shown in the bar graph. Unpaired student’s T-test was used to compare the responses of the two memory T cell populations (**** p < 0.0001). (C) Spleen sections from a B6 × 129 F1 (CD45.2+) mouse that received CD45.1+ memory CD4+ T cells from CD45.1+ Se-infected donors and was challenged intravenously with Se-Tomato bacteria seven days earlier. Sections were stained with the indicated antibodies. Part of the image in the white box is shown enlarged. Scale bars are included on each panel. (D)Quantitative analysis as described in the legend to Figure 3E but applied to images of transferred CD45.1+ CD4+ T cells from eight different recipient mice. (*** p≤ 0.0004).
Figure 5.
Figure 5.. CXCR3 blockade of Se-specific memory/effector Th1 cells leads to a loss of protection.
(A) Mean CFU (± geometric S.D.) per spleen from 129 mice that received no CD4+ memory T cells or CD45.1+ CD4+ memory/effector T cells from day 60 Se-infected 129 mice and were treated with CXCR3 antibody (n = 6) or normal hamster IgG (n = 6) for seven days after intravenous infection with 104 Se-Tomato bacteria. Log-transformed values were compared using one-way ANOVA with Tukey’s multiple comparisons posttest (*** p ≤ 0.0002, **** p < 0.0001, n.s. = not significant) and are derived from three independent experiments. (B) Representative contour plots from LpdAp:I-Ab tetramer-enriched samples from the spleens of mice from the groups shown in (A). LpdAp:I-Ab tetramer-binding cells of recipient origin are shown in the lower right quadrants and of donor origin in the upper right quadrants. (C)Numbers (± geometric S.D.) of recipient- or donor-derived LpdAp:I-Ab tetramer-binding cells in mice that did not receive donor T cells (left), or received T cells from Se-infected mice and were treated with the indicated antibodies. Significance was determined on log-transformed values using two-way ANOVA with Sidak’s multiple comparisons post-test (*** p = 0.0002, **** p < 0.0001, n.s. = not significant). (D)Spleen sections from B6 × 129 F1 (CD45.2+) mice that received memory/effector CD4+ T cells from CD45.1+Se-infected donors, then isotype control (left) or CXCR3 (right) antibody and intravenous infection with Se-Tomato bacteria before analysis two days later. Sections were stained with the indicated antibodies. White arrows indicate donor-derived T cells. (E) Density of CD45.1+ CD4+ T cells in spleen sections from individual mice of the type shown in (D) determined by manual counting. (F)Mean percentages (± S.E.M.) of CD45.1+ CD4+ T cells (identified by histo-cytometry) in CXCL9/10+ areas (identified by a DBSCAN-based algorithm) or other areas of the spleens of individual mice in the indicated groups. (**** p < 0.0001).
Figure 6.
Figure 6.. Se bacteria are concentrated in iNOS+ granulomas.
(A) Spleen sections from day 42 Se-Tomato infected mice stained with the indicated antibodies and shown at high magnification. Se-Tomato bacteria are indicated by white arrows. (B-G) Spleen sections from day 42 Se-infected 129 (B, C) or MHC-deficient, CD4+ T cell-deficient mice (F, G) stained with the indicated antibodies. Se-Tomato bacteria were digitally enlarged using Imaris software to mark their positions in B and F. (C, G) Positional data (centroid) were extracted from the images in B and F and used to construct digital surfaces for each stained cell. Clusters of iNOS+ or CXCL9/10+ cells were generated from these surfaces using a DBSCAN clustering algorithm, and the positions of Se-Tomato bacteria were marked with crosses. (D) The data from rendered surfaces such as those shown in C and G (wild type, n = 6, MHC-deficient, CD4+ T cell-deficient n = 8) were used to calculate the mean percentages (± S.E.M.) of Se-Tomato bacteria in iNOS+ or CXCL9/10 clusters, or other areas of the red pulp. Differences between wild type and CD4+ T cell-deficient mice were tested using two-way ANOVA with Sidak’s multiple comparisons test. (n.s. = not significant). (E) Pie charts displaying the proportion of red pulp containing iNOS+ or CXCL9/10+ regions or the frequency of Se-Tomato bacteria found within each region.
Figure 7.
Figure 7.. Identification of iNOS+, CXCL9/10+, and Se-infected host cells.
(A) Representative flow cytometry plots of non-lymphocyte-enriched spleen cells from the indicated sources following exclusion of lymphocytes, NK cells, and dead cells. Plots of Se-dTomato+ cells were concatenated from the spleens of five day 42 Se-infected 129 mice (bottom row). (B)Mean number (± geometric S.D.) (left) and mean percentage (± S.E.M.) (right) of the indicated myeloid populations in the spleens of uninfected (n = 3) or day 42 Se-Tomato infected (n = 5) mice. Significance was determined on log-transformed (left) or untransformed (right) values using two-way ANOVA with Sidak’s multiple comparisons post-test (* p ≤ 0.04, **** p < 0.0001, n.s. = not significant). (C)Representative flow cytometry plots showing expression of iNOS and CXCL9/10 by the mononuclear phagocyte populations identified in (A) from the spleens of uninfected or day 42 Se-Tomato-infected mice, or dTomato+ cells from infected mice. (D) Left panel - numbers (± geometric S.D.) of total iNOS+ or CXCL9+ cells from uninfected (n = 3) or day 42 Se-Tomato-infected mice (n = 5), compared with two-way ANOVA and Sidak’s multiple comparisons test (**** p < 0.0001). Middle and right panels - population comparison from the flow cytometry experiment shown in (C). Mean percentages (± S.E.M.) of mononuclear phagocyte populations expressing iNOS (middle) or CXCL9/10 (right) from uninfected (n = 3), total day 42 Se-Tomato-infected (n = 5) or dTomato+ (n = 5) cells from day 42 Se-Tomato-infected 129 mice. Percentages were analyzed using two-way ANOVA and Sidak’s multiple comparisons test (*** p ≤ 0.0004 **** p < 0.0001). (E)Representative flow cytometry histograms of MHCII levels on the indicated mononuclear phagocytes from day 42 Se-Tomato infected 129 mice (gray), neutrophils as negative controls (dashed), or dTomato+ infected cells (red). The bar graph shows geometric mean MHCII mean fluorescence intensity (MFI) (± S.E.M.) levels on total (n = 3) or dTomato+ infected cells (n = 5) from day 42 Se-Tomato infected 129 mice. MFI values were compared using two-way ANOVA and Sidak’s multiple comparisons test (** p = 0.0088, n.s. = not significant). (F) Fold change expression of Se mRNA relative to the housekeeping gene rpoD, between bacteria grown to late-log phase in LB broth (n=6, black bars) and Se bacteria from NO+ macrophages (n=7, gray bars). Data are from two independent experiments, and conditions were compared using two-way ANOVA and Sidak’s multiple comparisons test (*** p = 0.0004, **** p < 0.0001, n.s. = not significant). SPI-2 T3SS = Salmonella pathogenicity island 2 type 3 secretion system; RNS = reactive nitrogen species.

Similar articles

Cited by

References

    1. Barat S, Willer Y, Rizos K, Claudi B, Maze A, Schemmer AK, Kirchhoff D, Schmidt A, Burton N, and Bumann D (2012). Immunity to intracellular Salmonella depends on surface-associated antigens. PLoS Pathog. 8, e1002966. - PMC - PubMed
    1. Bayer-Santos E, Durkin CH, Rigano LA, Kupz A, Alix E, Cerny O, Jennings E, Liu M, Ryan AS, Lapaque N, et al. (2016). The Salmonella effector SteD mediates MARCH8-dependent ubiquitination of MHC II molecules and inhibits T cell activation. Cell Host Microbe 20, 584–595. - PMC - PubMed
    1. Behnsen J, Perez-Lopez A, Nuccio SP, and Raffatellu M (2015). Exploiting host immunity: the Salmonella paradigm. Trends Immunol. 36, 112–120. - PMC - PubMed
    1. Belkaid Y, Piccirillo CA, Mendez S, Shevach EM, and Sacks DL (2002). CD4+CD25+ regulatory T cells control Leishmania major persistence and immunity. Nature 420, 502–507. - PubMed
    1. Blank K, Hensel M, and Gerlach RG (2011). Rapid and highly efficient method for scarless mutagenesis within the Salmonella enterica chromosome. PLoS One 6, e15763. - PMC - PubMed

Publication types

MeSH terms