. 2018 Dec 18;49(6):1132-1147.e7.
doi: 10.1016/j.immuni.2018.09.013. Epub 2018 Dec 11.

Simultaneous Loss of Both Atypical Protein Kinase C Genes in the Intestinal Epithelium Drives Serrated Intestinal Cancer by Impairing Immunosurveillance

Affiliations

Simultaneous Loss of Both Atypical Protein Kinase C Genes in the Intestinal Epithelium Drives Serrated Intestinal Cancer by Impairing Immunosurveillance

Yuki Nakanishi et al. Immunity. .

Abstract

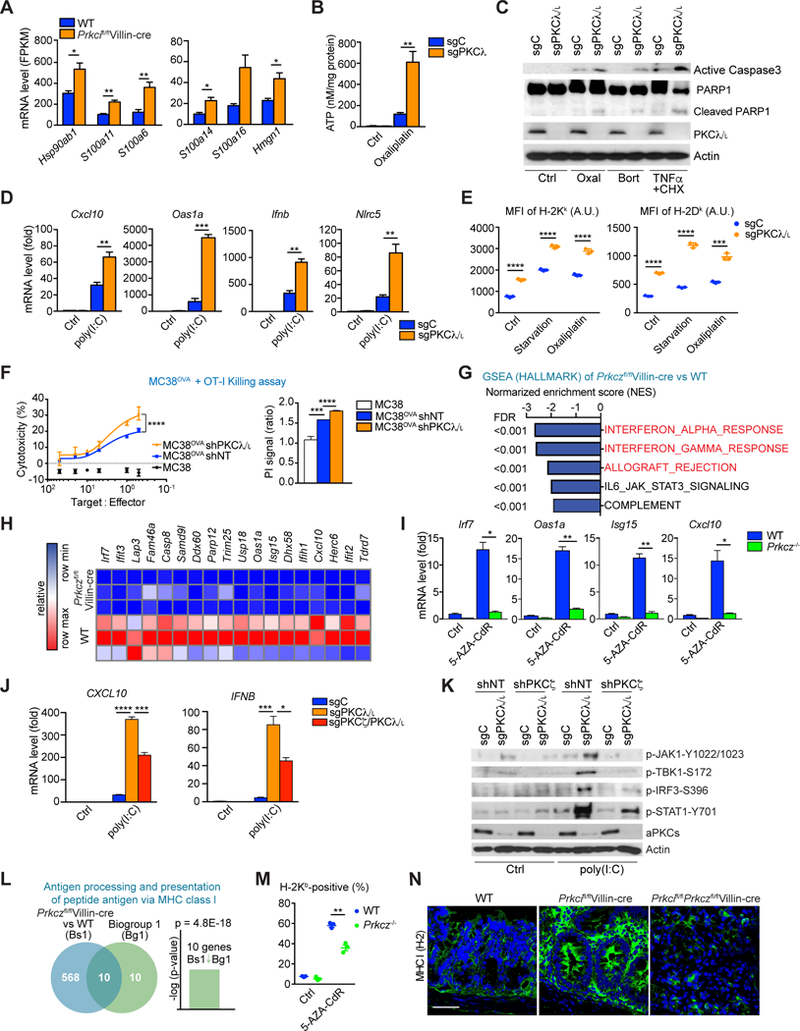
Serrated adenocarcinoma, an alternative pathway for colorectal cancer (CRC) development, accounts for 15%-30% of all CRCs and is aggressive and treatment resistant. We show that the expression of atypical protein kinase C ζ (PKCζ) and PKCλ/ι was reduced in human serrated tumors. Simultaneous inactivation of the encoding genes in the mouse intestinal epithelium resulted in spontaneous serrated tumorigenesis that progressed to advanced cancer with a strongly reactive and immunosuppressive stroma. Whereas epithelial PKCλ/ι deficiency led to immunogenic cell death and the infiltration of CD8+ T cells, which repressed tumor initiation, PKCζ loss impaired interferon and CD8+ T cell responses, which resulted in tumorigenesis. Combined treatment with a TGF-β receptor inhibitor plus anti-PD-L1 checkpoint blockade showed synergistic curative activity. Analysis of human samples supported the relevance of these kinases in the immunosurveillance defects of human serrated CRC. These findings provide insight into avenues for the detection and treatment of this poor-prognosis subtype of CRC.

Keywords: PKCζ; PKCλ/ι; TGF-β; atypical PKCs; colorectal cancer; immunosuppression; immunosurveillance; interferon; intestinal inflammation; serrated adenocarcinoma.


Conflict of interest statement

DECLARATION OF INTERESTS

The authors declare no competing interests.

Figures

Figure 1.
Figure 1.. Simultaneous inactivation of PKCλ/ι and PKCζ drives serrated tumorigenesis in small intestine and colon
(A) Gross images of wild-type (WT) and Prkcifl/flPrkczfl/flVillin-cre mice. Red arrows denote dilated intestine. (B) Body weight of WT (n = 15) and Prkcifl/flPrkczfl/flVillin-cre mice (n = 23). (C) Kaplan-Meier survival curve of WT (n = 20) and Prkcifl/flPrkczfl/flVillin-cre (n = 22) mice. (D) Hematoxylin and eosin (H&E) staining of small intestine and colon sections from WT and Prkcifl/flPrkczfl/flVillin-cre mice (n = 20). Scale bars, 100 μm. (E) Macroscopic images of small intestines from WT and Prkcifl/flPrkczfl/flVillin-cre mice. Red arrows denote tumors. Scale bar, 2 mm. (F and G) Number of macroscopic tumors at different ages (F) and tumor size distribution (G) in small intestine (SI) and colon of Prkcifl/flPrkczfl/flVillin-cre mice. Each circle represents one mouse (n = 39). (H) Gross images of colons from Prkcifl/flPrkczfl/flVillin-cre mice. Arrows denote tumors in ascending colons. Red dotted circle denotes mucin in tumor. Scale bars, 2 mm. (I–L) Images of tubular adenocarcinoma (I), poorly differentiated adenocarcinoma (J), signet-ring cell carcinoma (K: H&E, top; Alcian blue and Ki67 double staining, bottom), and desmoplastic change (L) observed in Prkcifl/flPrkczfl/flVillin-cre intestines. Red arrows denote invasive tumor front. Scale bars, 100 μm. Data are representative of or combined from ten independent experiments including male and female mice. Results are shown as mean ± SEM. ***p < 0.001, ****p < 0.0001. See also Figure S1.
Figure 2.
Figure 2.. Prkcifl/flPrkczfl/flVillin-cre tumors carry a distinct molecular signature which resembles human serrated tumors
(A and B) β-catenin staining and quantification in the indicated types of intestinal tumors from Prkcifl/flPrkczfl/flVillin-cre or Apcfl/+; Prkcifl/flVillin-cre male mice (n = 3). Scale bar, 50 μm. (C) GSEA plots of enrichment of the indicated gene signatures in Prkcifl/flPrkczfl/flVillin-cre tumor vs. wild-type (WT) intestine from male mice (n = 3), NES, normalized enrichment score; FDR, false discovery rate. (D) Phospho-ERK, phospho-EGFR, and YAP staining in small intestines from male and female mice of the indicated genotype (n = 3). Scale bars, 25 μm. (E) GSEA plot of Prkcifl/flPrkczfl/flVillin-cre tumor vs. WT intestine from male mice (n = 3). (F) GSEA of transcriptomic data from RNA-seq on Prkcifl/flPrkczfl/flVillin-cre tumors vs. WT intestine from male mice (n = 3). (G) GSEA of enrichment of the Prkcifl/flPrkczfl/flVillin-cre mouse gene set in human serrated datasets. Data are representative of three independent experiments (A, B, D) or of one experiment of three individual mice (C, E-G). Results are shown as mean ± SEM. ****p < 0.0001. See also Figure S2.
Figure 3.
Figure 3.. Prkcifl/flPrkczfl/flVillin-cre tumors display an immunosuppressive phenotype
(A–C) Staining for CD45 (A), CD8 (B), and CD45 and PD-L1 (C) in small intestines from mice of the indicated genotypes and lesions, and quantification (n = 3). Red lines mark the tumor (T) border. (D–J) Flow cytometry analyses of immune cell populations from mice of the indicated genotypes. Percentage of CD8+ T cells (D), PD-L1+ (E), Treg cells (Foxp3+CD4+TCR-β+; F) in CD45+ cells; ratio of Treg cells to CD8+ T cells (G); percentage of IL-17A–producing cells in CD4+ T cells (H); percentage of CD11b+ (I) and CD11b+Ly6ChighLy6G and CD11b+Ly6C+Ly6G+ (J) cells in CD45+ cells. (n: WT = 7, Prkcifl/flVillin-cre = 8, and Prkcifl/flPrkczfl/flVillin-cre tumor = 4). (K–M) αSMA (K) and Masson’s trichrome (L) staining, and Ereg in situ hybridization (M) in small intestines from mice of the indicated genotypes and lesions (n = 3). Data are representative of ten independent experiments (A-C, K-M) or combined from six independent experiments (D-J). Male and female mice were used. Results are shown as mean ± SEM. *p < 0.05, **p < 0.01, ***p < 0.001, ****p < 0.0001. Scale bars, 25 μm. See also Figure S3.
Figure 4.
Figure 4.. CD8+ T cells repress serrated tumorigenesis in Prkcifl/flPrkczfl/flVillin-cre mice
(A and B) CD45+ staining (A) and quantification (B) in small intestines from WT and Prkcifl/flPrkczfl/flVillin-cre male mice with or without antibiotic (Abx) treatment (n = 3). (C) Flow cytometry analyses of CD45+ cell populations from WT and Prkcifl/flPrkczfl/flVillin-cre male mice in the Abx experiment (n: WT Ctrl = 8, WT Abx-treated = 5, Prkcifl/flPrkczfl/flVillin-cre Ctrl = 4, and Prkcifl/flPrkczfl/flVillin-cre Abx-treated = 3). (D) Quantification of the total numbers of tumors in small intestine and colon, and stratification of small-intestinal tumor numbers according to size in Prkcifl/flPrkczfl/flVillin-cre male mice in the Abx experiment. (n: Ctrl = 6 and Abx-treated = 7). (E–G) H&E staining (E) and Ki67, phospho-ERK, and YAP staining (F) of small-intestinal tumors from Prkcifl/flPrkczfl/flVillin-cre male mice in the Abx experiment, and quantification of Ki67 staining (G). Scale bars, 100 μm. (H) Flow cytometry analyses of CD8+ T cells from WT and Prkcifl/flVillin-cre male mice treated with or without αCD8 antibody (n: WT = 3, Prkcifl/flVillin-cre = 6, and Prkcifl/flVillin-cre αCD8 antibody–treated = 7). (I) Macroscopic images of Prkcifl/flVillin-cre small intestines treated in the CD8-depletion experiment. Red arrow denotes tumor. Scale bar, 2 mm. (J and K) Quantification of incidence (J) and total number (K) of small-intestinal tumors in the CD8-depletion experiment (n = 7). (L and M) H&E, Ki67, cleaved caspase 3 (C-Caspase3), TUNEL, and Masson’s trichrome staining of small-intestinal samples from mice of the indicated genotypes and treatment (L), and quantification (M) (n = 3–5). Scale bars, 100 μm. Data are representative of or combined from two independent experiments. Results are shown as mean ± SEM. *p < 0.05, **p < 0.01, ***p < 0.001, ****p < 0.0001. See also Figure S4.
Figure 5.
Figure 5.. Suppression of the interferon response by PKCζ loss impairs CD8+-dependent immunosurveillance
(A) mRNA expression for the indicated genes in Prkcifl/flVillin-cre vs. WT IECs from RNA-seq data. (B) Extracellular ATP levels in sgC and sgPKCλ/ι MODE-K cells treated with Oxaliplatin for 24 hr (20 µM). (C) Western Blot of indicated proteins in sgC and sgPKCλ/ι MODE-K cells treated for 24 hr with Oxaliplatin (20 µM), Bortezomib (0.1 µM) or TNFα (10 ng/ml) plus cycloheximide (2.5 µg/ml). (D) qRT-PCR analyses of Cxcl10, Oas1a, Ifnb, and Nlrc5 mRNA levels in MODE-K of the indicated genotypes transfected with 0.5 µg/ml of poly(I:C) or mock transfected for 6 hr. (E) Surface expression (mean fluorescence intensity, MFI) of H-2Kb and H-2Dk in MODE-K cells of the indicated genotypes either HBSS-starved or treated with Oxaliplatin (20 µM) for 24 hr. (F) OT-I cells-MC38OVA killing assay (24 hr) at the indicated T:E ratios (left). PI staining in shNT and sgPKCλ/ι MC38OVA cells after coculture with OT-I cells for 24 hr (right). (G) GSEA of transcriptomic data from RNA-seq on Prkczfl/flVillin-cre vs. WT IECs. The indicated gene signatures were applied to the analyses. FDR, false discovery rate. (H) Heatmap of RNA-seq data of WT and Prkczfl/flVillin-cre IECs representing the genes related to interferon response differentially expressed between genotypes. (I) qRT-PCR analyses of Irf7, Oas1a, Isg15, and Cxcl10 mRNA levels in organoids of the indicated genotypes with or without 5AZA-CdR treatment. (J) qRT-PCR analyses of CXCL10 and IFNB mRNA levels in 293T cells of the indicated genotypes transfected with 0.5 µg/ml of poly(I:C) or mock transfected for 6 hr. (K) Western blot of indicated proteins in 293T cells of the indicated genotypes transfected with 0.5 µg/ml of poly(I:C) or mock transfected for 6 hr. (L) NextBio analysis of genes differentially expressed in Prkczfl/flVillin-cre vs. WT IECs. Venn diagram show the number of common and unique genes in both sets. Gene signatures corresponding to GO terms “antigen processing and presentation of peptide antigen via MHC class l”. (M) Flow cytometry analysis of H-2Kb–positive cell population in organoids of the indicated genotypes with or without 5-AZA-CdR treatment. (N) MHC I (H-2) staining in small intestines from mice of the indicated genotypes. Scale bar, 50 μm. Data represent the mean ± SEM of three individual female mice per group for one experiment (A). Data are combined from three (B, D-F, J, M) or two (I) independent biological replicates or representative of two independent experiments (C, K). Data are representative of one (G, H, L) of three individual male and female mice or of three (N) independent experiments of three individual male mice. Results are shown as mean ± SEM. *p < 0.05, **p < 0.01, ***p < 0.001, ****p < 0.0001. See also Figure S5.
Figure 6.
Figure 6.. Combined TGF-β receptor inhibition with anti-PDL1 blocks tumorigenesis in Prkcifl/flPrkczfl/flVillin-cre mice
(A) Experimental design for galunisertib (Gal) treatment. (B and C) Quantification of the total number, average size, and load of small-intestinal tumors and incidence of cancer and invasive cancer (C) in Prkcifl/flPrkczfl/flVillin-cre mice in the Gal experiment. (n: Ctrl = 8 and Gal-treated = 6). (D) H&E, Masson’s trichrome, phospho-Smad2, and CD45 and PD-L1 double staining in small- intestinal tumors from Prkcifl/flPrkczfl/flVillin-cre mice in the Gal experiment. Scale bars = 100 μm. (E) qRT-PCR analyses of Angptl2, Cdkn2b, Il11, and Ereg mRNA levels in the Gal experiment (n: WT = 3, Prkcifl/flPrkczfl/flVillin-cre Ctrl = 4, and Prkcifl/flPrkczfl/flVillin-cre Gal-treated = 5). (F–J) Flow cytometry analyses of immune cell populations in Prkcifl/flPrkczfl/flVillin-cre tumors in the Gal experiment. Percentage of IL-17A–producing cells in CD4+ T cells (F); percentage of CD8+ T cells (G) and Foxp3+CD4+ Treg cells (H) cells in CD45+ cells; ratio of Treg to CD8+ T cells (I); and percentage of CD11b+, CD11b+Ly6ChighLy6G, and CD11b+Ly6C+Ly6G+ cells in CD45+ cells (J). (n: Ctrl = 4 and Gal-treated = 3 Prkcifl/flPrkczfl/flVillin-cre). (K and L) Quantification (K) and images (L) of CD45;PD-L1 staining in Prkcifl/flPrkczfl/flVillin-cre tumors in Gal experiment. Scale bar, 100 μm. White arrows: CD45+;PD-L1+. (M) Experimental design for a combination therapy with an αPD-L1 antibody and Gal. (N and O) Quantification of the total number, average size, and load of small-intestinal tumors and incidence of cancer and invasive cancer (O) in Prkcifl/flPrkczfl/flVillin-cre mice in the combination therapy experiment (M). (n: Ctrl = 6 and αPD-L1 + Gal–treated = 7 Prkcifl/flPrkczfl/flVillin-cre). (P) H&E and CD8 staining in small-intestinal tumors from Prkcifl/flPrkczfl/flVillin-cre mice in thecombination therapy experiment (M). Dotted red lines outline tumors (T). Scale bars, 100 μm. (Q–S) Flow cytometry analyses of immune cell populations in Prkcifl/flPrkczfl/flVillin-cre tumors in the combination therapy experiment. Percentage of CD8+ T (Q); Foxp3+CD4+ Treg (R); and CD11b+, CD11b+Ly6ChighLy6G, and CD11b+Ly6C+Ly6G+ (S) cells in CD45+ cells. (n: Ctrl = 5 and αPD-L1 + Gal–treated = 4 Prkcifl/flPrkczfl/flVillin-cre). Data represent the mean ± SEM of three to eight individual male mice per group for one experiment per treatment. *p < 0.05, **p < 0.01. See also Figure S6.
Figure 7.
Figure 7.. Human serrated tumors have reduced expression of both atypical PKCs
(A and B) aPKC immunohistochemistry (A) and quantification (B) of human normal colon (n = 20), sessile serrated adenomas/polyps (SSA/Ps; n = 30), and tubular adenomas (TA; n = 30). Scale bars, 50 μm. (C) GSEA plots in CRC patient samples from TCGA stratified based on PRKCI and PRKCZ expression levels. (D) PRKCI and PRKCZ mRNA levels in the AMC-AJCCII-90 set (GSE33113) stratified by the CCS classification. (E) Proportion of CRC patients with the CCS1, CCS2, or CCS3 CRC subtype according to aPKC mRNA expression (GSE33113). (F) Kaplan-Meier overall survival curve of CRC patients (TCGA) stratified based on aPKC expression levels. (G) GSEA of transcriptomic data of CRC samples (TCGA) stratified based on aPKC expression levels. (H) GSEA of transcriptomic data from the indicated datasets of IBD patients. Normalized enrichment scores (NES) are shown. Fold changes (FC) of expression of PRKCI and PRKCZ comparing Crohn’s disease (CD) vs. healthy colon (Ctrl) or ulcerative colitis (UC) vs. Ctrl. FDR < 0.1 was considered significant. NS, not significant. (I and J) aPKC and CD8 staining (I) and quantification (J) in human proximal CRCs (n: High aPKCs = 12, Low aPKCs = 13). Scale bars, 50 μm. Results are shown as mean ± SEM. *p < 0.05, **p < 0.01, ***p < 0.001, ****p < 0.0001. See also Figure S7.

Similar articles

Cited by

References

    1. Beaugerie L, and Itzkowitz SH (2015). Cancers complicating inflammatory bowel disease. N Engl J Med 372, 1441–1452. - PubMed
    1. Bennecke M, Kriegl L, Bajbouj M, Retzlaff K, Robine S, Jung A, Arkan MC, Kirchner T, and Greten FR (2010). Ink4a/Arf and oncogene-induced senescence prevent tumor progression during alternative colorectal tumorigenesis. Cancer Cell 18, 135–146. - PubMed
    1. Calon A, Lonardo E, Berenguer-Llergo A, Espinet E, Hernando-Momblona X, Iglesias M, Sevillano M, Palomo-Ponce S, Tauriello DV, Byrom D, et al. (2015). Stromal gene expression defines poor-prognosis subtypes in colorectal cancer. Nat Genet 47, 320–329. - PubMed
    1. Chiappinelli KB, Strissel PL, Desrichard A, Li H, Henke C, Akman B, Hein A, Rote NS, Cope LM, Snyder A, et al. (2015). Inhibiting DNA Methylation Causes an Interferon Response in Cancer via dsRNA Including Endogenous Retroviruses. Cell 162, 974–986. - PMC - PubMed
    1. de la Chapelle A, and Hampel H (2010). Clinical relevance of microsatellite instability in colorectal cancer. J Clin Oncol 28, 3380–3387. - PMC - PubMed

Publication types

MeSH terms