. 2018 Dec 18;49(6):1148-1161.e7.
doi: 10.1016/j.immuni.2018.09.024. Epub 2018 Dec 11.

Successful Anti-PD-1 Cancer Immunotherapy Requires T Cell-Dendritic Cell Crosstalk Involving the Cytokines IFN-γ and IL-12

Affiliations

Successful Anti-PD-1 Cancer Immunotherapy Requires T Cell-Dendritic Cell Crosstalk Involving the Cytokines IFN-γ and IL-12

Christopher S Garris et al. Immunity. .

Erratum in

Abstract

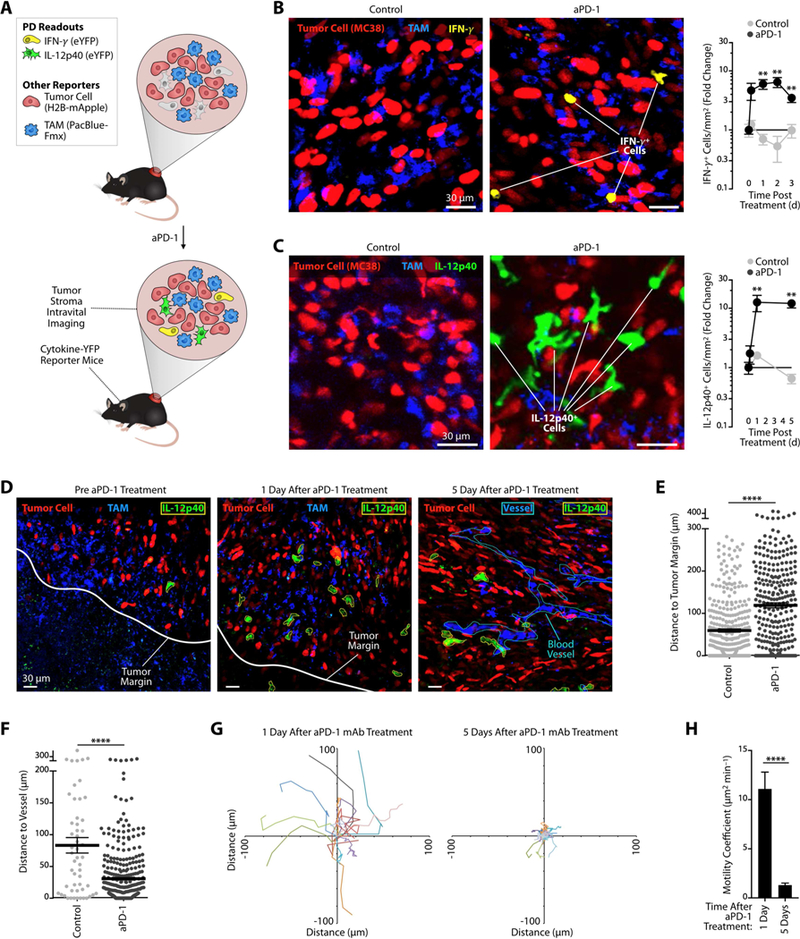
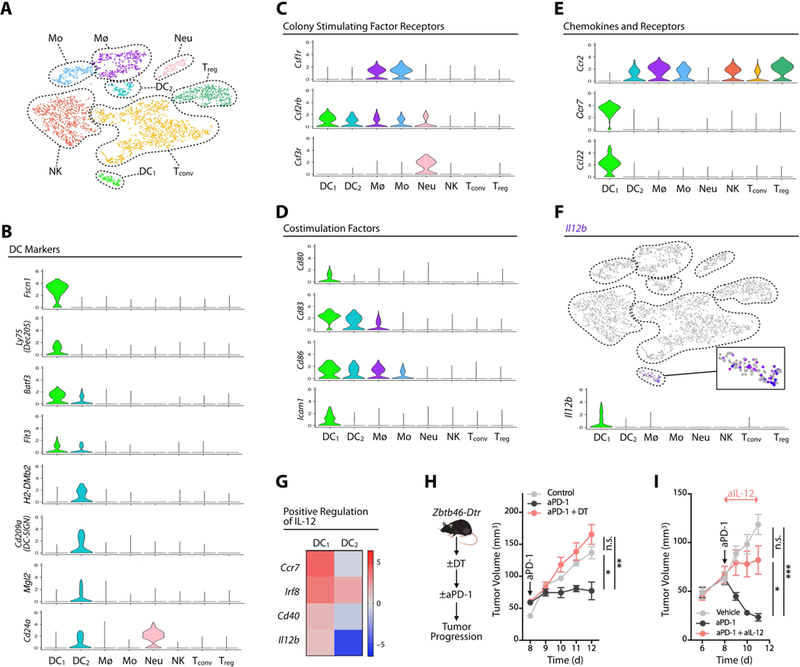
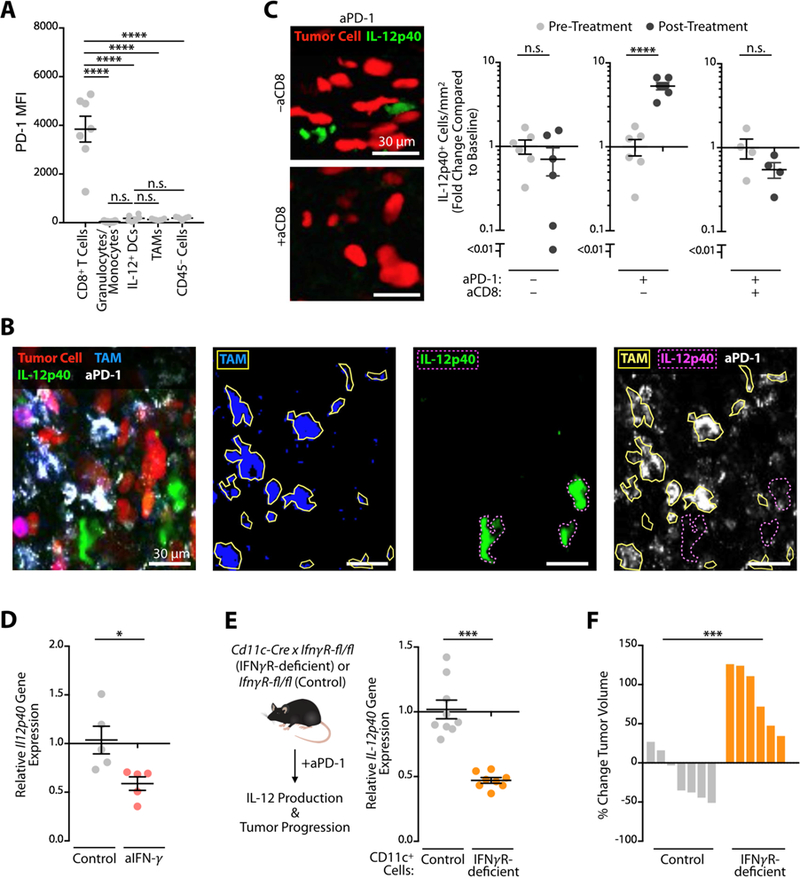
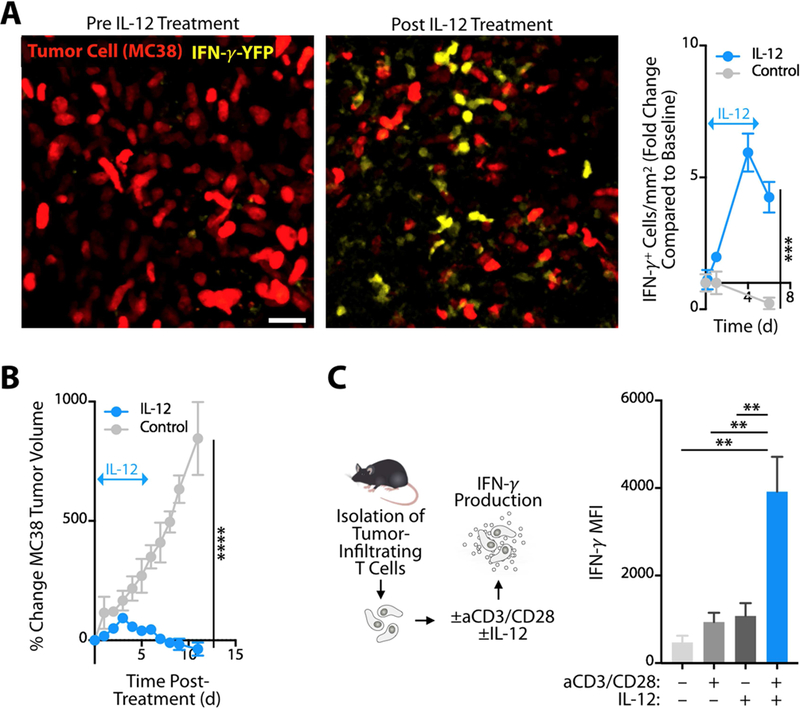
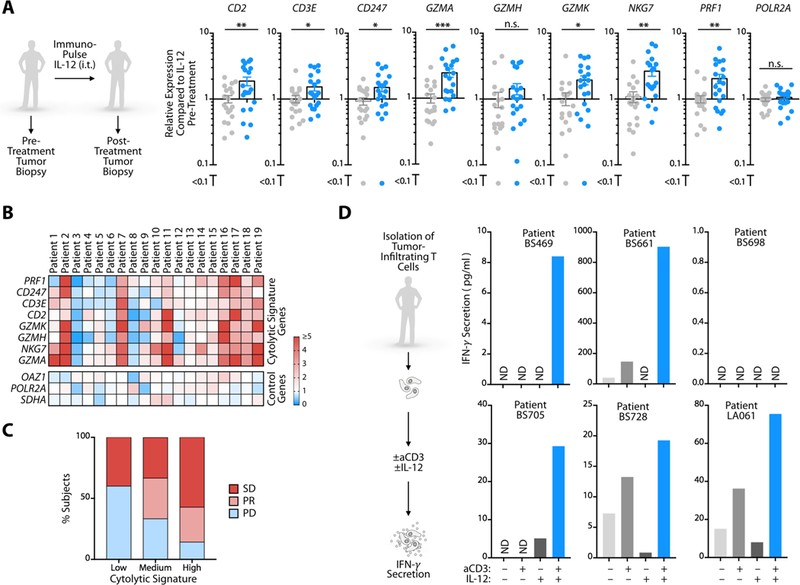
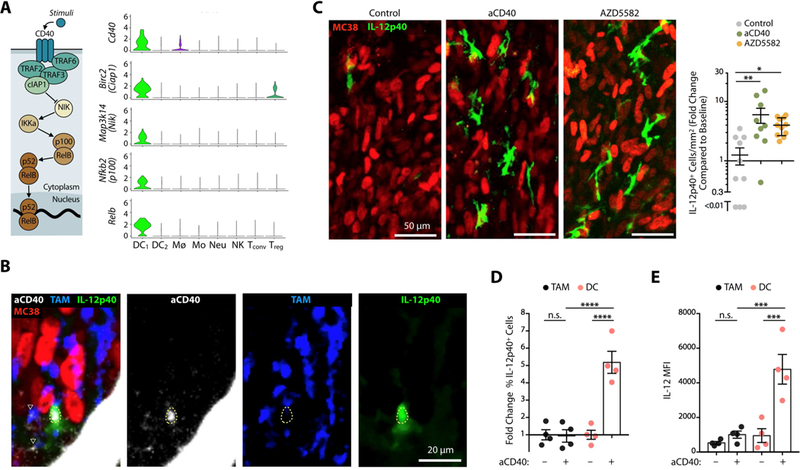
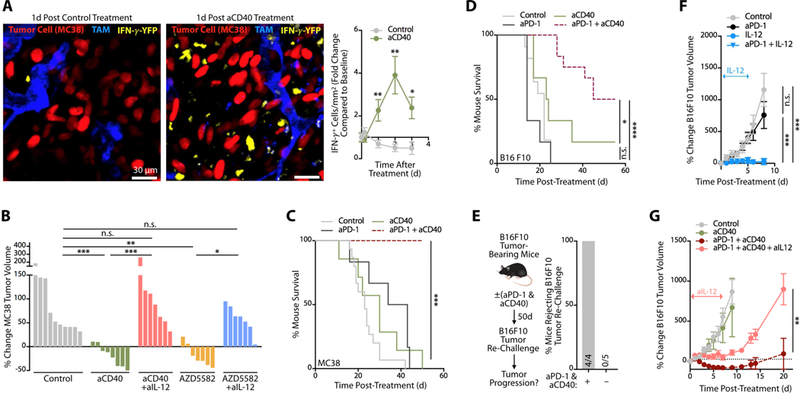
Anti-PD-1 immune checkpoint blockers can induce sustained clinical responses in cancer but how they function in vivo remains incompletely understood. Here, we combined intravital real-time imaging with single-cell RNA sequencing analysis and mouse models to uncover anti-PD-1 pharmacodynamics directly within tumors. We showed that effective antitumor responses required a subset of tumor-infiltrating dendritic cells (DCs), which produced interleukin 12 (IL-12). These DCs did not bind anti-PD-1 but produced IL-12 upon sensing interferon γ (IFN-γ) that was released from neighboring T cells. In turn, DC-derived IL-12 stimulated antitumor T cell immunity. These findings suggest that full-fledged activation of antitumor T cells by anti-PD-1 is not direct, but rather involves T cell:DC crosstalk and is licensed by IFN-γ and IL-12. Furthermore, we found that activating the non-canonical NF-κB transcription factor pathway amplified IL-12-producing DCs and sensitized tumors to anti-PD-1 treatment, suggesting a therapeutic strategy to improve responses to checkpoint blockade.

Keywords: IFN-γ; IL-12; anti-PD-1; cancer; checkpoint; dendritic cell; immunotherapy; non-canonical NF-κB.


Figures

Figure 1.
Figure 1.. Successful aPD-1 treatment triggers endogenous IFN-γ and IL-12 responses within tumors.
(A) Diagram describing intravital imaging of MC38-H2B-mApple tumors implanted in cytokine-reporter mice for tracking lymphoid and my eloidcell pharmacody namics (PD) after aPD-1 treatment. (B) Left: Intravital micrographs of MC38 tumors in IFN-γ -eYFP reporter mice treated or not with aPD-1 mAb (n = 3 mice/group). Yellow, IFN-γ-eYFP expressing cells; red, tumor cells; blue, PacificBlueFMX-labeled tumor-associated macrophages (TAM). Right: Fold change of IFN-γ + cells in both groups at different times after treatment and compared to baseline. (C) Same as in (B) but in IL-12p40-eYFP reporter mice (n = 5 mice/group). Green, IL-12p40-eYFP expressing cells; red, tumor cells; blue, TAM. (D) Representative intravital micrographs of H2B-mApple MC38 tumor edge or core obtained in IL-12p40 reporter mice before (left), one dayafter (middle) and 5 days after (right) aPD-1 treatment. PacBlue-labeled dextran was used to locate tumor vessels. Tumor cells, red; tumor-associated macrophages (TAM), blue; IL-12+ cells, green with yellow contours; tumor margin, white; blood vessels, cyan. Scale bars represent 30 µm. (E) Distance between IL-12p40+ cells and the tumor margin measured by intravital imaging. Each point represents a single cell (n = 8 control and 5 aPD-1- treated mice). (F) Distance between IL-12p40+ cells and closest tumor vessel measured by intravital imaging. Each point represents a single cell (n = 5 mice/group). (G) In vivo time-lapse microscopy of IL-12p40 reporter mice tracking IL-12+ cell motility after aPD-1 treatment. Track plots represent displacement from origin of IL-12+ cells in the tumor microenvironment. (H) Motility coefficient was calculated for each IL-12+ cell at both time points. n.s. = not significant, ** p < 0.01,**** p < 0.0001. Values represent SEM. Data are representative of at least two independent experiments. For comparisons between two groups, Student’s two-tailed t-test was used. See also Figure S1.
Figure 2.
Figure 2.. IL-12 is produced by DC1s and is necessary for treatment efficacy
(A) t-SNE plot using scRNAseq data from CD45+ cells sorted from MC38 tumors 3 days after aPD-1 treatment. Untreated mice served as control. Control and aPD-1 samples are pooled. (B-E) Violin plots showing the gene expression probability distribution of various dendritic cell markers (B), colony stimulating factor receptors (C), costimulation factors (D), and chemokine and chemokine receptors (E), in DC1, DC2 and other immune cell clusters (Mø, macrophages; Mo, monocytes; Neu, neutrophils; NK, natural killer cells; Tconv, conventional T cells; Treg, regulatory T cells). (F) Feature plot of Il12b expression across cell clusters identified in A. (G) Expression in DC1 and DC2 of genes associated with IL-12 production. (H) MC38 tumor volumes in Zbtb46-DTR bone marrow chimeras treated or not with diphtheria toxin (DT) to deplete DCs prior to aPD-1 or control treatment. (I) MC38 tumor volume in mice treated with aPD-1 (black), aPD-1 and aIL-12 (red), or vehicle (gray); n = 15 mice/group. Data are representative of at least two independent experiments. Arrows indicate duration of treatment. n.s. = not significant, * p < 0.05, *** p < 0.001. Values represent SEM. For comparisons between three or more groups, One way ANOVA with multiple comparisons was used. See also Figure S2.
Figure 3.
Figure 3.. DC-mediated IL-12 production requires IFN-γ sensing
(A) Flow cytometry measurement of PD-1 expression across cell types in the MC38 tumor microenvironment. (B) Intravital micrographs of the MC38 tumor microenvironment in an IL12 reporter mouse five days after AF647-aPD-1 treatment. Tumor cells (red), TAM (blue), IL-12p40 (green), aPD-1 (white). (C) Intravital micrographs and quantification of IL-12p40 signal two days after aPD-1 treatment in the tumor microenvironment after CD8 depletion. Tumor cells (red), IL-12p40 (green). Data plotted as fold change in IL-12p40 from baseline levels. (D) MC38 tumors were harvested at 3 days post- treatment with aPD-1 in combination with aIFN-γ or control, and processed for RNA isolation. Quantitative PCR for IL12p40 gene expression data are normalized with control sample values set to 1. (E) Relative IL-12p40 gene expression in MC38 tumors from CD11c-cre (Itgax-cre) x IFNγ R1fl/fl (IFN.R-deficient) or control (IFNγ R1fl/fl) mice three days after aPD-1 treatment. (F) Change in MC38 tumor volume on day six after aPD-1 treatment in IFN. R-deficient or control mice. Data are relative to pre-treatment tumor volumes. Data are representative of at least two independent experiments. n.s. = not significant, * p < 0.05, ** p < 0.01, *** p < 0.001, **** p < 0.0001. For comparisons between two groups, Student’s two- tailed t-test was used. For comparisons between three or more groups, One way ANOVA with multiple comparisons was used. See also Figure S3.
Figure 4.
Figure 4.. IL-12 activates TILs directly in mice
(A) Left: Intravital micrographs of MC38 tumors in IFN-γ-eYFP reporter mice before or four days after treatment with recombinant IL-12. Yellow, IFN-γ-eYFP expressing cells; red, MC38 tumor cells. Right: Fold change of IFN-γ + cells in treated and untreated groups compared to baseline. Arrow indicates duration of IL-12 treatment. (B) MC38 tumor growth monitored after mice bearing established tumors were treated with recombinant IL-12 (blue line) or control (grayline) for 5 days; n ≥ 3 per group. (C) Tumor-infiltrating CD8+ T cells isolated from MC38 tumors, stimulated in vitro with anti- CD3/CD28 and/or IL-12, and assessed by flow cytometry for intracellular IFN-γ production. Data show IFN-γ mean fluorescent intensity (MFI; n = 3 per group). Data are representative of at least two independent experiments. ** p < 0.01, *** p < 0.001, **** p < 0.0001. For comparisons between two groups, Student’s two-tailed t-test was used. For comparisons between three or more groups, One way ANOVA with multiple comparisons was used. See also Figure S4.
Figure 5.
Figure 5.. IL-12 activates TILs directly in cancer patients
(A) Relative expression levels of cytolytic signature genes measured by Nanostring in skin tumor biopsies from 19 melanoma patients both before (gray dots) and after (blue dots) intratumoral treatment with ImmunoPulse IL-12. Data are normalized to pre-treatment biopsy expression levels; POL2RA is a control gene. (B) Heat map of individual patient gene expression from melanoma biopsies from (A). Cytolytic signature genes are displayed as fold change over pre-treatment levels for each individual patient. OAZ1, POLR2A, and SDHA are control genes. (C) Clinical outcomes data from patients receiving ImmunoPulse treatment. SD, stable disease; PR, partial response; PD, progressive disease. Cytolytic signature was calculated as the sum of total cytolytic gene signature expression from (B). Values were stratified by the top, middle, and bottom third, and then associated to patient response status. (D) IFN-γ production by tumor-infiltrating CD8+ T cells isolated from six cancer patients, stimulated ex vivo with aCD3 and/or IL-12, and measured by ELISA. n.s. = not significant, ND = not detected, * p < 0.05, ** p < 0.01, *** p < 0.001. For comparisons between two groups, Student’s two- tailed t-test was used. See also Figure S5.
Figure 6.
Figure 6.. Molecular targeting of the non-canonical NFkB pathway stimulates IL12-producing DCs
(A) Expression of non-canonical NFkB pathway components (illustrated on the left) across immune populations. (B) Intravital micrographs of a MC38 tumor in an IL-12p40 reporter mouse treated with AF647-aCD40 mAbs. Tumor cells (red), AF647-aCD40 (white), IL-12p40 (green), TAM (blue). Dashed yellow line highlights the location of an IL-12p40+ cell; ▽ show TAM overlay ing with aCD40 mAbs. (C) Left: Intravital micrographs of MC38 tumors in IL-12p40-eΓ FP reporter mice treated with aCD40 or AZD5582. Untreated mice were used as controls. Green, IFN-γ -eYFP expressing cells; red, tumor cells. Right: Fold change of IL-12p40+ cells in each group after 48 hours and compared to baseline. (D-E) Ex vivo flow cytometry analysis of MC38 tumors in IL-12p40 reporter mice treated or not 48 hprior with agonistic aCD40 mAbs. CD45+ F4/80+ TAMs (black) and CD45+ F4/80 CD11chi MHCIIhi DCs (red). (D) Fold change of IL-12p40+ cells normalized to untreated mice (E) MFI of IL-12 reporter signal from TAM or DC. Data are representative of at least two independent experiments. n.s. = not significant, * p < 0.05, ** p < 0.01, *** p < 0.001, **** p < 0.0001, One way ANOVA with multiple comparisons. See also Figure S6.
Figure 7.
Figure 7.. Amplification of IL12-producing DCs improves cancer immunotherapy in an IL-12-dependent manner
(A) Intravital images of MC38 tumors in IFN-γ reporter mice treated with control mAb (left panel) or agonistic aCD40 mAb (middle panel). Images were recorded one day after treatment. Red, MC38 tumor cells; blue, tumor-associated macrophages (TAM); y ellow, IFN-γ -producing cells. Scale bars represent 30 µm. Longitudinal imaging of control or aCD40-treated mice was used to quantitate the change in density of IFN-γ -expressing cells compared to pre-treatment (right panel). For both mouse cohorts, at least 10 fields of view per time-point were used. (B) MC38 tumor volume change after aCD40 or AZD5582 treatment in MC38 tumor-bearing mice with or without neutralizing IL-12 mAbs (aIL-12). Data are normalized to pre-treatment tumor volumes for individual mice, n = 7–9 mice/group. (C) Survival of MC38 tumor- bearing mice treated with aCD40 (green), aPD-1 (black) or aPD-1 + aCD40 (red). Untreated mice served as controls (grey), n ≥ 6 mice/group. (D) Survival of B16F10 melanoma tumor-bearing mice treated with aCD40 (green), aPD-1 (black) or aPD-1 + aCD40 (red). Untreated mice served as controls (grey ), n = 7–12 mice/group. (E) Mice cured with aPD- 1 + aCD40 (see panel F) were re-challenged ~50 d later with B16F10 melanoma cells. Naive mice challenged at the same time served as positive controls. Data show the percent of mice rejecting B16F10 tumor re-challenge in each group. (F) Change in B16F10 tumor volume following treatment with aPD-1 (black circles), IL-12 (blue circles) or both (blue triangles). Untreated mice served as controls (grey circles), n ≥ 5 mice/group. (G) Change in B16F10 tumor volume following treatment with aCD40 (green line), aPD-1 + aCD40 (red dashed line) or aPD-1 + aCD40 + aIL-12 (pink line). Untreated mice served as controls (grey circles), n ≥ 5 mice/group. Data are representative of at least two independent experiments. n.s. = not significant, * p < 0.05, ** p < 0.01, *** p < 0.001, **** p < 0.0001. For comparisons between two groups, Student’s two-tailed t-test was used. For comparisons between three or more groups, One way ANOVA with multiple comparisons was used. See also Figure S7.

Comment in

  • The Dendritic Cell Strikes Back.
    Moussion C, Mellman I. Moussion C, et al. Immunity. 2018 Dec 18;49(6):997-999. doi: 10.1016/j.immuni.2018.12.007. Immunity. 2018. PMID: 30566889

References

    1. Alloatti A, Rookhuizen DC, Joannas L, Carpier JM, Iborra S, Magalhaes JG, Yatim N, Kozik P, Sancho D, Albert ML et al. (2017). Critical role for Sec22b-dependent antigen cross-presentation in antitumor immunity. J Exp Med 214, 2231–2241. - PMC - PubMed
    1. Arlauckas SP, Garris CS, Kohler RH, Kitaoka M, Cuccarese MF, Yang KS, Miller MA, Carlson JC, Freeman GJ, Anthony RM et al. (2017). In vivo imaging reveals a tumor-associated macrophage-mediated resistance pathway in anti-PD-1 therapy. Sci Transl Med 9, eaal3604. - PMC - PubMed
    1. Ayers M, Lunceford J, Nebozhyn M, Murphy E, Loboda A, Kaufman DR, Albright A, Cheng JD, Kang SP, Shankaran V et al. (2017). IFN-γ-related mRNA profile predicts clinical response to PD-1 blockade. J Clin Invest 127, 2930–2940. - PMC - PubMed
    1. Beatty GL, Chiorean EG, Fishman MP, Saboury B, Teitelbaum UR, Sun W, Huhn RD, Song W, Li D, Sharp LL et al. (2011). CD40 agonists alter tumor stroma and show efficacy against pancreatic carcinoma in mice and humans. Science 331, 1612–1616. - PMC - PubMed
    1. Broz ML, Binnewies M, Boldajipour B, Nelson AE, Pollack JL, Erle DJ, Barczak A, Rosenblum MD, Daud A, Barber DL et al. (2014). Dissecting the tumor myeloid compartment reveals rare activating antigen-presenting cells critical for T cell immunity. Cancer Cell 26, 638–652. - PMC - PubMed

Publication types

MeSH terms