. 2019 Jan;7(1):20-34.
doi: 10.1016/S2213-2600(18)30389-8. Epub 2018 Dec 11.

Moderate-to-severe asthma in individuals of European ancestry: a genome-wide association study

Affiliations

Moderate-to-severe asthma in individuals of European ancestry: a genome-wide association study

Nick Shrine et al. Lancet Respir Med. 2019 Jan.

Abstract

Background: Few genetic studies that focus on moderate-to-severe asthma exist. We aimed to identity novel genetic variants associated with moderate-to-severe asthma, see whether previously identified genetic variants for all types of asthma contribute to moderate-to-severe asthma, and provide novel mechanistic insights using expression analyses in patients with asthma.

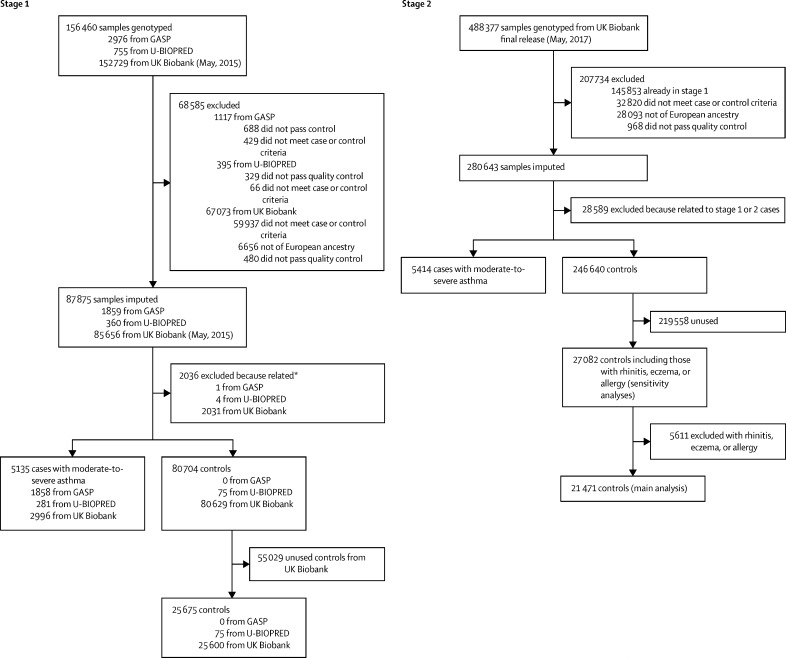
Methods: In this genome-wide association study, we used a two-stage case-control design. In stage 1, we genotyped patient-level data from two UK cohorts (the Genetics of Asthma Severity and Phenotypes [GASP] initiative and the Unbiased BIOmarkers in PREDiction of respiratory disease outcomes [U-BIOPRED] project) and used data from the UK Biobank to collect patient-level genomic data for cases and controls of European ancestry in a 1:5 ratio. Cases were defined as having moderate-to-severe asthma if they were taking appropriate medication or had been diagnosed by a doctor. Controls were defined as not having asthma, rhinitis, eczema, allergy, emphysema, or chronic bronchitis as diagnosed by a doctor. For stage 2, an independent cohort of cases and controls (1:5) was selected from the UK Biobank only, with no overlap with stage 1 samples. In stage 1 we undertook a genome-wide association study of moderate-to-severe asthma, and in stage 2 we followed up independent variants that reached the significance threshold of p less than 1 × 10⁻⁶ in stage 1. We set genome-wide significance at p less than 5 × 10⁻⁸. For novel signals, we investigated their effect on all types of asthma (mild, moderate, and severe). For all signals meeting genome-wide significance, we investigated their effect on gene expression in patients with asthma and controls.

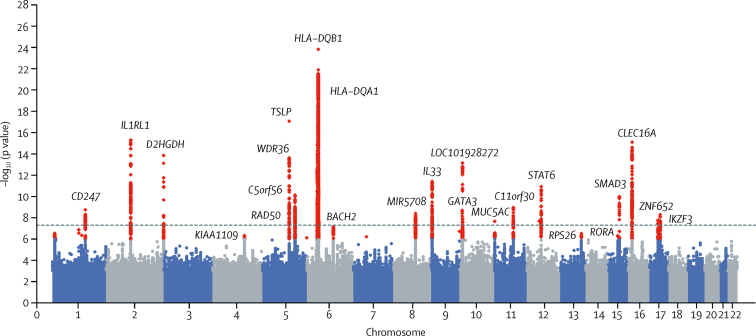
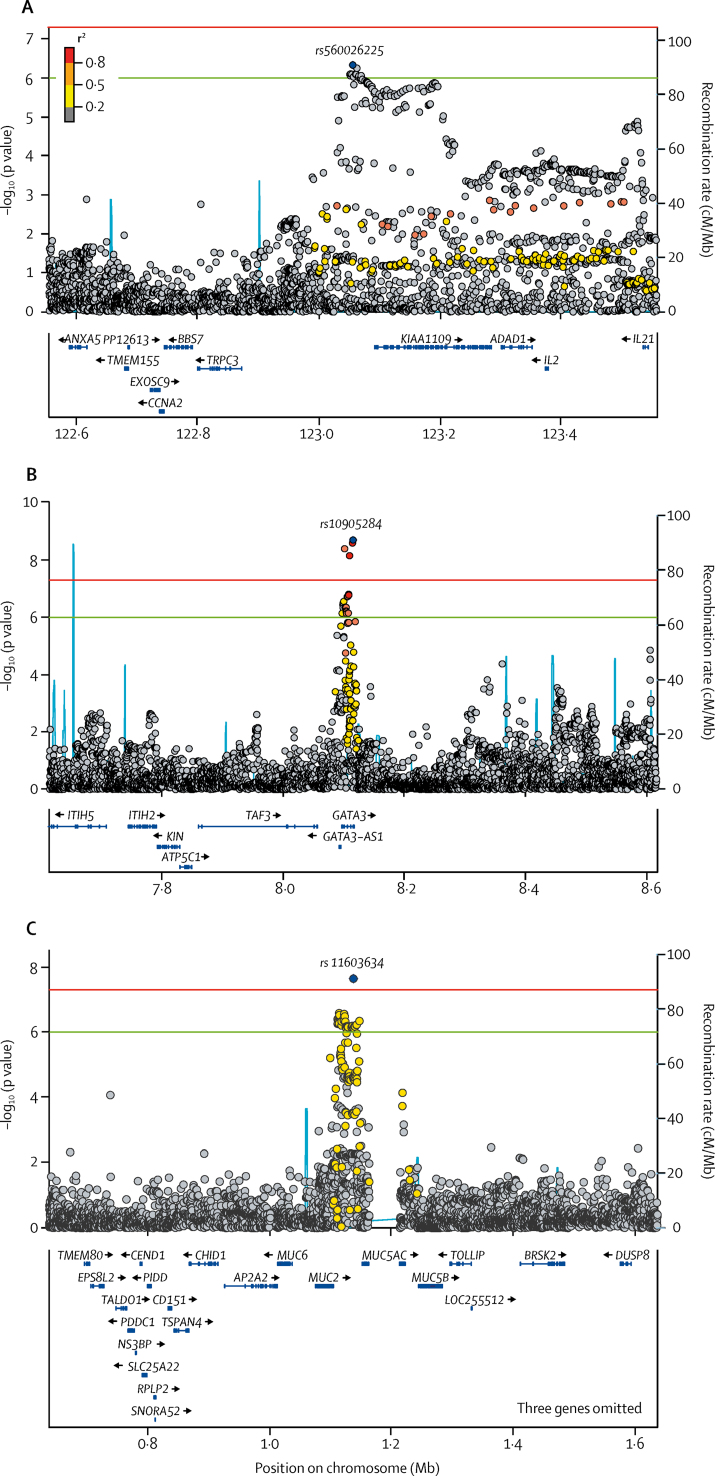
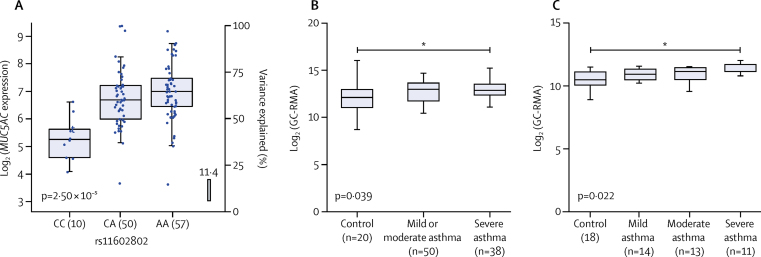
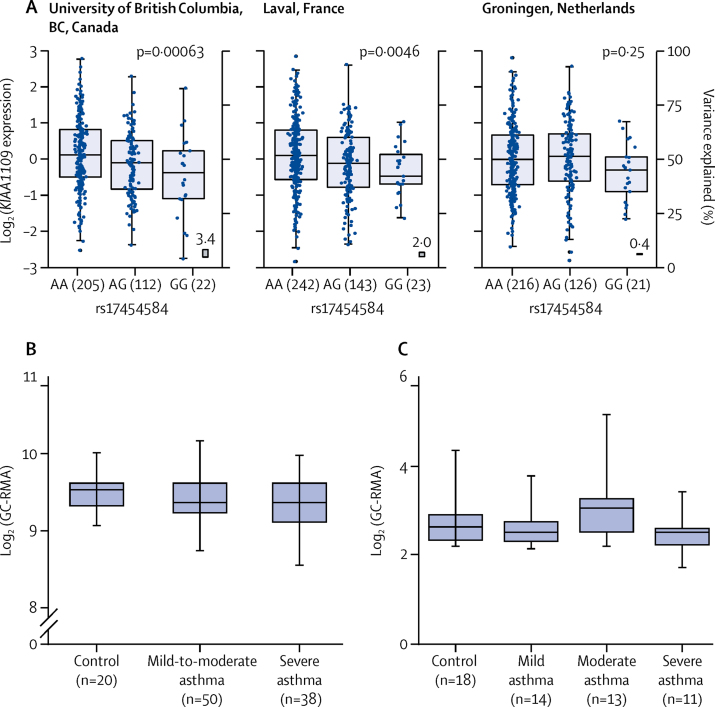
Findings: We included 5135 cases and 25 675 controls for stage 1, and 5414 cases and 21 471 controls for stage 2. We identified 24 genome-wide significant signals of association with moderate-to-severe asthma, including several signals in innate or adaptive immune-response genes. Three novel signals were identified: rs10905284 in GATA3 (coded allele A, odds ratio [OR] 0·90, 95% CI 0·88-0·93; p=1·76 × 10-10), rs11603634 in the MUC5AC region (coded allele G, OR 1·09, 1·06-1·12; p=2·32 × 10-8), and rs560026225 near KIAA1109 (coded allele GATT, OR 1·12, 1·08-1·16; p=3·06 × 10-9). The MUC5AC signal was not associated with asthma when analyses included mild asthma. The rs11603634 G allele was associated with increased expression of MUC5AC mRNA in bronchial epithelial brush samples via proxy SNP rs11602802; (p=2·50 × 10-5) and MUC5AC mRNA was increased in bronchial epithelial samples from patients with severe asthma (in two independent analyses, p=0·039 and p=0·022).

Interpretation: We found substantial shared genetic architecture between mild and moderate-to-severe asthma. We also report for the first time genetic variants associated with the risk of developing moderate-to-severe asthma that regulate mucin production. Finally, we identify candidate causal genes in these loci and provide increased insight into this difficult to treat population.

Funding: Asthma UK, AirPROM, U-BIOPRED, UK Medical Research Council, and Rosetrees Trust.


Figures

Figure 1
Figure 1
Quality control and sample selection GASP=Genetics of Asthma Severity and Phenotypes. U-BIOPRED=Unbiased BIOmarkers in PREDiction of respiratory disease outcomes. *Related samples (second degree or closer) were removed; see appendix for more details of sample selection.
Figure 2
Figure 2
Manhattan plot for stage 1 analyses of risk of moderate-to-severe asthma Data are for 5135 cases with moderate-to-severe asthma and 25 675 controls assessed for 33·8 million well-imputed variants. p values have had genomic control applied. Red data points are signals meeting criteria for follow-up in stage 2 (p<1 × 10−6) and the dotted line indicates genome-wide significance (p<5 × 10−8). Loci are labelled with the nearest gene for the 24 signals meeting genome-wide significance in the meta-analysis. Quantile-quantile plot for this analysis is in the appendix.
Figure 3
Figure 3
Regional association plots of novel signals KIAA1109 (A), GATA3 (B), and MUC5AC (C) associated with moderate-to-severe asthma Regional association plots from stage 1 analyses for the three novel signals that show statistically replicated association in stages 1 and 2 and met genome-wide significance in the meta-analyses. Significance of each single nucleotide polymorphism (SNP) is on the –log10 scale as a function of chromosome position (NCBI build 37). The sentinel SNP at each locus is shown by the blue peak, and data points are colour coded to show the correlations (r2) of each of the surrounding SNPs to the sentinel SNP. The green line indicates signals meeting criteria for inclusion in stage 2 (p<1 × 10−6) and the red line indicates genome-wide significance (p<5 × 10−8).
Figure 4
Figure 4
rs11603634 is an eQTL for MUC5AC in bronchial epithelial brush samples and MUC5AC mRNA expression is increased in bronchial epithelial cells from severe asthma patients (A) MUC5AC mRNA expression stratified by rs11602802 genotype. The boxes show the mean and SD and the whiskers show the IQR for each genotype. Generated from bronchial epithelial brush samples (n=117) collected as part of the U-BIOPRED study. rs11603634 was not directly genotyped, so the proxy rs11602802 was used. The rs11603634 asthma risk allele, G, is correlated with rs11602802, A, allele. (B) mRNA expression of MUC5AC in the GSE43696 dataset. Boxes showing the median and IQR, and the whiskers showing the minimum and maximum data, stratified by subject group. Bronchial epithelial brush samples were from controls (n=20), and patients with mild or moderate (n=50) and severe (n=38) asthma from the GSE43696 dataset and GC-RMA data for MUC5AC. MUC5AC levels were significantly higher in patients with severe asthma than in controls. (C) mRNA expression of MUC5AC in the GSE89809 dataset. The boxes show the median and IQR, and the whiskers showing the minimum and maximum data, stratified by subject group. Bronchial epithelial brush samples were from controls (n=18), and patients with mild (n=14), moderate (n=13), and severe (n=11) asthma from the GSE89809 dataset and GC-RMA data for MUC5AC was extracted. MUC5AC RNA concentrations were significantly higher in patients with severe asthma than in controls. More details of datasets and analyses are in the appendix. eQTL=expression quantitative trait loci. GC-RMA=GeneChip robust multi-array average. U-BIOPRED=Unbiased BIOmarkers in PREDiction of respiratory disease outcomes. *p<0·05 by Kruskal-Wallace test.
Figure 5
Figure 5
rs560026225 is an eQTL for KIAA1109 in lung tissue and KIAA1109 mRNA expression levels in bronchial epithelial cells from asthma patients (A) rs560026225 asthma risk allele, GATT, correlated with the rs17454584, G, allele. Data are for KIAA1109 expression for each recruitment centre, stratified by rs17454584 genotype. The boxes show the mean and SD and whiskers show the IQR for each genotype. Non-tumour lung tissue was isolated from 1110 individuals who had undergone lung resection across three centres to generate the eQTL dataset. rs560026225 was not directly genotyped, so rs17454584 was used as a proxy. (B) KIAA1109 expression levels in bronchial epithelial cells from asthma patients from the GSE43696 dataset. The boxes show the median and IQR, and whiskers the minimum and maximum data, stratified by subject group. Bronchial epithelial brush samples were from controls (n=20), and patients with mild or moderate (n=50) and severe (n=38) asthma in the GSE43696 dataset, and GC-RMA data for KIAA1109. No significant differences in KIAA1109 expression levels between groups were observed (Kruskal-Wallace test). (C) KIAA1109 expression levels in bronchial epithelial cells from asthma patients from the GSE89809 dataset. The boxes show the median and IQR, and whiskers the minimum and maximum data, stratified by subject group. Bronchial epithelial brush samples were from controls (n=18), and patients with mild (n=14), moderate (n=13), and severe (n=11) asthma from the GSE89809 dataset, and GC-RMA data for KIA1109. No significant differences in KIAA1109 expression levels between groups were observed. See appendix for more details of datasets and analyses. eQTL=expression quantitative trait loci. GC-RMA=GeneChip robust multi-array average.

Comment in

References

    1. GBD 2015 Chronic Respiratory Disease Collaborators Global, regional, and national deaths, prevalence, disability-adjusted life years, and years lived with disability for chronic obstructive pulmonary disease and asthma, 1990–2015: a systematic analysis for the Global Burden of Disease Study 2015. Lancet Respir Med. 2017;5:691–706. - PMC - PubMed
    1. Masoli M, Fabian D, Holt S, Beasley R. The global burden of asthma: executive summary of the GINA Dissemination Committee report. Allergy. 2004;59:469–478. - PubMed
    1. Jarjour NN, Erzurum SC, Bleecker ER. Severe asthma: lessons learned from the National Heart, Lung, and Blood Institute Severe Asthma Research Program. Am J Respir Crit Care Med. 2012;185:356–362. - PMC - PubMed
    1. Ober C, Yao TC. The genetics of asthma and allergic disease: a 21st century perspective. Immunol Rev. 2011;242:10–30. - PMC - PubMed
    1. Pickrell JK, Berisa T, Liu JZ, Ségurel L, Tung JY, Hinds DA. Detection and interpretation of shared genetic influences on 42 human traits. Nat Genet. 2016;48:709–717. - PMC - PubMed

Publication types