. 2019 Feb 4;218(2):433-444.
doi: 10.1083/jcb.201809123. Epub 2018 Dec 14.

Visualization of long-lived proteins reveals age mosaicism within nuclei of postmitotic cells

Affiliations

Visualization of long-lived proteins reveals age mosaicism within nuclei of postmitotic cells

Brandon H Toyama et al. J Cell Biol. .

Abstract

Many adult tissues contain postmitotic cells as old as the host organism. The only organelle that does not turn over in these cells is the nucleus, and its maintenance represents a formidable challenge, as it harbors regulatory proteins that persist throughout adulthood. Here we developed strategies to visualize two classes of such long-lived proteins, histones and nucleoporins, to understand the function of protein longevity in nuclear maintenance. Genome-wide mapping of histones revealed specific enrichment of long-lived variants at silent gene loci. Interestingly, nuclear pores are maintained by piecemeal replacement of subunits, resulting in mosaic complexes composed of polypeptides with vastly different ages. In contrast, nondividing quiescent cells remove old nuclear pores in an ESCRT-dependent manner. Our findings reveal distinct molecular strategies of nuclear maintenance, linking lifelong protein persistence to gene regulation and nuclear integrity.


Figures

Figure 1.
Figure 1.
RITE system for studying protein turnover. (A) Schematic of the RITE system. Top: The protein of interest (ORF) has a C-terminal tag and stop codon (tag1) flanked by loxP recombination sites, followed by a second tag and stop codon (tag2). Addition of Cre recombinase is used to genetically switch the C-terminal tag to tag2. Bottom: To trigger tag switch in differentiated myotubes, cells expressing RITE-tagged proteins are mixed with cells expressing CreERT2, differentiated to fuse and form myotubes, and tag-switch induced by the addition of 4OHT. (B) RITE system in mammalian cells. Dividing U2OS cells expressing a GFP-cherry RITE construct were fixed and imaged before (upper) and 3 d after (lower) Cre addition. (C) NPC proteins RITE-tagged. Dividing U2OS cells were transfected with RITE-tagged (FM) Pom121 and Nup93 nucleoporins, tag switch induced, fixed and stained 16 h later, and imaged by confocal microscopy. Inset represents a zoomed-in view of the region indicated. (D) Histones RITE-tagged. Histones H2B and H4 were RITE-tagged, expressed, fixed, stained, and imaged as in B. Scale bars represent 5 µm.
Figure 2.
Figure 2.
Histone dynamics using the RITE system. (A) Histone turnover in dividing cells. C2C12 cell lines stably expressing RITE-tagged (MF) H2B, H3.1, H3.3, and H4 were made, fixed, stained, and imaged using confocal microscopy before (0 Days) and 1, 2, and 3 d after tag switch was initiated in dividing cells. Representative images are displayed with Myc signal (red) overlaid with Flag signal (green). (B) Histone turnover in nondividing myotubes. The same cells from A were differentiated into myotubes as outlined in Fig. 1 A and fixed, stained, and imaged before (0 d) and 2, 4, and 7 d after tag switch. Upper panel of each set is the Myc (red) overlaid with Flag (green) signal. Lower panel of each set is staining of H3K9me3 in the same cells. Scale bars represent 5 µm. (C) ChIP-seq of RITE-tagged H3.3. RITE-tagged (MF) H3.3 C2C12 cells were differentiated into myotubes as described above and tag-switch induced. Myotube-enriched fractions were isolated from cells with no tag switch (0 d) and tag switched for 2 and 7 d. ChIP-seq was then performed on these time points using anti-Flag and anti-H3K9me3 antibodies. Regions of flag-tagged H3.3 incorporation were identified genome-wide (5′ to 3′ end), and H3K9me3 reads were correspondingly mapped. (D) Histone dynamics in quiescent cells. C2C12 cell lines from this figure were placed in quiescence, and tag switch time courses, staining, and imaging were conducted as described for B.
Figure 3.
Figure 3.
NPC dynamics using the RITE system. (A) Nups in dividing C2C12s. C2C12 cell lines stably expressing RITE-tagged (MF) Nup93, Nup96, Nup133, and Pom121 were made, fixed, stained, and imaged using confocal microscopy before (0 Days) and 1, 2, and 3 d after tag switch was initiated in dividing cells. Representative images are displayed with Myc signal (red) overlaid with Flag signal (green). Quantification of NE-localized Nup-RITE proteins, plotted underneath, is of relative Myc intensity on the NE as a fraction of total (MF) intensity on the NE. (B) Nups in nondividing myotubes. Cell lines from A were differentiated into nondividing myotubes as described in Fig. 1 A and fixed, stained, and imaged before (0 Days) and 3, 7, and 14 d after tag switch. Image representation and quantification are as described in A. (C) Nups in nondividing quiescent cells. Cell lines from A were induced into quiescence, fixed, stained, and imaged before (0 Days) and 3, 7, and 14 d after tag switch. Image representation and quantification are as described in A. All scale bars represent 5 µm. Error bars represent the 95% confidence interval.
Figure 4.
Figure 4.
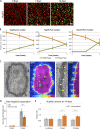
Mechanism of NPC turnover in nondividing quiescent cells. (A) Single pore imaging of Nup93 turnover in quiescent cells. C2C12 cells stably expressing RITE-tagged (MF) Nup93 were induced into quiescence and tag switch initiated. Cells were fixed and stained before (0 Days) and 7 and 14 d after tag switch. Cells were then imaged using structured illumination superresolution microscopy. Representative images display Myc (red) and Flag (green) signal overlaid. Scale bar represents 1 µm. (B) Quantification of Nup turnover in quiescent cells. Identical experiments were performed using Nup96 and Nup133 as described in A. Myc (Old) and Flag (New) pore numbers were then quantified at each time point and plotted. Error bars represent 95% confidence intervals. (C) MIMS imaging of long-lived NPCs. 15N-labeled mice chased with 14N food for 6 mo were perfused and fixed, tissues dissected and prepared for EM, and 80-nm-thick brain sections mounted on silicon wafers were imaged by scanning EM (SEM; left) and MIMS (right). Images were aligned, NPCs identified in SEM images (arrows), and corresponding MIMS signals highlighted (arrows). Yellow arrows represent NPCs with high 15N signal, and the white arrow is an NPC with low 15N signal. Data shown is from one mouse and is representative of three scanned neurons. (D) Nup93 turnover in Pom121 knockdowns. C2C12 cell lines were constructed that expressed both RITE-tagged (MF) Nup93 and an inducible shRNA targeting Pom121. Cells were placed into quiescence and tag switch induced with (orange bars) and without (gray bars) Pom121 knockdown induction. Cells were fixed, stained, and imaged before (0 Days) and 14 d after tag switch. Intensity of the flag signal (new) was normalized to background intensity and plotted. Error bars represent 95% confidence intervals. (E) Nup93 turnover with ESCRT-III knockdowns. C2C12 cell lines were constructed as in D, but expressing a nontargeting (luciferase) or ESCRT-III targeting inducible shRNAs (Chmp3 and Chmp2a). Turnover was quantified as described in Fig. 3 A. **, P < 0.01; ***, P < 0.001 calculated using two-tailed unpaired t tests.

Comment in

  • A mosaic of old and young nucleoporins.
    Shimi T, Kimura H. Shimi T, et al. J Cell Biol. 2019 Feb 4;218(2):385-386. doi: 10.1083/jcb.201811170. Epub 2019 Jan 15. J Cell Biol. 2019. PMID: 30647097 Free PMC article.

References

    1. Alber A.B., Paquet E.R., Biserni M., Naef F., and Suter D.M.. 2018. Single live cell monitoring of protein turnover reveals intercellular variability and cell-cycle dependence of degradation rates. Mol. Cell. 71:1079–1091.e9. 10.1016/j.molcel.2018.07.023 - DOI - PubMed
    1. Antonin W., Franz C., Haselmann U., Antony C., and Mattaj I.W.. 2005. The integral membrane nucleoporin pom121 functionally links nuclear pore complex assembly and nuclear envelope formation. Mol. Cell. 17:83–92. 10.1016/j.molcel.2004.12.010 - DOI - PubMed
    1. Aygün O., Mehta S., and Grewal S.I.S.. 2013. HDAC-mediated suppression of histone turnover promotes epigenetic stability of heterochromatin. Nat. Struct. Mol. Biol. 20:547–554. 10.1038/nsmb.2565 - DOI - PMC - PubMed
    1. Bergmann O., Bhardwaj R.D., Bernard S., Zdunek S., Barnabé-Heider F., Walsh S., Zupicich J., Alkass K., Buchholz B.A., Druid H., et al. . 2009. Evidence for cardiomyocyte renewal in humans. Science. 324:98–102. 10.1126/science.1164680 - DOI - PMC - PubMed
    1. Blau H.M., Cosgrove B.D., and Ho A.T.V.. 2015. The central role of muscle stem cells in regenerative failure with aging. Nat. Med. 21:854–862. 10.1038/nm.3918 - DOI - PMC - PubMed

Publication types