. 2019 Jan;29(1):74-84.
doi: 10.1101/gr.237198.118. Epub 2018 Dec 14.

Nucleosome remodeling at origins of global genome-nucleotide excision repair occurs at the boundaries of higher-order chromatin structure

Affiliations

Nucleosome remodeling at origins of global genome-nucleotide excision repair occurs at the boundaries of higher-order chromatin structure

Patrick van Eijk et al. Genome Res. 2019 Jan.

Abstract

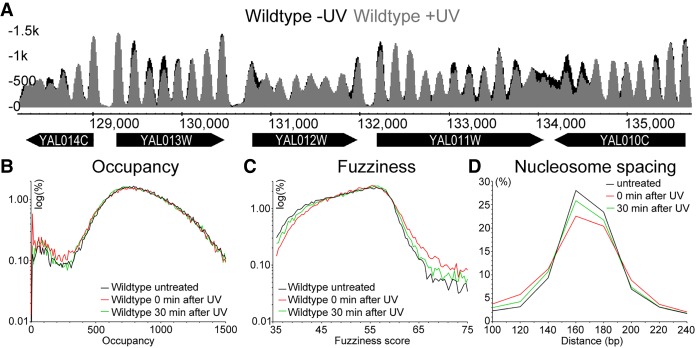
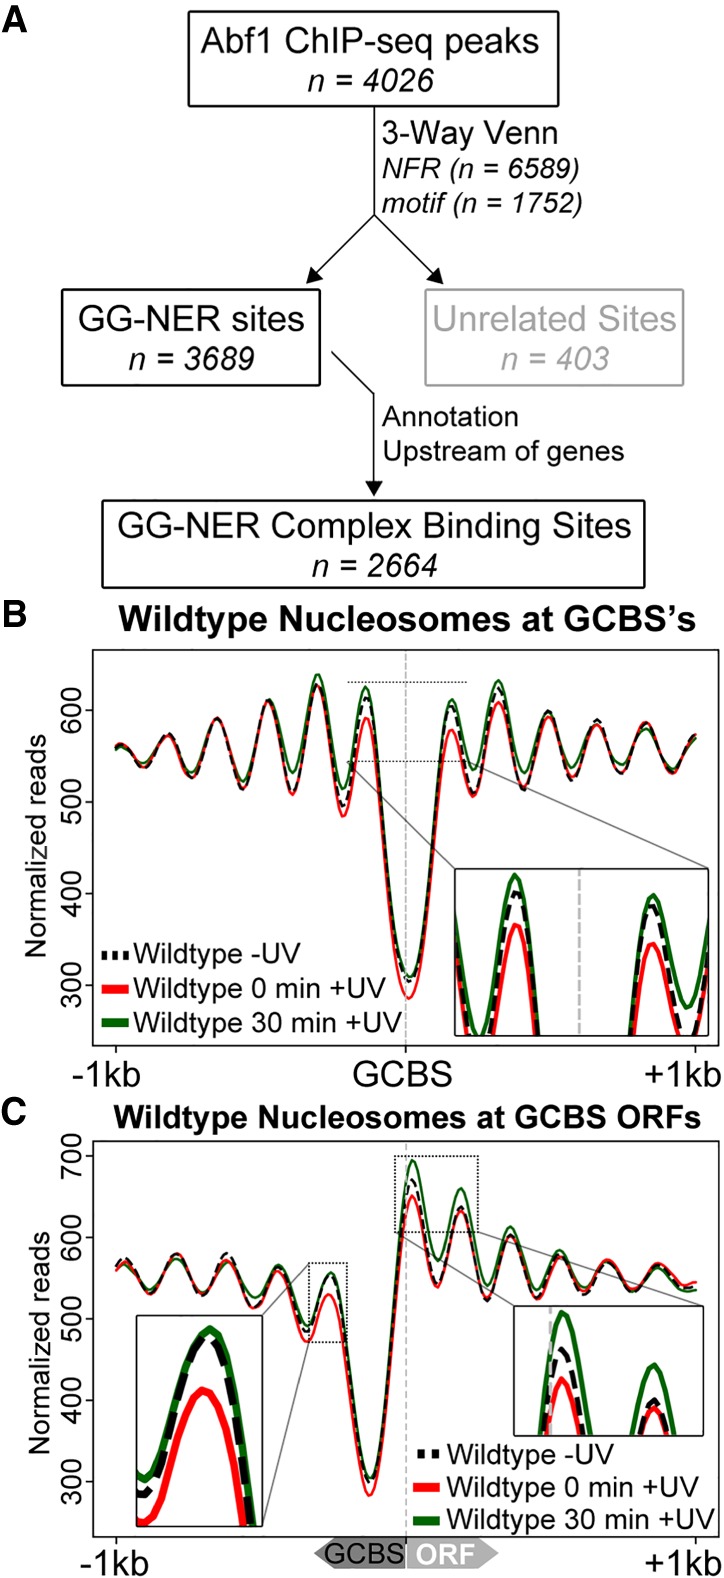
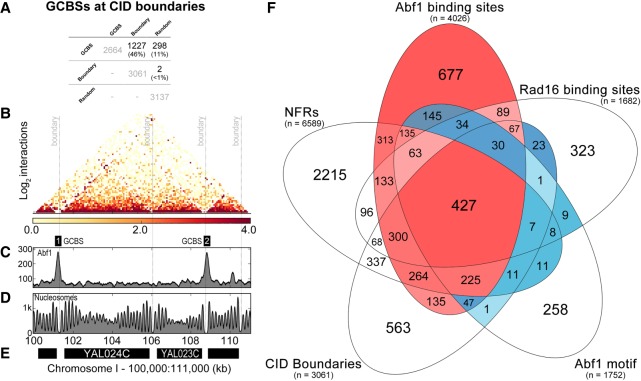
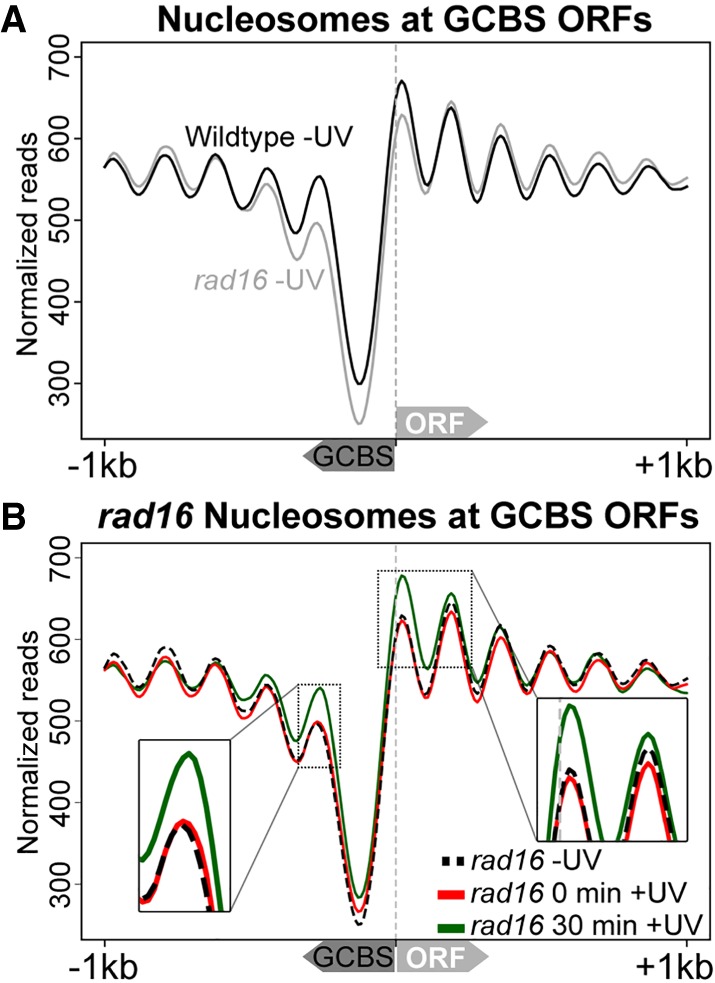
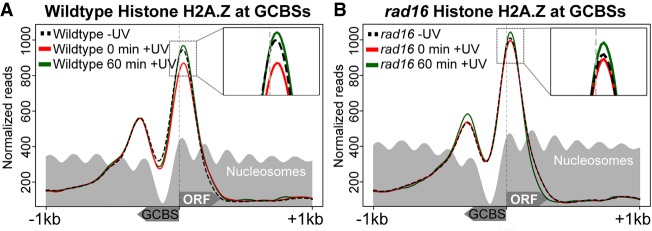
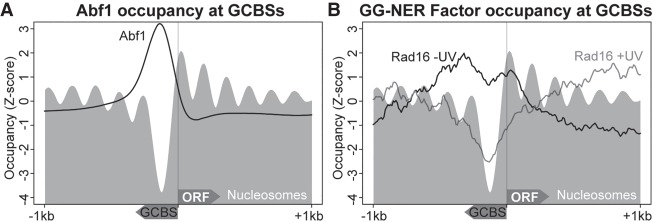
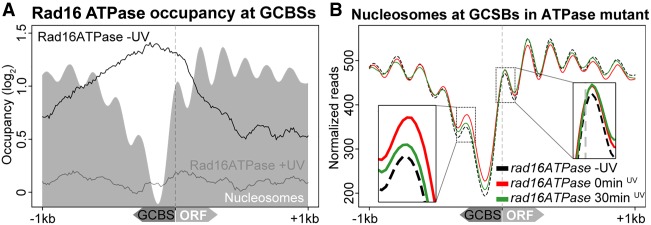
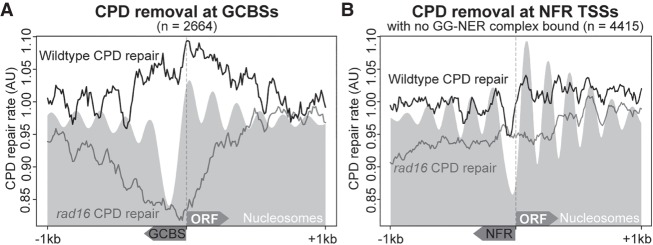
Repair of UV-induced DNA damage requires chromatin remodeling. How repair is initiated in chromatin remains largely unknown. We recently demonstrated that global genome-nucleotide excision repair (GG-NER) in chromatin is organized into domains in relation to open reading frames. Here, we define these domains, identifying the genomic locations from which repair is initiated. By examining DNA damage-induced changes in the linear structure of nucleosomes at these sites, we demonstrate how chromatin remodeling is initiated during GG-NER. In undamaged cells, we show that the GG-NER complex occupies chromatin, establishing the nucleosome structure at these genomic locations, which we refer to as GG-NER complex binding sites (GCBSs). We demonstrate that these sites are frequently located at genomic boundaries that delineate chromosomally interacting domains (CIDs). These boundaries define domains of higher-order nucleosome-nucleosome interaction. We demonstrate that initiation of GG-NER in chromatin is accompanied by the disruption of dynamic nucleosomes that flank GCBSs by the GG-NER complex.


Figures

Figure 1.
Figure 1.
UV-induced changes to the genome-wide nucleosome landscape. (A) Represented here are the nucleosome traces of wild-type cells before (black) and after UV irradiation (gray) in an 8-kbp region on Chromosome I (128,000–136,000). The genes and their systematic names are indicated by the black arrows underneath the traces. The y-axis on the left indicates the relative read-counts that define the nucleosome peaks in this region. (B) Genome-wide changes to wild-type nucleosome occupancy (peak height) in response to UV irradiation are quantified here. The distribution of relative occupancy (in reads) of all the more than 60,000 nucleosomes as a log-scale of percentage is shown here. (C) As B but now quantifying the degree of freedom a nucleosome has to occupy its unitary position, expressed as fuzziness of all nucleosomes in response to UV irradiation. (D) As B and C, but now quantifying the change in the distribution of nucleosome spacing, reflecting the position of nucleosomes in the linear genome, expressed in base pairs for all nucleosomes after UV irradiation.
Figure 2.
Figure 2.
Identification of the genomic list of GCBSs and the nucleosome occupancy in relation to these sites. (A) Flow chart to illustrate the bioinformatics analysis performed to identify genome-wide GCBSs by refining and filtering the list of Abf1 ChIP-seq peaks using NFR positions, motif sites, and annotation information. (B) MNase-seq data of wild-type cells were used to plot cumulative nucleosome positions around GCBSs (n = 2664) in the absence of UV irradiation and at different intervals after UV irradiation, displaying regularly spaced nucleosome arrays at these genomic locations. The x-axis denotes the 2-kbp regions surrounding the GCBSs, while the y-axis indicates nucleosome occupancy as measured by normalized reads. (C) Nucleosome occupancy in wild-type cells before and after UV damage. MNase-seq data of untreated and UV-treated cells are shown as cumulative graphs around GCBSs in relation to ORF structure. The insets highlight the nucleosome remodeling at the −1 position (left) and the remodeling at positions +1 and +2 (right).
Figure 3.
Figure 3.
GCBSs are located at the boundaries of chromosomally interacting domains (CIDs). (A) Overlap calculations identified the number and identity of GCBSs (n = 2664) at CID boundaries (n = 3061) and at random sites (n = 3137). The percentage of GCBSs in each subcategory is indicated between brackets. (B) Micro-C data (Hsieh et al. 2016) were used to plot nucleosome–nucleosome interactions in a 11-kbp window on Chromosome I. The gray dashed lines indicate four boundary positions documented in the literature (Hsieh et al. 2015). The intensity of the heatmap is a measure for the normalized interactions indicated beneath the panel. (C) Abf1 ChIP-seq data are plotted here to highlight two GCBSs in this region of the genome labeled as GCBS 1 and 2. (D) The nucleosome landscape is presented here by plotting MNase-seq data at this genomic location. (E) Indicated in black bars are the genes located within this region of the genome. The labels on the x-axis highlight the genomic coordinates in kilobase pairs. The y-axis on each panel indicates peak height as normalized reads. (F) The combined positions of the five features that characterize GCBSs were used to generate a five-way Venn diagram to illustrate how each genomic feature contributes to the formation of a GCBS. Highlighted in red are the predominant classes that make up our list of GCBSs, with intensity signifying the amount of binding sites in each subclass. Conversely, in blue we highlight the Abf1 binding sites and other features that are not classified as GCBSs. Color intensity is used here to indicate the number of features in each subcategory. The number of each feature is listed between brackets.
Figure 4.
Figure 4.
GG-NER complex adjacent nucleosomes are established and remodeled following UV irradiation in a Rad16-dependent fashion. (A) MNase-seq data of wild-type and rad16 mutant cells were used to plot cumulative nucleosome positions around GCBSs (n = 2664) in the absence of UV irradiation. The annotation of the nearest gene was used to infer strand information to align these genomic positions according to gene orientation as indicated by the arrows on the x-axis depicting the relative direction the GCBS and ORF. The x-axis denotes 2-kbp regions surrounding the GCBSs, while the y-axis indicates nucleosome occupancy as measured by normalized reads. (B) As described in A, but showing UV-induced changes to nucleosome positions around GCBSs and accompanying ORFs in rad16-mutated, GG-NER–defective cells.
Figure 5.
Figure 5.
UV-induced loss of H2A.Z occupancy requires GG-NER complex-dependent nucleosome remodeling around GCBSs. (A) The UV-induced change to H2A.Z occupancy in wild-type cells around GCBS-associated TSSs is shown here using H2A.Z ChIP-seq data, prior to UV irradiation and 0 or 60 min after UV damage. The light gray trace represents the nucleosome positioning in the absence of DNA damage retrieved from the data shown in Figure 4. The inset highlights the UV-induced changes to H2A.Z occupancy at the +1 position. (B) As described in A, but now representing the H2A.Z occupancy at GCBS-bound promoter regions in GG-NER–defective RAD16-deleted cells.
Figure 6.
Figure 6.
GG-NER complex binding to chromatin around GCBS-associated promoter regions. (A) Genomic positions of GCBS-associated genes were used to plot the genome-wide Abf1 ChIP-seq data at TSSs to map the location of complex binding in relation to gene structure and nucleosome positions at these genes. The gray nucleosome trace represents nucleosome occupancy in the absence of UV irradiation at these loci. The y-axis represents the Z-score to compare data with different read-depths in the same plot. (B) GG-NER complex binding as assessed by Rad16 ChIP-chip data (Yu et al. 2016) plotted at GCBS-associated genes.
Figure 7.
Figure 7.
GG-NER complex chromatin occupancy and nucleosome remodeling after UV irradiation requires the ATPase function of Rad16. (A) Chromatin occupancy of the Rad16 ATPase mutated protein at GCBSs is plotted here using ChIP-chip data (Yu et al. 2016). The pre-UV irradiation data are shown by the black trace, while the 15-min post-UV chromatin occupancy is presented by the gray trace. The nucleosome landscape in the ATPase mutant is shown by the gray shading at these of positions. (B) MNase-seq data from the RAD16 ATPase mutant cells are shown at GCBS-associated ORFs in a 2-kbp window. The arrows on the x-axis indicate the relative orientation of the GCBSs and ORFs. The insets highlight the UV-induced changes to the nucleosome occupancy at the positions immediately adjacent to the GG-NER complex–occupied promoter.
Figure 8.
Figure 8.
GG-NER complex binding at a subset of NFRs organizes repair in chromatin, but this is not a general feature of NFRs. (A) Relative CPD repair rates are plotted around GCBSs for both wild-type and rad16 GG-NER–defective mutant cells in relation to the nucleosome landscape, indicated as the gray shaded area. The x-axis indicates the orientation of both the GCBS and the ORF in relation to TSSs. (B) As described in A, but here plotting the relative repair rates at non-GCBS-associated NFRs (n = 4415) (see Supplemental Fig. S1), orienting the data in relation to the nearest gene aligning at the TSS with the NFR positioned upstream. The x-axis indicates regions 1 kbp upstream of and downstream from these positions. The gray shaded area represents the nucleosome data at these positions.

Similar articles

Cited by

References

    1. Adam S, Dabin J, Polo SE. 2015. Chromatin plasticity in response to DNA damage: the shape of things to come. DNA Repair 32: 120–126. 10.1016/j.dnarep.2015.04.022 - DOI - PMC - PubMed
    1. Albert I, Mavrich TN, Tomsho LP, Qi J, Zanton SJ, Schuster SC, Pugh BF. 2007. Translational and rotational settings of H2A.Z nucleosomes across the Saccharomyces cerevisiae genome. Nature 446: 572–576. 10.1038/nature05632 - DOI - PubMed
    1. Buschbeck M, Hake SB. 2017. Variants of core histones and their roles in cell fate decisions, development and cancer. Nat Rev Mol Cell Biol 18: 299–314. 10.1038/nrm.2016.166 - DOI - PubMed
    1. Chen K, Xi Y, Pan X, Li Z, Kaestner K, Tyler J, Dent S, He X, Li W. 2013. DANPOS: dynamic analysis of nucleosome position and occupancy by sequencing. Genome Res 23: 341–351. 10.1101/gr.142067.112 - DOI - PMC - PubMed
    1. Ciccia A, Elledge SJ. 2010. The DNA damage response: making it safe to play with knives. Mol Cell 40: 179–204. 10.1016/j.molcel.2010.09.019 - DOI - PMC - PubMed

Publication types

MeSH terms

LinkOut - more resources