Clinical Trial
. 2019 Feb;42(2):248-257.
doi: 10.2337/dc18-1507. Epub 2018 Dec 14.

Pancreas Volume Declines During the First Year After Diagnosis of Type 1 Diabetes and Exhibits Altered Diffusion at Disease Onset

Affiliations
Clinical Trial

Pancreas Volume Declines During the First Year After Diagnosis of Type 1 Diabetes and Exhibits Altered Diffusion at Disease Onset

John Virostko et al. Diabetes Care. 2019 Feb.

Abstract

Objective: This study investigated the temporal dynamics of pancreas volume and microstructure in children and adolescents with recent-onset type 1 diabetes (T1D) and individuals without diabetes, including a subset expressing autoantibodies associated with the early stages of T1D.

Research design and methods: MRI was performed in individuals with recent-onset stage 3 T1D (n = 51; median age 13 years) within 100 days after diagnosis (mean 67 days), 6 months, and 1 year postdiagnosis. Longitudinal MRI measurements were also made in similarly aged control participants (n = 57) and in autoantibody-positive individuals without diabetes (n = 20). The MRI protocol consisted of anatomical imaging to determine pancreas volume and quantitative MRI protocols interrogating tissue microstructure and composition.

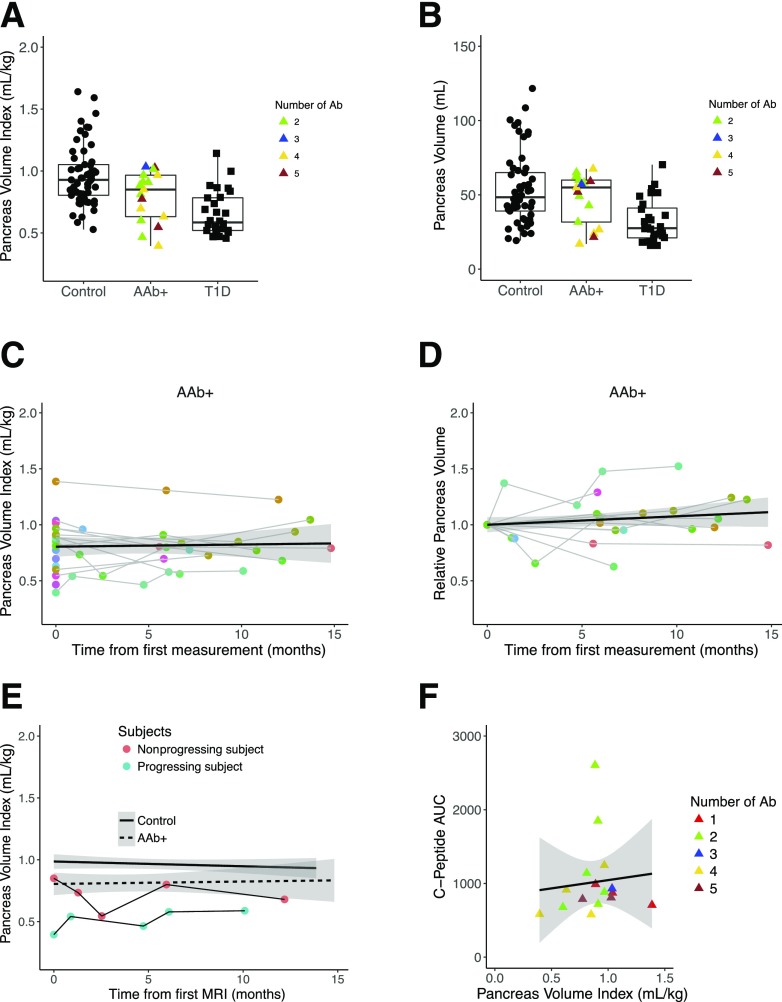
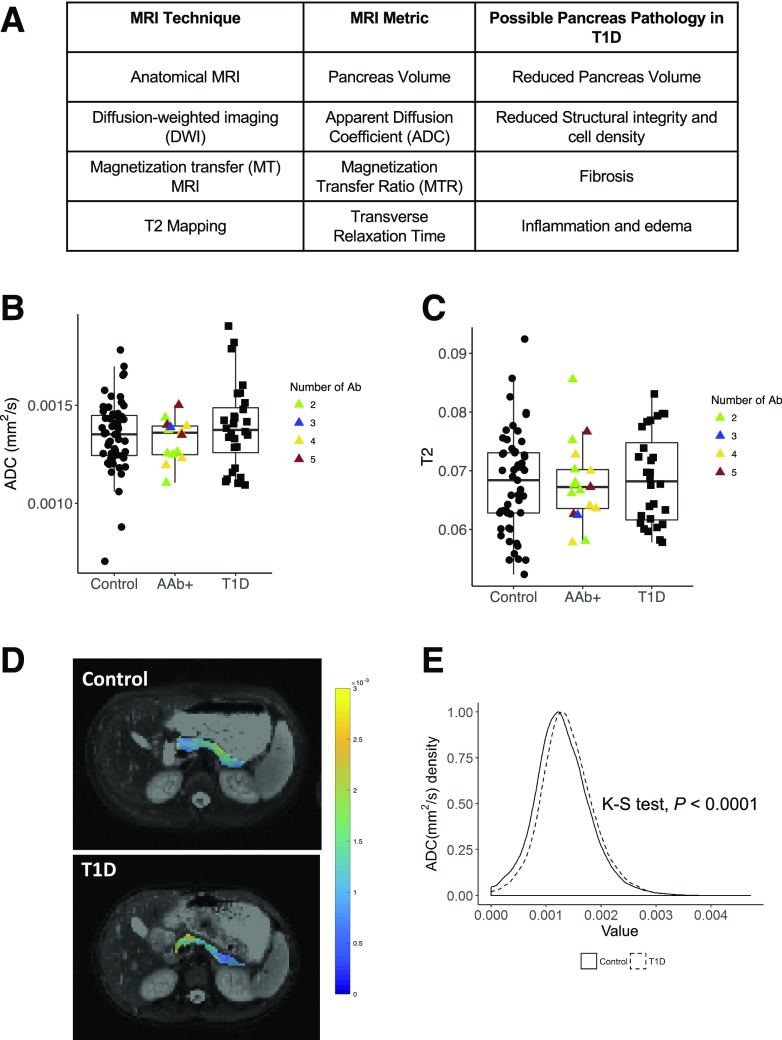
Results: Within 100 days of diabetes onset, individuals with T1D had a smaller pancreas (median volume 28.6 mL) than control participants (median volume 48.4 mL; P < 0.001), including when normalized by individual weight (P < 0.001). Longitudinal measurements of pancreas volume increased in control participants over the year, consistent with adolescent growth, but pancreas volume declined over the first year after T1D diagnosis (P < 0.001). In multiple autoantibody-positive individuals, the pancreas volume was significantly larger than that of the T1D cohort (P = 0.017) but smaller than that of the control cohort (P = 0.04). Diffusion-weighted MRI showed that individuals with recent-onset T1D had a higher apparent diffusion coefficient (P = 0.012), suggesting a loss of cellular structural integrity, with heterogeneous pancreatic distribution.

Conclusions: These results indicate that pancreas volume is decreased in stages 1, 2, and 3 of T1D and decreases during the first year after diabetes onset and that this loss of pancreatic volume is accompanied by microstructural changes.

Trial registration: ClinicalTrials.gov NCT03585153.


Figures

Figure 1
Figure 1
A: Schematic of study design. MRI was performed on participants with T1D within 100 days of diagnosis (dx) and repeated at 6-month increments. Participants with autoantibodies or without T1D were scanned at similar intervals. The number of individuals imaged at the 6- and 12-month time points is shown. B: An axial MRI slice through the abdomen of a control participant shows the pancreas (outlined in white). Participant was a 10-year-old male who weighed 29 kg. C: An axial MRI slice through the abdomen of a participant with recent-onset T1D shows a smaller, thinner pancreas than seen in the control participant (outlined in white). Participant was also a 10-year-old male who weighed 29 kg. D: In the control cohort, pancreas volume correlated with participant weight over the course of adolescent growth. E: Pancreas volume normalized by participant weight, yielding a pancreas volume index in units of mL/kg, is smaller in participants with T1D than control participants. F: Pancreas volume index is unchanged in the control pancreas over a 1-year period but declines in participants with T1D over the year after diagnosis. G: When normalized to the baseline measurement for each study participant, pancreas volume increases in the control population but declines in participants with T1D. Shading indicates the 95% CI in all figures.
Figure 2
Figure 2
A: Pancreas volume index in autoantibody-positive (AAb+) participants with T1D is smaller than that in control participants and larger than that in participants with recent-onset T1D. Autoantibody-positive participants are color coded according to the number of autoantibodies present at the time of the MRI scan. B: Pancreas volume in autoantibody-positive participants demonstrates dichotomy with one group of participants with pancreas volume similar to that of control participants and one group with pancreas volume similar to that of participants with T1D. C: Average pancreas volume index displays no clear trend in the autoantibody-positive pancreas over a 1-year period. D: When normalized to the baseline measurement for each autoantibody-positive participant, pancreas volume displays no clear average trend over the course of the study. E: Two of the autoantibody-positive participants had abnormal glucose tolerance testing during the study period. One of these participants (denoted as the nonprogressing participant) remitted from stage 2 T1D to stage 1 T1D, whereas the other (denoted as the progressing participant) was diagnosed with stage 3 T1D. The solid black line indicates the average of the control cohort in this study, whereas the dashed black line indicates the average of the autoantibody-positive cohort in this study. F: Pancreas volume index does not correlate with insulin production in autoantibody-positive participants as assessed by OGTT. Shading indicates the 95% CI in all figures. Ab, antibody; AUC, area under the curve.
Figure 3
Figure 3
A: MRI techniques performed in this study, corresponding quantitative MRI metric, and possible pancreas pathologies in T1D that may be assayed by each technique. B: DW-MRI indicates that the mean ADC in the pancreas is higher in participants with recent-onset T1D. Autoantibody-positive (AAb+) participants are color coded according to the number of autoantibodies present at the time of the MRI scan. C: The mean T2 of the pancreas is similar in control participants, participants with T1D, and autoantibody-positive participants. D: Multiparametric maps of the ADC in the pancreas of a control participant (top) and participant with recent-onset T1D (bottom) reveal focal variations in ADC. The participants shown in D are both 10-year-old females; the control participant weighed 35 kg, and the participant with T1D weighed 36 kg. Note the difference in pancreas area between the participants and the focal area with high ADC in the head of the pancreas of the participant with T1D. E: Histogram analysis comparing the ADC of all voxels from control pancreata with the ADC of voxels from all T1D pancreata demonstrates differences in the distribution of ADC values, with higher numbers of voxels with high ADC in the T1D pancreas. Ab, antibody; K-S test, Kolmogorov-Smirnov test.

Similar articles

Cited by

References

    1. Chiarelli F, Verrotti A, Altobelli E, Blasetti A, Morgese G. Size of the pancreas in type I diabetic children and adolescents. Diabetes Care 1995;18:1505–1506 - PubMed
    1. Fonseca V, Berger LA, Beckett AG, Dandona P. Size of pancreas in diabetes mellitus: a study based on ultrasound. Br Med J (Clin Res Ed) 1985;291:1240–1241 - PMC - PubMed
    1. Gepts W. Pathologic anatomy of the pancreas in juvenile diabetes mellitus. Diabetes 1965;14:619–633 - PubMed
    1. Gaglia JL, Guimaraes AR, Harisinghani M, et al. . Noninvasive imaging of pancreatic islet inflammation in type 1A diabetes patients. J Clin Invest 2011;121:442–445 - PMC - PubMed
    1. Williams AJ, Thrower SL, Sequeiros IM, et al. . Pancreatic volume is reduced in adult patients with recently diagnosed type 1 diabetes. J Clin Endocrinol Metab 2012;97:E2109–E2113 - PubMed

Publication types

MeSH terms

Associated data