A placental mammal-specific microRNA cluster acts as a natural brake for sociability in mice
- PMID: 30552145
- PMCID: PMC6362351
- DOI: 10.15252/embr.201846429
A placental mammal-specific microRNA cluster acts as a natural brake for sociability in mice
Abstract
Aberrant synaptic function is thought to underlie social deficits in neurodevelopmental disorders such as autism and schizophrenia. Although microRNAs have been shown to regulate synapse development and plasticity, their potential involvement in the control of social behaviour in mammals remains unexplored. Here, we show that deletion of the placental mammal-specific miR379-410 cluster in mice leads to hypersocial behaviour, which is accompanied by increased excitatory synaptic transmission, and exaggerated expression of ionotropic glutamate receptor complexes in the hippocampus. Bioinformatic analyses further allowed us to identify five "hub" microRNAs whose deletion accounts largely for the upregulation of excitatory synaptic genes observed, including Cnih2, Dlgap3, Prr7 and Src. Thus, the miR379-410 cluster acts a natural brake for sociability, and interfering with specific members of this cluster could represent a therapeutic strategy for the treatment of social deficits in neurodevelopmental disorders.
Keywords: autism; glutamate receptor; hippocampus; microRNA; sociability.
© 2018 The Authors.
Figures

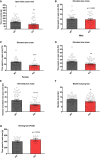
Ultrasonic vocalizations (USV) in isolated miR379‐410 ko mouse pups emitted on postnatal day P3, P6, P9 and P12. Left panel: total number of ultrasonic vocalizations (USV) in isolated miR379‐410 wt and ko mouse pups emitted on average (P 3, 6, 9 and 12) when isolated from the mother, wt n = 13 (male n = 9, female n = 4), ko n = 20 (male n = 11, female n = 9), t 31 = 2.274, *P = 0.0301, unpaired Student's t‐test. Right panel: developmental course for total number of USV, wt n = 13 (male n = 9, female n = 4), ko n = 20 (male n = 11, female n = 9; development: F 3,87 = 25.463, P < 0.001; genotype: F 1,29 = 4.979, P = 0.03; development × genotype: F 3,87 = 1.403, P = 0.22, rm‐ANOVA); P 9: t 31 = 2.096, *P = 0.044, unpaired Student's t‐test.
Reciprocal social interaction in juvenile miR379‐410 wt and ko mice pairs (P23). Aberrant time spending in social interaction activity in miR379‐410 ko pairs compared to their control wt littermate pairs. Left panel: wt pairs n = 13 (male), ko pairs n = 10 (male), t 21 = 2.433, *P = 0.0240, unpaired Student's t‐test. Middle panel: wt pairs n = 15 (female), ko pairs n = 13 (female), t 26 = 1.873, ns P = 0.0723, unpaired Student's t‐test. Right panel: pooled data of wt pairs n = 28 (male n = 13 and female n = 15), ko pairs n = 23 (male n = 10 and female n = 13), t 49 = 2.969, **P = 0.005, unpaired Student's t‐test.
Emitted USVs during social interaction activity in genotype‐matched pairs in juvenile mice (P23). Left panel: wt pairs n = 13 (male), ko pairs n = 15 (male), t 21 = 2.704, *P = 0.0133, unpaired Student's t‐test. Middle panel: wt pairs n = 15 (female), ko pairs n = 13 (female), t 26 = 2.869, **P = 0.0081, unpaired Student's t‐test. Right panel: pooled data of wt pairs n = 28 (male n = 13 and female n = 15), ko pairs n = 23 (male n = 10 and female n = 13), t 49 = 3.992, ***P < 0.001, unpaired Student's t‐test.
Social preference index in adolescent mice—defined as the ratio of time sniffing a stranger mouse vs. an object—is shown. Left panel: wt n = 26 (male), ko n = 26 (male), t 50 = 1.075, ns P = 0.2876, unpaired Student's t‐test. Middle panel: wt n = 27 (female), ko n = 30 (female), t 55 = 2.017, *P = 0.0486, unpaired Student's t‐test. Right panel: pooled data of wt n = 53 (male n = 26 and female n = 27), ko n = 56 (male n = 26 and female n = 30), t 107 = 2.283, *P = 0.0244, unpaired Student's t‐test.

- A
Open field test in adult mice. Time spent in the central arena was examined, wt n = 51 (male n = 24 and female n = 27), ko n = 53 (male n = 24 and female n = 29), t 102 = 3.020, **P = 0.0032, unpaired Student's t‐test.
- B–E
Elevated plus maze test in adult mice. (B) Time spent on open arms (percentage) are shown, wt n = 24 (male), ko n = 24 (male), t 46 = 0.5419, ns P = 0.5905. unpaired Student's t‐test. (C) Time spent on open arms (percentage) is shown, wt n = 27 (female), ko n = 29 (female), t 54 = 4.099, ***P < 0.001, unpaired Student's t‐test. (D) Time spent on open arms (percentage) is shown for pooled data of male and female; wt n = 51 (male n = 24 and female n = 27), ko n = 53 (male n = 24 and female n = 29), t 102 = 3.265, **P = 0.0015, unpaired Student's t‐test. Please notice that the genotype effect is mainly in females (P < 0.001) but not in males (P = 0.5905); Genotype × Sex: F 1,100 = 5.551, P = 0.020, ANOVA. (E) Number of open arm entries is shown; wt n = 51 (male n = 24 and female n = 27), ko n = 53 (male n = 24 and female n = 29), t 102 = 4.679, ****P < 0.0001, unpaired Student's t‐test.
- F
Marble burying test as a measure for repetitive behaviour. Total number of marbles (half and completely) buried by adult miR379‐410 wt and ko mice is shown; wt n = 49 (male n = 23 and female n = 26), ko n = 53 (male n = 24 and female n = 29), t 100 = 2.569, *P = 0.0117, unpaired Student's t‐test.
- G
Pup homing test performed at P9 during developmental milestones. Time spent in the nest area (containing nest litter) is shown, wt n = 17 (male n = 8 and female n = 9); ko n = 11 (male n = 5 and female n = 6), t 26 = 0.9834, ns P = 0.3345, unpaired Student's t‐test.

- A, B
Single‐molecule FISH (smFISH) on mouse hippocampal neurons. (A) Representative pictures of smFISH on BDNF‐treated WT (top) and KO (bottom) mouse hippocampal neurons (DIV6) using a probe directed against the Mirg transcript (green). (Middle) Hoechst (blue). (Right) MAP2 immunostaining (red). Pictures show a zoom‐in on the cell body, since the signal detected in WT neurons was restricted to the nuclei (scale bar: 5 μm). (B) Representative pictures of smFISH on mouse wild‐type hippocampal neuron cultures (DIV6; basal) using a probe specific for the Mirg transcript (green). (Middle) Hoechst (blue). (Right) MAP2 immunostaining (red). Top: overview, scale bar: 10 μm; bottom: zoom‐in, scale bar: 5 μm.
- C, D
Patch‐clamp electrophysiological recordings in cultured mouse hippocampal neurons (DIV 8–10) isolated from wt or miR379‐410 ko animals (n = 3 per group). (C) Cumulative distribution (left panel, D = 0.25, P < 0.0001, KS test) and mean (right panel, t 16 = 2.736, *P = 0.0146, unpaired Student's t‐test) of mEPSC inter‐event intervals; wt n = 9, ko n = 9 cells analysed. (D) Cumulative distribution (left panel, D = 0.34741, P < 0.0001, KS test) and mean (right panel, t 18 = 2.357, *P = 0.0299, unpaired Student's t‐test) of mEPSC amplitudes; wt n = 10, ko n = 10 cells analysed.
- E
Representative confocal images of CA1 pyramidal neuron apical dendrites from adult Thy1‐GFP/miR379‐410 wt and Thy1‐GFP/miR379‐410 ko mouse tissue. Scale bar: 10 μm.
- F
Spine density in CA1 pyramidal neurons of adult male Thy1‐GFP/miR379‐410 wt and ko mice; wt n = 5, ko n = 6 animals. Mean of basal and apical neurons per mouse is shown, t 9 = 3.662, **P = 0.0052, unpaired Student's t‐test.
- G
Spine volume in CA1 pyramidal neurons of adult Thy1‐GFP/miR379‐410 wt and ko mice; wt n = 5, ko n = 6 animals. Mean of basal and apical neurons per mouse is shown, t 9 = 2.265, *P = 0.0497, unpaired Student's t‐test.

Expression of precursor miRNAs in hippocampal neonatal (P1) miR379‐410 wt/ko pups: pre‐miR‐124 (wt n = 5, ko n = 5, t 8 = 0.5848, ns P = 0.5748), pre‐miR‐132 (wt n = 5, ko n = 5, t 8 = 0.8740, ns P = 0.4076), pre‐miR‐137 (wt n = 5, ko n = 5, t 8 = 5.037, **P = 0.0010), pre‐miR‐138.2 (wt n = 5, ko n = 5, t 8 = 0.4145, ns P = 0.6894) and from the miR379‐410 cluster pre‐miR‐134 (wt n = 5, ko n = 5, t 8 = 7.637, ****P < 0.0001), unpaired Student's t‐test.
Expression of precursor miRNAs in hippocampal juvenile (P14) miR379‐410 wt/ko mice: pre‐miR‐124 (wt n = 4, ko n = 4, t 6 = 1.406, ns P = 0.2093), pre‐miR‐132 (wt n = 4, ko n = 4, t 6 = 0.5348, ns P = 0.6120), pre‐miR‐137 (wt n = 4, ko n = 4, t 6 = 1.250, ns P = 0.2578), pre‐miR‐138.2 (wt n = 4, ko n = 3, t 5 = 0.9339, ns P = 0.3932) and from the miR379‐410 cluster pre‐miR‐134 (wt n = 4, ko n = 4, t 6 = 3.150, *P = 0.0198); unpaired Student's t‐test.
Expression of mature miRNAs in cerebellum of adult miR379‐410 wt/ko mice: miR‐124 (wt n = 5, ko n = 4, t 7 = 1.214, ns P = 0.2642), miR‐132 (wt n = 5, ko n = 4, t 7 = 1.382, ns P = 0.2095), miR‐138 (wt n = 5, ko n = 4, t 7 = 1.089, ns P = 0.3120) and from the miR379‐410 cluster miR‐329 (wt n = 3, ko n = 2, t 3 = 7.720, **P = 0.0045); unpaired Student's t‐test.
Expression of precursor miRNAs in cerebellum of adult miR379‐410 wt/ko mice: pre‐miR‐124 (wt n = 3, ko n = 2, t 3 = 0.8014, ns P = 0.4815), pre‐miR‐137 (wt n = 3, ko n = 2, t 3 = 0.8107, ns P = 0.4769), pre‐miR‐138.2 (wt n = 3, ko n = 2, t 3 = 0.5169, ns P = 0.6409) and from the miR379‐410 cluster pre‐miR‐369 (wt n = 3, ko n = 2, t 3 = 16.78, ***P = 0.0005); unpaired Student's t‐test. Data are presented as mean ± s.e.m.

RNAseq differentially expressed gene (DEG) analysis in the adult hippocampus of miR379‐410 ko and wt mice. Upregulated (green) and downregulated (blue) DEGs are indicated by average changes in mRNA levels (ko/wt; log2) (n = 3; q‐values represent FDR‐corrected P‐values; q < 0.05); 2,170/898 genes were significantly up‐ and downregulated in miR379‐410 mice, respectively.
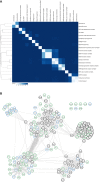
GO term enrichment analysis of DEG reveals several synaptic cellular components (highlighted in grey). Green and blue bars indicate the percentage of significantly up‐ and downregulated genes associated with specific GO terms, respectively. GO terms with more than 300 annotated genes are not shown.
String database protein–protein interaction network. The network is built including String‐DB parameters Experiments, Databases and Textmining. Clusters associated with synaptic transmission are enlarged (for the complete network, see Fig EV3B). Green and blue borders indicate significantly up‐ and downregulated genes, respectively.
Enrichment analysis of cluster miRNA binding motifs (TargetScan v7.1). miRNAs overrepresented in differentially expressed (DE) transcripts are highlighted in green and blue, respectively. Shown is the natural logarithm (ln) of the wt/ko ratio of binding sites in DE transcripts. Bubble sizes correspond to RPM values in the mouse brain.

Binary distance matrix of detected GO terms (cellular component). Hierarchical clustering has been performed by the unweighted pair group method with arithmetic mean. GO terms with more than 300 annotated genes are not shown.
Complete String database protein–protein interaction network.

miRNAs of the miR379‐410 cluster sharing similar seed regions: miR485‐5p/miR‐134‐5p and miR‐377‐3p/miR‐329‐3p. Seed regions (nucleotide 2–8) are highlighted in bigger letters, conserved nucleotides in red and those that allow wobble base pairing in blue.
3′UTR luciferase reporter gene assays in cultured rat cortical neurons using the Prr7 3′UTR reporter gene (wt or seed mutant) together with miR‐495 or control mimic, respectively (n = 3 per group; wt: P = 0.7775; mut: P = 0.7797; mimic: F 1,8 = 1.816, P = 0.2147; utr‐construct: F 1,8 = 2.973, P = 0.1229; mimic × utr‐construct: F 1,8 = 9.47e‐006, P = 0.09976); two‐way ANOVA.
3′UTR luciferase reporter gene assays in cultured rat cortical neurons using the Dlgap3 3′UTR reporter gene (wt or seed mutant) together with miR‐299 or control mimic, respectively (n = 5 per group; wt: P = 0.0549; mut: P = 0.8982; mimic: F 1,16 = 6.145, P = 0.0247; utr‐construct: F 1,16 = 0.005108, P = 0.9434; mimic × utr‐construct: F 1,16 = 2.246, P = 0.1534); two‐way ANOVA.
3′UTR luciferase reporter gene assays in cultured rat hippocampal neurons using the Dlgap3 3′UTR reporter gene (wt or seed mutant) after 48 h PTX stimulation (n = 5 per group, t 8 = 4.397, **P = 0.0023); unpaired Student's t‐test.

- A
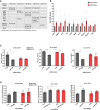
List of synaptic targets among DEG containing conserved binding sites (human and mouse) for indicated miRNAs based on TargetScan v7.1. Category of binding site from TargetScan (v7.1) is shown in brackets.
- B
qPCR validation of predicted direct miR379‐410 targets using RNA from hippocampi of juvenile (P 22–24) mice, except of Shank3 where adult miR‐379‐410 wt and ko animals were measured. If not indicated, both male and female samples were used. Cnih2 (wt n = 12, ko n = 9, t 19 = 2.344, *P = 0.0301), Dlgap3 (wt n = 12, ko n = 9, t 19 = 2.128, *P = 0.0467), Prr7 (male wt n = 7, ko n = 4, t 9 = 2.719, *P = 0.0236), Src (wt n = 12, ko n = 9, t 19 = 2.410, *P = 0.0263), Lzts2 (male wt n = 7, ko n = 4, t 9 = 2.554, *P = 0.0310), Mpp2 (male wt n = 7, ko n = 4, t 9 = 2.369, *P = 0.0420), Prr12 (wt n = 6, ko n = 4, t 8 = 2.375, *P = 0.0449), Shank1 (wt n = 11, ko n = 9, t 18 = 2.310, *P = 0.0329), Shb (male wt n = 6, ko n = 4, t 8 = 3.451, **P = 0.0087) and Shank3 (adult male wt n = 3, ko n = 5, t 6 = 2.538, *P = 0.0442), unpaired Student's t‐test. Data are presented as mean ± s.e.m.
- C, D
Cnih2, Prr7 and Src are direct miR‐379‐410 target mRNAs. (C) 3′UTR luciferase reporter gene assays in cultured rat cortical neurons using the indicated 3′UTR reporter genes (wt or seed mutant) together with miRNA mimics. Cnih2 (n = 3 per group; wt: **P = 0.0020, mut: P = 0.9267; mimic: F 1,8 = 19.92, P = 0.0021; utr‐construct: F 1,8 = 4.760, P = 0.0607; mimic × utr‐construct: F 1,8 = 12.99, P = 0.0069), Prr7 (n = 3 per group; wt: ****P < 0.0001, mut: *P = 0.0103; wt vs. mut mimic miR329: **P = 0.0014; mimic: F 1,8 = 153.1, P < 0.0001; utr‐construct: F 1,8 = 5.631, P = 0.0450; mimic × utr‐construct: F 1,8 = 38.54, P = 0.0003); Src (n = 3 per group; wt: *P = 0.0110, mut: P = 0.4724; mimic: F 1,8 = 16.99, P = 0.0033; utr‐construct: F 1,8 = 0.6809, P = 0.4332; mimic vs. utr‐construct: F 1,8 = 3.920, P = 0.0831); two‐way ANOVA. (D) Same as in (C), but in the presence of anti‐miRs (pLNAs) in hippocampal neurons after 48 h of PTX stimulation. Cnih2 (n = 4 per group; wt: P = 0.2688; mut: P = 0.8668; wt ctr vs. mut ctr: P = 0.6463; anti‐miRNA: F 1,12 = 3.629, P = 0.0810; utr‐construct: F 1,12 = 0.7407, P = 0.4063; anti‐miRNA × utr‐construct: F 1,12 = 0.6679, P = 0.4297), Prr7 (n = 4 per group; wt: *P = 0.0123; mut: P = 0.9917; wt ctr vs. mut ctr: *P = 0.0152; anti‐miRNA: F 1,12 = 6.082, P = 0.0297; utr‐construct: F 1,12 = 5.271; P = 0.0405; anti‐miRNA × utr‐construct: F 1,12 = 8.212, P = 0.0142); Src (n = 3 per group; wt: *P = 0.0370; mut: P = 0.3540; wt ctr vs. mut ctr: P = 0.9906; anti‐miRNA: F 1,12 = 13.43, P = 0.0064; utr‐construct: F 1,12 = 0.5672, P = 0.4730; anti‐miRNA x utr‐construct: F 1,12 = 1.362, P = 0.2768), two‐way ANOVA. Data are presented as mean ± s.d.

- A
Average fold change in ko relative to wt animals is presented (wt = 1, not shown), Cnih2 (wt n = 6, ko n = 6, P = 0.4625), Prr7 (wt n = 7, ko = 8, P = 0.0311), one‐sample t‐test (2.3 test in excel). Data are presented as mean ± s.d.
- B, C
Representative Western blots of Cnih2 and Prr7 protein expression in hippocampus of juvenile mice.
Comment in
-
Small RNA regulators of social behaviour in eutherian mammals.EMBO Rep. 2019 Feb;20(2):e47663. doi: 10.15252/embr.201947663. Epub 2019 Jan 23. EMBO Rep. 2019. PMID: 30674540 Free PMC article.
References
Publication types
MeSH terms
Substances
LinkOut - more resources
Full Text Sources
Molecular Biology Databases
Miscellaneous

