

The key protein of endosomal mRNP transport Rrm4 binds translational landmark sites of cargo mRNAs
- PMID: 30552148
- PMCID: PMC6322384
- DOI: 10.15252/embr.201846588
The key protein of endosomal mRNP transport Rrm4 binds translational landmark sites of cargo mRNAs
Abstract
RNA-binding proteins (RBPs) determine spatiotemporal gene expression by mediating active transport and local translation of cargo mRNAs. Here, we cast a transcriptome-wide view on the transported mRNAs and cognate RBP binding sites during endosomal messenger ribonucleoprotein (mRNP) transport in Ustilago maydis Using individual-nucleotide resolution UV crosslinking and immunoprecipitation (iCLIP), we compare the key transport RBP Rrm4 and the newly identified endosomal mRNP component Grp1 that is crucial to coordinate hyphal growth. Both RBPs bind predominantly in the 3' untranslated region of thousands of shared cargo mRNAs, often in close proximity. Intriguingly, Rrm4 precisely binds at stop codons, which constitute landmark sites of translation, suggesting an intimate connection of mRNA transport and translation. Towards uncovering the code of recognition, we identify UAUG as specific binding motif of Rrm4 that is bound by its third RRM domain. Altogether, we provide first insights into the positional organisation of co-localising RBPs on individual cargo mRNAs.
Keywords: iCLIP; RNA transport; endosome; fungus.
© 2018 The Authors.
Figures
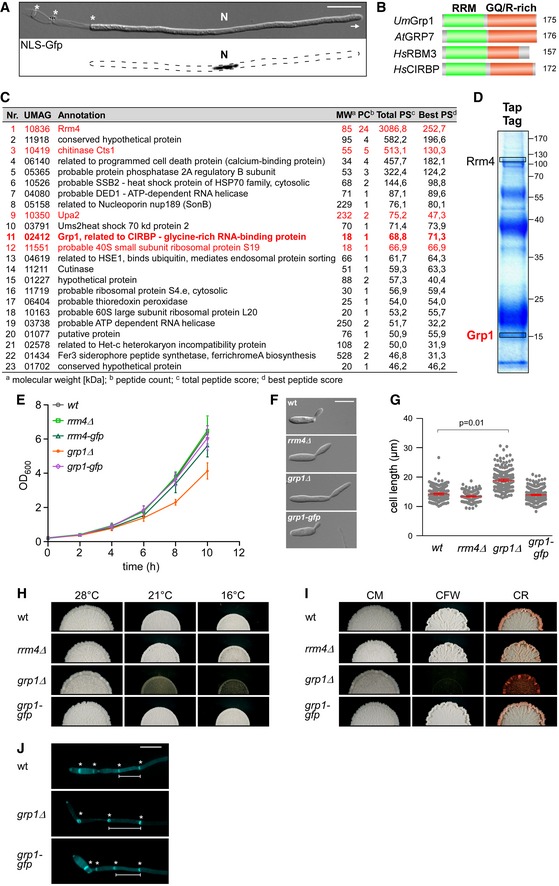
Hyphal form (6 hours post‐induction, h.p.i.) of laboratory strain AB33 expressing a Gfp‐tagged protein with nuclear localisation signal to stain the nucleus (N; λN‐NLS‐Gfp, phage protein λN fused to triple Gfp, containing a nuclear localisation signal; inverted fluorescence image shown; scale bar, 10 μm). Hyphae expand at the apical pole (arrow) and insert septa (asterisks) at the basal pole in regular time intervals resulting in the formation of empty sections.
Schematic representation of the domain architecture of four small glycine‐rich proteins (RRM, RNA recognition motif, green; GQ/R, glycine‐rich region with arginine or glutamine, red). UmGrp1 from U. maydis (UMAG_02412), AtGRP7 from Arabidopsis thaliana (RBG7; NC_003071.7), HsRBM3 and HsCIRBP from Homo sapiens (NC_000023.11 and NC_000019.10, respectively). Number of amino acids indicated on the right.
Results of preliminary affinity purification experiments using Rrm4‐GfpTT as bait (see Materials and Methods). Proteins with a functional link to Rrm4 are marked in red (this study) 18, 64. Peptide count: number of identified peptides corresponding to predicted protein; total peptide score: sum of all peptide scores corresponding to predicted protein, excluding the scores of duplicate matches; best peptide score: best score from all identified peptides corresponding to predicted protein. Note that the difference between total peptide score and best peptide score is a correction of the software depending on how many possible predicted candidates match to the identified peptide mass.
Tandem affinity purification using Rrm4‐GfpTT as bait. Protein bands were stained with Coomassie blue after SDS–PAGE. Proteins in boxed areas were identified as Rrm4 and Grp1 (size of marker proteins in kDa on the right).
Growth curve of indicated AB33 derivatives growing in liquid culture. Data points represent averages from three independent experiments (n = 3). Error bars show s.d.
Differential interference contrast (DIC) images of AB33 derivatives as yeast‐like budding cells (scale bar, 10 μm).
Length of budding cells (shown are merged data from three independent experiments, n = 3; > 100 cells per strain were analysed, wt, 269; rrm4Δ, 122 (only two independent experiments); grp1Δ, 263; grp1G, 318), overlaid with the mean of means, red line and s.e.m.; paired two‐tailed Student's t‐test on the mean cell lengths from the replicate experiments.
Colonies of indicated AB33 strains grown in the yeast form incubated at different temperatures (28°C for 1 day or 16°C and 21°C for 5 days).
Colonies of indicated AB33 strains grown in the yeast form. Incubated plates contained cell wall inhibitors (CM, complete medium for 1 day; CFW, 50 μM calcofluor‐white for 4 days; CR, 57.4 μM Congo red for 4 days).
Fluorescence images of the basal pole of hyphae of AB33 derivatives (6 h.p.i.). Septa (asterisks) were stained with CFW. White bars indicate exemplary length measurements of empty sections shown in Fig 1D (scale bar, 10 μm).
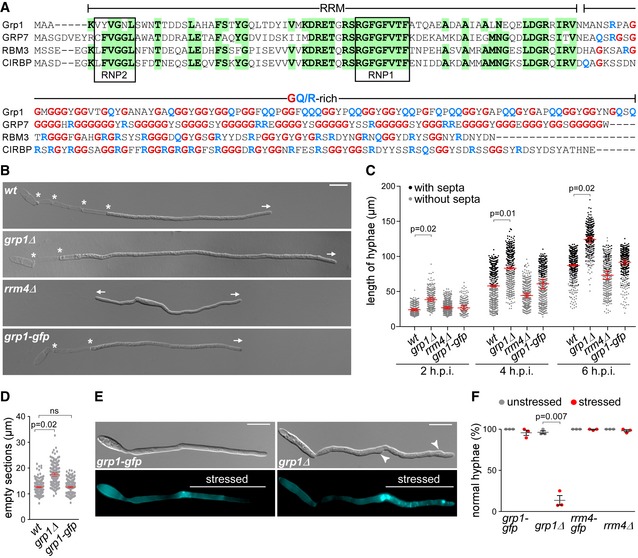
Sequence alignment of glycine‐rich proteins (Fig EV1B). UmGrp1 from U. maydis (UMAG_02412), AtGRP7 (RBG7) from A. thaliana (NC_003071.7), HsRBM3 and HsCIRBP from H. sapiens (NC_000023.11 and NC_000019.10, respectively). Amino acid positions within RRM that are identical in at least three proteins are highlighted in green (boxes indicate RNA contact regions RNP1 and RNP2). Glycine and arginine/glutamine residues in the glycine‐rich region are labelled in red and blue, respectively.
Hyphae of AB33 derivatives (6 h.p.i.). Growth direction and basal septa are marked by arrows and asterisks, respectively (scale bar, 10 μm).
Hyphal length over time. Black and grey dots represent hyphae with and without septa, respectively. Shown are merged data (> 200 hyphae per strain) from three independent experiments, overlaid with the mean of means, red line and standard error of the mean (s.e.m.). Significance was assessed using paired two‐tailed Student's t‐test on the mean hyphal lengths from the replicate experiments, followed by multiple testing correction (Benjamini–Hochberg). Significant P‐values (P < 0.05) for comparison against wild type within each time point are indicated above.
Length of empty sections (see Fig EV1J). Merged data from three independent experiments are shown together, overlaid with mean of means, red line and s.e.m. (total hyphae analysed: wt, 250; grp1Δ, 190; grp1‐gfp, 332; difference in means between wt and grp1‐gfp was statistically not significant, ns, P = 0.95; paired two‐tailed Student's t‐test on the mean lengths from the replicate experiments (n = 3).
Differential interference contrast (DIC, top) and fluorescence images (bottom) of AB33 hyphae (5 h.p.i.) stressed at 3 h.p.i. with cell wall inhibitor CFW (2.5 μM). Arrowheads indicate aberrant cell wall deformation (scale bar, 10 μm).
Percentage of hyphae with normal cell walls with (stressed) and without (unstressed) CFW treatment (data points represent percentages of three independent experiments, n = 3; mean, dark grey lines and standard error of the mean, s.e.m., > 100 hyphae analysed per experiment; paired two‐tailed Student's t‐test on the means).
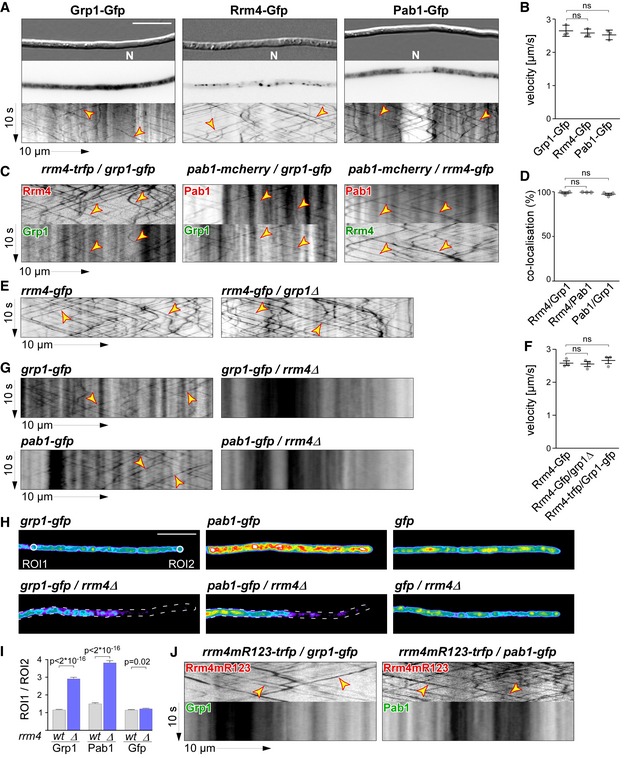
Micrographs (DIC and inverted fluorescence image; scale bar, 10 μm) and corresponding kymographs of AB33 hyphae (6 h.p.i.) expressing Grp1‐Gfp, Rrm4‐Gfp or Pab1‐Gfp (arrow length on the left and bottom indicates time and distance, 10 s and 10 μm, respectively). To visualise directed movement of signals (distance over time) within a series of images, kymographs were generated by plotting the position of signals along a defined path (x‐axis) for each frame of the corresponding video (y‐axis). Bidirectional movement is visible as diagonal lines (yellow arrowheads; N, nucleus; Video EV1). For an example image of a complete AB33 hypha, see Fig EV1A.
Average velocity of fluorescent signals per hypha for strains shown in (A) (movement of tracks with > 5 μm was scored as processive). Data points represent averages from three independent experiments (n = 3), with mean, red line and s.e.m. At least 20 signals/hyphae were analysed out of 12 hyphae per experiment (ns; P = 0.18 and P = 0.23) using a paired two‐tailed Student's t‐test on the means.
Kymographs of hyphae of AB33 derivatives (6 h.p.i.) expressing pairs of red and green fluorescent proteins as indicated. Fluorescence signals were detected simultaneously using dual‐view technology (arrow length as in A). Processive co‐localising signals are marked by yellow arrowheads (Videos EV2, EV3 and EV4).
Percentage of red fluorescent signals exhibiting co‐localisation with the green fluorescent signal for strains shown in (C). Data points represent observed co‐localisation in three independent experiments, mean, dark grey line and s.e.m. (n = 3, 11 hyphae each; paired two‐tailed Student's t‐test on the means; ns; P = 0.63 and P = 0.5).
Kymographs comparing hyphae of AB33 derivatives (6 h.p.i.) expressing Rrm4‐Gfp in the wild type (left) or grp1Δ strains (right) (processive signals marked by yellow arrowheads; arrow length on the left and bottom indicates time and distance, 10 s and 10 μm, respectively; Video EV5).
Average velocity of fluorescent signals per hyphae for strains shown in (E) (movement of tracks with > 5 μm were scored as processive). Data points represent averages from three independent experiments (n = 3) with mean, black line and s.e.m. At least 20 signals/hypha were analysed out of at least 10 hyphae per experiment (ns; P = 0.27 and P = 0.4) using a paired two‐tailed Student's t‐test on the means.
Kymographs comparing hyphae (6 h.p.i.) expressing Grp1‐Gfp or Pab1‐Gfp in wild type (left) with rrm4Δ strains (right; processive signals marked by yellow arrowheads; arrow length as in A).
Hyphal tips (4 h.p.i.) of AB33 derivatives expressing Grp1‐Gfp, Pab1‐Gfp or Gfp alone comparing wild type (top) with rrm4Δ strains (bottom). Fluorescence micrographs in false colours (black/blue to red/white, low to high intensities, respectively; scale bar, 10 μm; ROI1 and ROI2‐labelled circles exemplarily indicate regions of interest analysed in E).
Ratio of signal intensities in strains shown in (H) comparing Gfp fluorescence at the tip (ROI1) and in close vicinity to the nucleus (ROI2; see Materials and Methods). Bars represent mean and s.e.m. (wt: n = 160; rrm4Δ: n = 152), Pab1G (n = 126; rrm4Δ: n = 170), Gfp (n = 152; rrm4Δ: n = 210), unpaired two‐tailed Student's t‐test.
Kymographs of hyphae of AB33 derivatives (6 h.p.i.) expressing pairs of red and green fluorescent proteins as indicated (arrow length as in A; Videos EV6 and EV7). Fluorescence signals were detected simultaneously using dual‐view technology. Processive co‐localising signals are marked by yellow arrowheads. Note that processive movement is completely lost in the lower panels. Only static signals, visualised as vertical lines, are remaining.
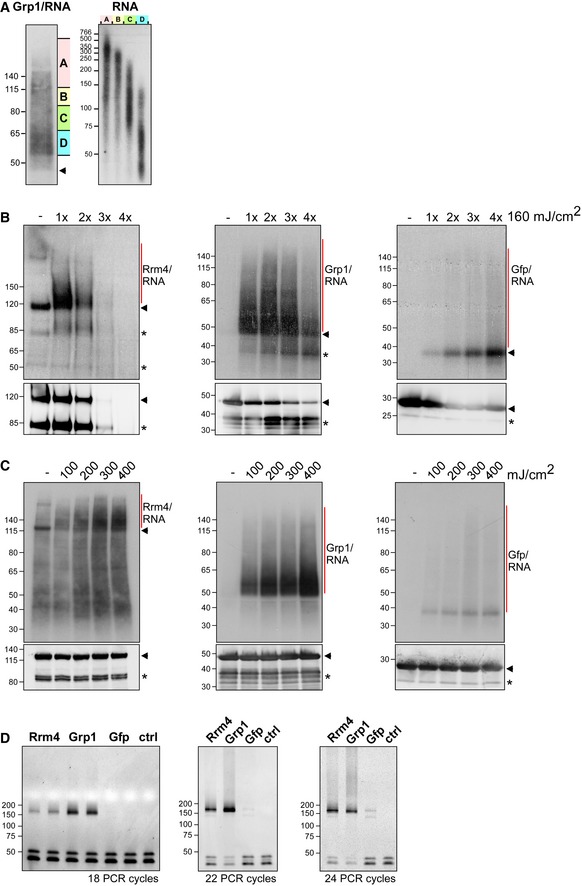
Grp1‐Gfp/RNA complexes were size‐separated on denaturing PAGE after UV‐C irradiation and transferred to a nitrocellulose membrane (left). RNA was radioactively labelled, and protein‐RNA complexes with covalently linked RNAs of different sizes were visible as smear above the expected molecular weight of the Grp1‐Gfp protein (45 kDa; marked by arrowhead). RNA of four different regions of the membrane (A–D indicated on the right) were isolated from the membrane and were size‐separated on a denaturing gel (6%) (right; nucleotide size marker on the left, bp).
Autoradiographs showing Rrm4‐Gfp, Grp1‐Gfp and Gfp in complex with RNA after UV‐C irradiation at 0, 160, 320, 480 and 640 mJ/cm2. Corresponding Western blots using anti‐Gfp are shown below. Arrowheads indicate the expected molecular weight of the proteins (Rrm4‐Gfp, 112 kDa; Grp1‐Gfp, 45 kDa; Gfp, 27 kDa). After each irradiation step, the cells were mixed. Note that increased UV‐C irradiation in combination with slow processing due to long time intervals was particularly harmful to the Rrm4 protein, which was completely degraded after four minutes of UV‐C irradiation. Putative degradation products are marked by asterisks.
Autoradiographs showing Rrm4‐Gfp, Grp1‐Gfp and Gfp in complex with RNA after single UV‐C irradiation at 0, 100, 200, 300 or 400 mJ/cm². This time, mixing breaks were omitted and cells were harvested as quickly as possible. Corresponding Western blots are shown below. Labelling as above. We chose 200 mJ/cm2 as optimal UV‐C irradiation dose, since the amount of unspecific Gfp‐RNA complexes increased at higher doses. Arrowheads and asterisks as in (B).
Amplification of the Rrm4‐, Grp1‐ and Gfp‐derived cDNA libraries with different numbers of PCR cycles (between 18 and 24; ctrl, control without template cDNA). The PCR products were separated on a native gel (6%) and stained with SYBR green I (nucleotide size marker on the left, bp). The size of the cDNA insert together with the adapters (cDNA insert = 20–30 nt; L3 adapter, RT‐primer and P3/P5 Solexa primers = 128 nt) is expected to be ˜ 150–160 nt after amplification.
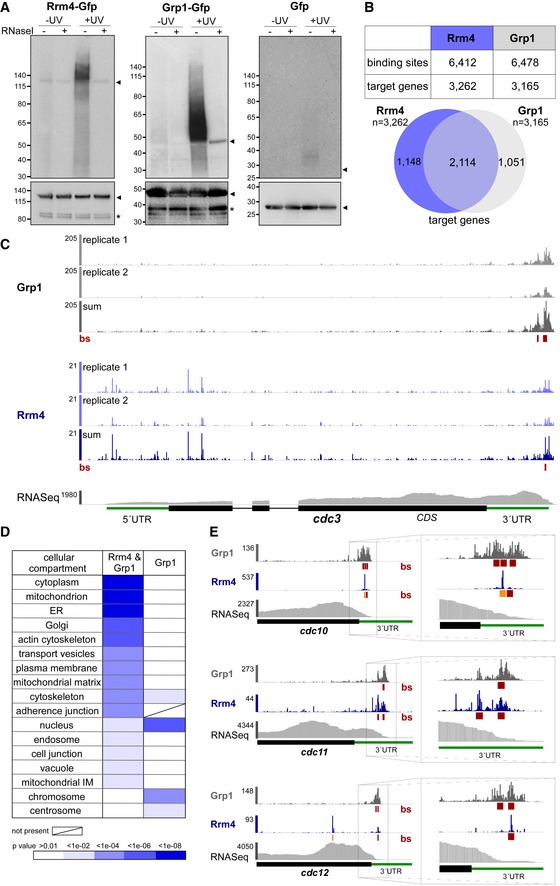
Autoradiograph and Western blot analyses for representative iCLIP experiments with Rrm4‐Gfp, Grp1‐Gfp and Gfp. Upper part: Upon radioactive labelling of co‐purified RNAs, the protein‐RNA complexes were size‐separated in a denaturing polyacrylamide gel. Protein‐RNA complexes are visible as smear above the size of the protein (Rrm4‐Gfp, 112 kDa; Grp1‐Gfp, 45 kDa; Gfp, 27 kDa; indicated by arrowheads on the right). Samples with and without UV‐C irradiation and RNase I (see Materials and Methods) are shown. Lower part: corresponding Western blot analysis using α‐Gfp antibody (arrowheads and asterisks indicate expected protein sizes and putative degradation products, respectively).
Summary of binding sites and target transcripts of Rrm4 and Grp1 (top). Venn diagram (below) illustrates the overlap of Rrm4 and Grp1 target transcripts.
iCLIP data for Rrm4 and Grp1 on cdc3 (UMAG_10503; crosslink events per nucleotide from two experimental replicates [light grey/light blue] and merged data [grey/blue] from AB33 filaments, 6 h.p.i.). Track below the merged iCLIP data shows binding sites for each protein (bs, red). Note that crosslink events in the 5′ UTR and first exon of cdc3 were not assigned as binding sites due to low reproducibility between replicates (see Materials and Methods). RNASeq coverage from wild type AB33 filaments (6 h.p.i.) is shown for comparison. Gene model with exon/intron structure below was extended by 300 nt on either side to account for 5′ and 3′ UTRs (green).
Functional categories of cellular components (FunCat annotation scheme, 78) for proteins encoded by target transcripts that are shared between Rrm4 and Grp1 (left) or unique to Grp1 (right). P‐values for the enrichment of the listed category terms are depicted by colour (see scale below).
iCLIP data (crosslink events from merged replicates) for Rrm4 (blue) and Grp1 (grey) as well as RNASeq coverage on selected target transcripts (cdc10, UMAG_10644; cdc11, UMAG_03449; cdc12, UMAG_03599). Enlarged regions (indicated by boxes) of the 3′ UTR (green) are shown on the right. Datasets and visualisation as in (C). Binding sites (bs) are shown (red; orange indicates overlap with UAUG).
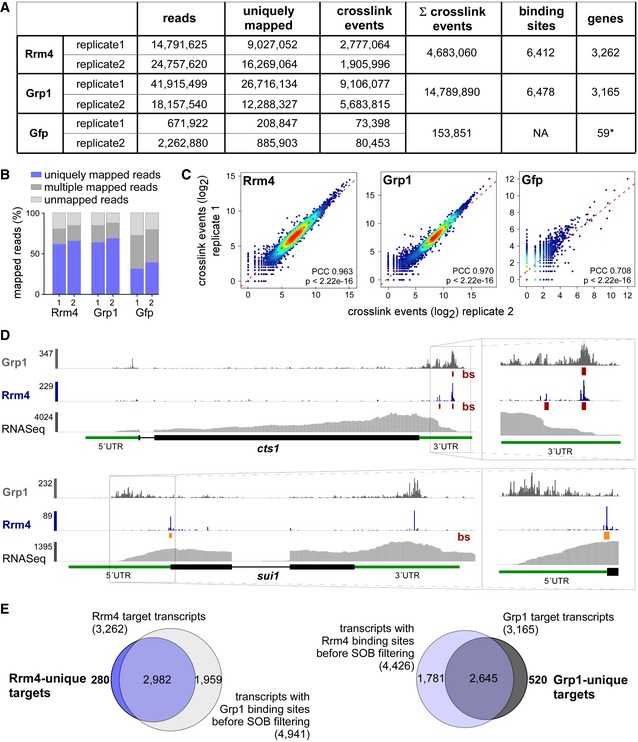
Summary of the iCLIP libraries including initial number of sequencing reads, uniquely mapped reads, crosslink events (xlinks) for both replicates for Rrm4, Grp1 and Gfp. In addition, sum of crosslink events as well as resulting binding sites and target transcripts is given for merged replicates. Gfp binding sites were only filtered for reproducibility but not for relative signal intensity (SOB; see Materials and Methods).
Stacked bar chart showing percentage of reads mapping to a unique, multiple (multiple mapping) or no location (unmapped) in the U. maydis genome for Rrm4, Grp1 and Gfp.
Scatter plot comparing number of crosslink events per gene from two independent replicate experiments for Rrm4, Grp1 and Gfp (PCC, Pearson correlation coefficient).
Genome browser views of Rrm4 and Grp1 iCLIP events as well as RNASeq data of cts1 (UMAG_10419) and rrm4 (UMAG_10836). Visualisation as in Fig 3C.
Venn diagram to identify target transcripts that are uniquely bound by Rrm4 (left) or Grp1 (right). Unique target transcripts (numbers given in bold) are selected only if they show no evidence of binding by the other RBP (considering all binding sites before SOB filtering, see Materials and Methods).
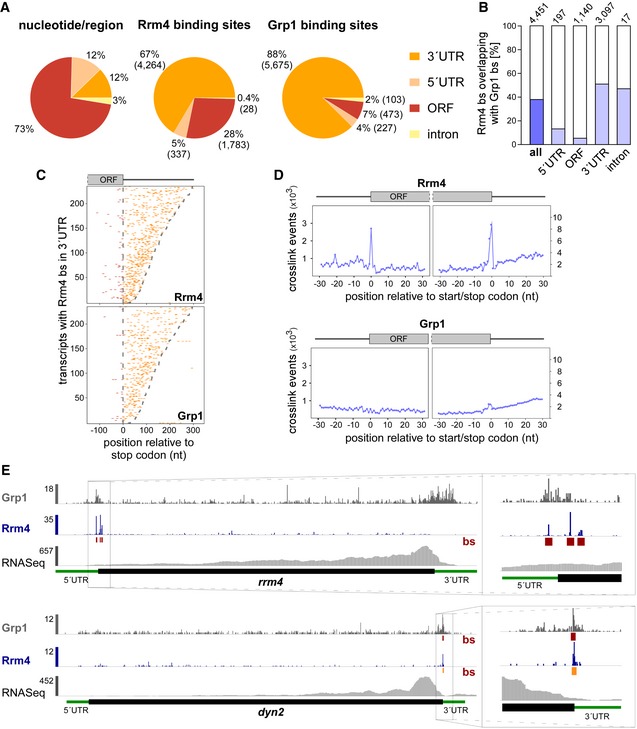
Distribution of binding sites within different transcript regions: 5′ UTR, 3′ UTR, ORF and intron. Percentage and absolute number of binding sites are given for each category. On the left, a transcriptome‐wide distribution of nucleotides per transcript region is shown for comparison.
Percentage of Rrm4 binding sites (bs) overlapping with Grp1 bs (by at least 1 nt) within shared target transcripts, shown for all bs and separated into transcript regions. The total number of binding sites per category is indicated on top.
Positional maps of Rrm4 (top) and Grp1 (bottom) bs relative to the stop codon (position 0). Binding sites in ORFs and 3′ UTR are given in red and orange, respectively. 234 target transcripts were randomly selected carrying an Rrm4 bs in the 3′ UTR (with > 100 Rrm4 crosslink events; out of 1,715 Rrm4/Grp1 shared targets with Rrm4 bs in 3′ UTR; Dataset EV6). Transcripts were ordered by decreasing 3′ UTR length (see Materials and Methods).
Metaprofiles of Rrm4 (top) and Grp1 (bottom) crosslink events relative to the start and stop codons (position 0). Note that crosslink events are substantially more frequent towards ORF ends, reflected in different y‐axis scales.
Genome browser views of Rrm4 and Grp1 iCLIP events as well as RNASeq data of sui1 (UMAG _02665) and dyn2 (UMAG_04372). Visualisation as in Fig 3C.
- A
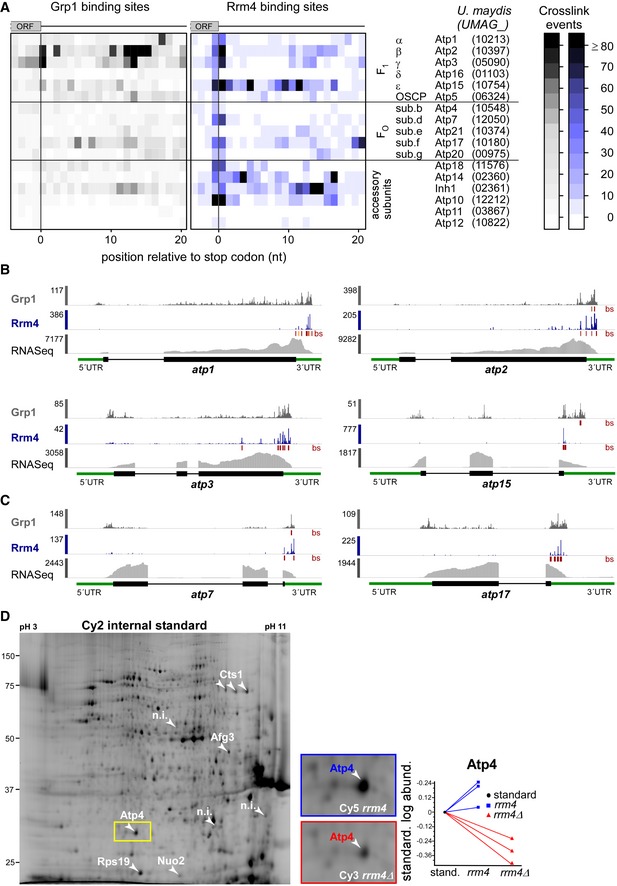
Heatmap of crosslink events of Grp1 (left) and Rrm4 (right) in a window around the stop codons (position 0 = first position of 3′ UTR) of mRNAs encoding subunits of the mitochondrial F1FO‐ATPase (nomenclature and gene identifiers for U. maydis on the right). Crosslink events per nucleotide are represented by a colour scale (right).
- B, C
iCLIP data of Rrm4 and Grp1 as well as RNASeq data across selected mRNAs of the F1 subcomplex (B) and FO subcomplex (C) that carry an Rrm4 binding site precisely at the stop codon. Visualisation as in Fig 3C.
- D
Cy2 image of a representative differential gel electrophoresis (DIGE) analysis comparing membrane‐associated proteins of wild type (blue, Cy5‐labelled) and rrm4Δ hyphae (red, Cy3‐labelled; size marker on the left, pH range at the top; 6 h.p.i.). Protein variants exhibiting at least 2.5‐fold differences in protein amounts are indicated by numbered arrowheads (taken from earlier study) 18. The area marked with a yellow rectangle is enlarged on the right. The corresponding standardised logarithmic protein abundances for the Atp4 spot obtained from three biological replicates are given on the right (internal standard set to 0).

Logo representation of the most enriched sequence motif at Rrm4 binding sites. At each position, the height of the stack is proportional to the information content, while the relative height of each nucleotide within the stack represents its relative frequency at this position.
Frequency of the Rrm4 motif UAUG around Rrm4 and Grp1 binding sites. Shown is the percentage of binding sites that harbour an UAUG starting at a given position in an 81‐nt window around the binding site summit.
Box plot comparing relative binding strength at Rrm4 binding sites (signal‐over‐background, SOB; see Materials and Methods) with or without UAUG (n = 2,201 and n = 4,211, respectively; unpaired Student's t‐test). Box limits represent quartiles, centre lines denote 50th percentiles, and whiskers extend to most extreme values within 1.5× interquartile range.
Schematic representation of the yeast three‐hybrid system: lexA operator (lexA op) sequences are bound by the LexA‐MS2 coat protein (CP) hybrid (grey), recruiting the MS2‐SELEX‐RNA hybrid (black and red, respectively) to the promoter region of the HIS3 reporter gene. Transcription is activated by binding of the third hybrid AD‐Rrm4‐Gfp (green) carrying a Gal4 activation domain (AD).
RNA structure prediction of aptamer SELEX‐A1 with UAUG (red) or the mutated version mUAUG containing UCUC(A) (mutated bases in green).
Colony growth on control and selection plates of yeast cells expressing protein and RNA hybrids indicated on the right. RNA binding is scored by growth on selection plates (SC ‐his +3‐AT, 3‐amino‐1,2,4‐triazole). mRRMx, Rrm4 variants harbouring mutations in RRM1, 2, 3 or 1 and 2.
Percentage of Rrm4 bs containing the motif UAUG, shown for all bs and separated into transcript regions. The total number of binding sites is indicated on top.
Relative contribution of the three stop codon variants to all (left) and Rrm4‐bound stop codons (left). Although opal stop codons (UGA) fit best with a UAUG‐containing binding site (UAUGA; present at 32 out of 63 bound UGA stop codons, 51%), they are depleted from Rrm4‐bound stop codons.
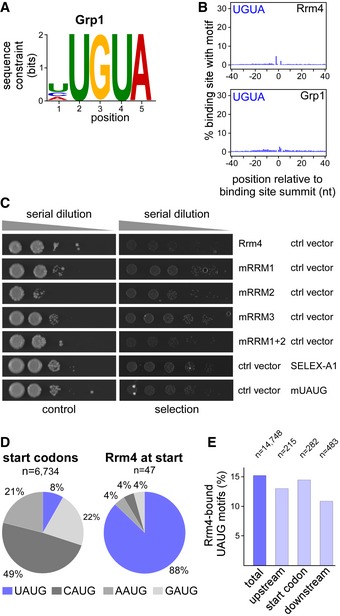
Logo representation of the most enriched sequence motif at Grp1 binding sites. At each position, the height of the stack is proportional to the information content, while the relative height of each nucleotide within the stack represents its relative frequency at this position.
Frequency of UGUA around Rrm4 and Grp1 binding sites. Shown is the percentage of binding sites that harbour an UGUA starting at a given position in an 81‐nt window around the binding site summit. Representation as in Fig 5B.
Colony growth on control and selection plates of yeast cells expressing protein and RNA hybrids indicated on the right. RNA binding is scored by growth on selection plates (SC –his +3‐AT, 3‐amino‐1,2,4‐triazole). This control experiment demonstrates that growth on selection plates (see Fig 5F) depends on the presence of Rrm4 variant and cognate hybrid RNA. mRRMx, Rrm4 variants harbouring mutations in RRM 1, 2, 3 or 1 and 2.
Relative occurrence of NAUG sequence context for all (left) and Rrm4‐bound (right) start codons. CAUG fits to the Kozak sequence in eukaryotes 81. The fraction of start codons coinciding with the Rrm4 recognition motif UAUG is shown in blue. This sequence context was strongly enriched among the Rrm4‐bound target mRNAs, whereas it comprises only 8% of all annotated start codons in the U. maydis genome.
UAUG motifs at start codons were not more frequently bound than UAUG motifs in the surrounding sequence (see Materials and Methods). Out of a total of 14,748 UAUG motifs in expressed transcripts, 15.2% are bound by Rrm4. Similarly, 14.5% of the 282 UAUG motifs directly at start codons are bound by Rrm4. This is only marginally more than at 215 and 483 UAUG motifs within 100‐nt upstream and downstream of the start codons, out of which 13.0% and 11.0% are bound, respectively.
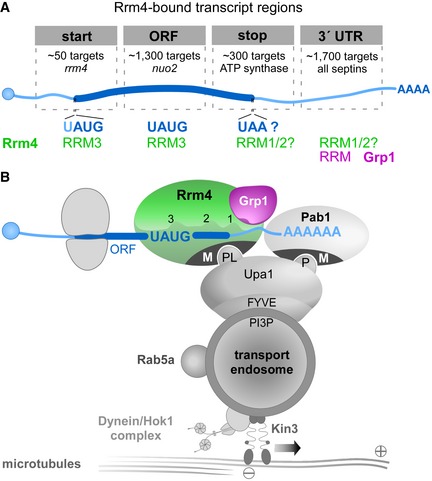
Schematic drawing of target transcript with Rrm4‐bound regions on top (5′ cap structure, blue circle; 5′ and 3′ UTR, light blue; ORF, dark blue; poly(A) tail, AAAA). Different categories of Rrm4 target transcripts were defined according to the presence of Rrm4 binding sites at the start codon, within the ORF, at the stop codon and in the 3′ UTR. Approximate number of target transcripts and selected examples are given for each category. About 900 of 1,300 target transcripts with an Rrm4 binding site in the ORF harbour an UAUG motif within the ORF binding site. Potential RRM domains of Rrm4 and Grp1 that may mediate RNA binding in the different transcript regions are given in green and magenta, respectively.
Simplified model proposing the spatial arrangement of endosomal RBPs with bound target transcripts. The three RRM domains of Rrm4 are schematically displayed and labelled by numbers (FYVE zinc finger domain; PI3P, phosphatidylinositol 3‐phosphate; M, Mademoiselle domain; P and PL, PAM2 and PAM2‐like sequence, respectively; further details, see text). Note that complete endosomal mRNPs will consist of additional mRNA and protein components forming more complex, higher order structures.
References
Publication types
MeSH terms
Substances
LinkOut - more resources
Full Text Sources
Molecular Biology Databases
Miscellaneous
