. 2019 Feb 13;39(7):1261-1274.
doi: 10.1523/JNEUROSCI.2154-18.2018. Epub 2018 Dec 14.

Effects of Positive and Negative Expectations on Human Pain Perception Engage Separate But Interrelated and Dependently Regulated Cerebral Mechanisms

Affiliations

Effects of Positive and Negative Expectations on Human Pain Perception Engage Separate But Interrelated and Dependently Regulated Cerebral Mechanisms

Yao-Wei Shih et al. J Neurosci. .

Abstract

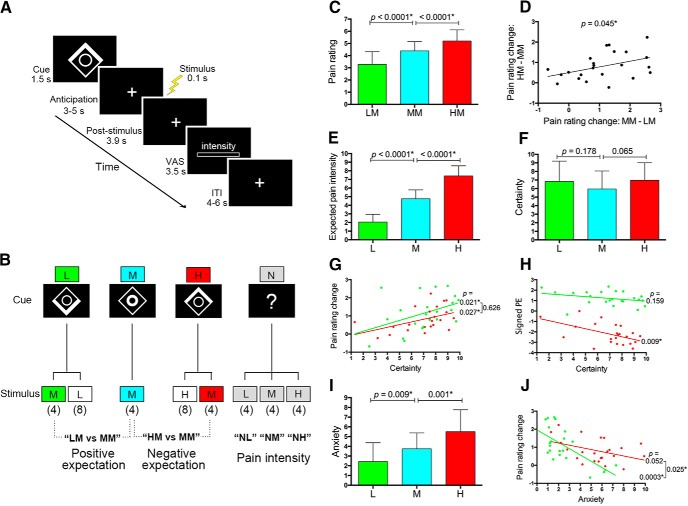
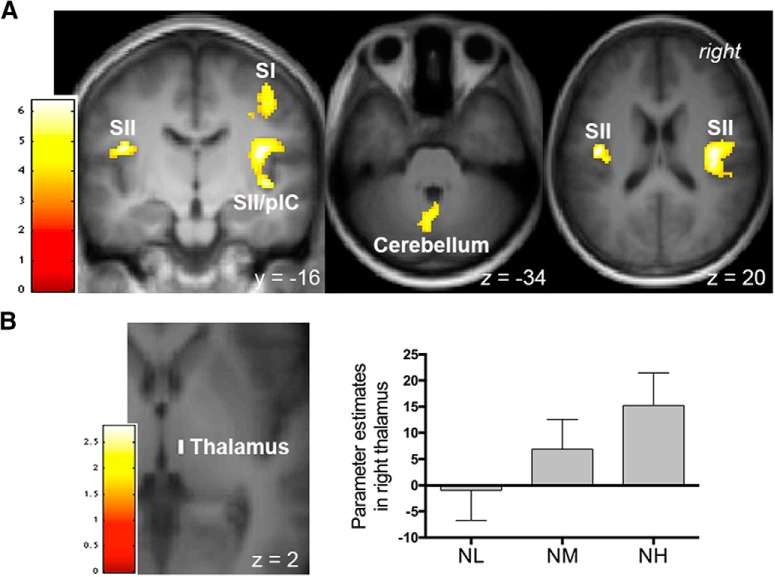
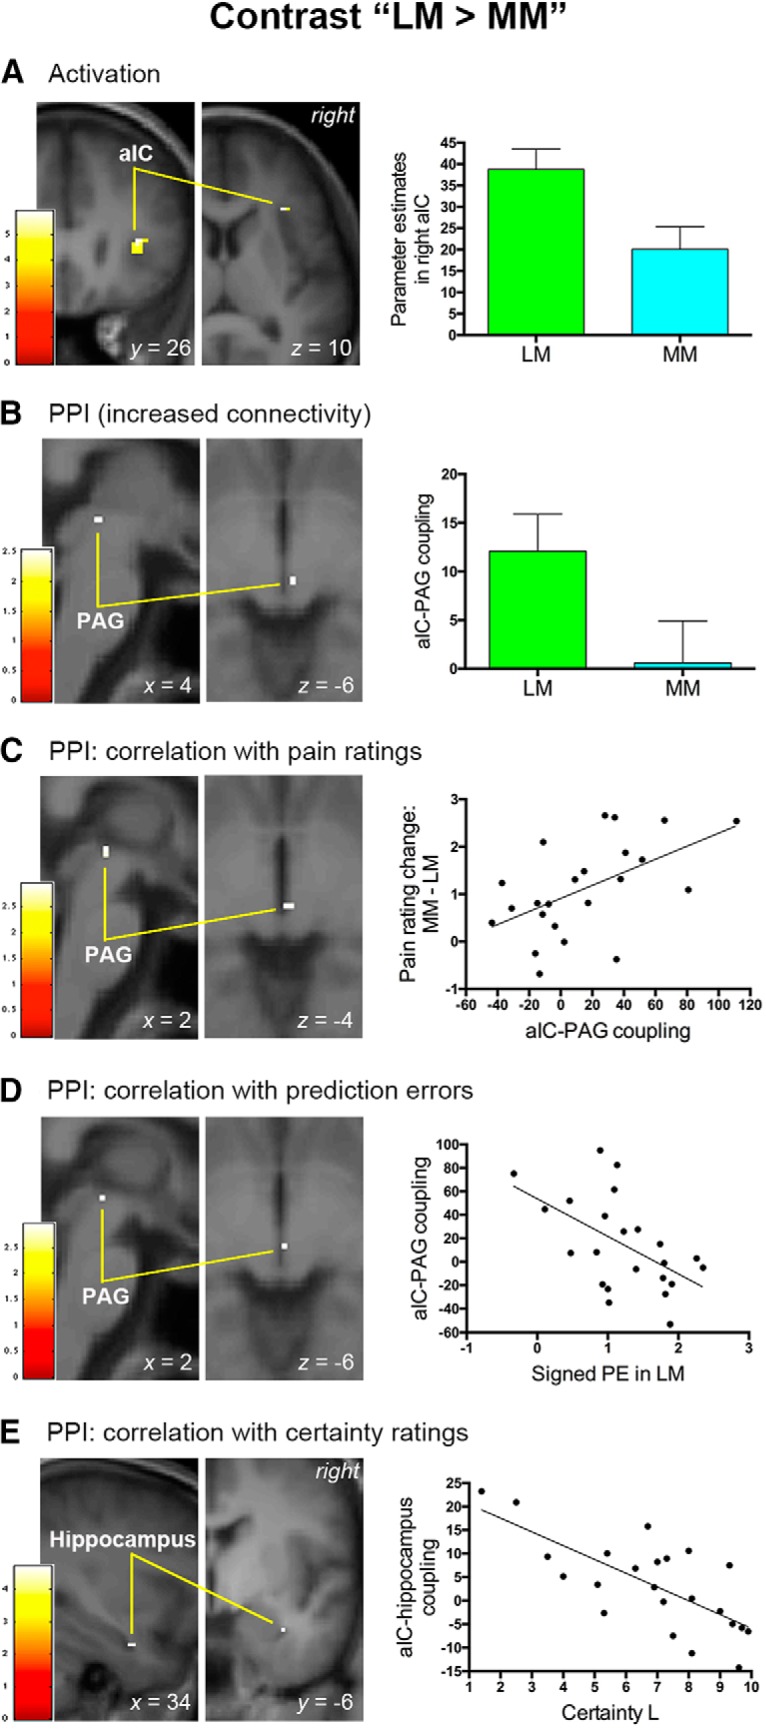
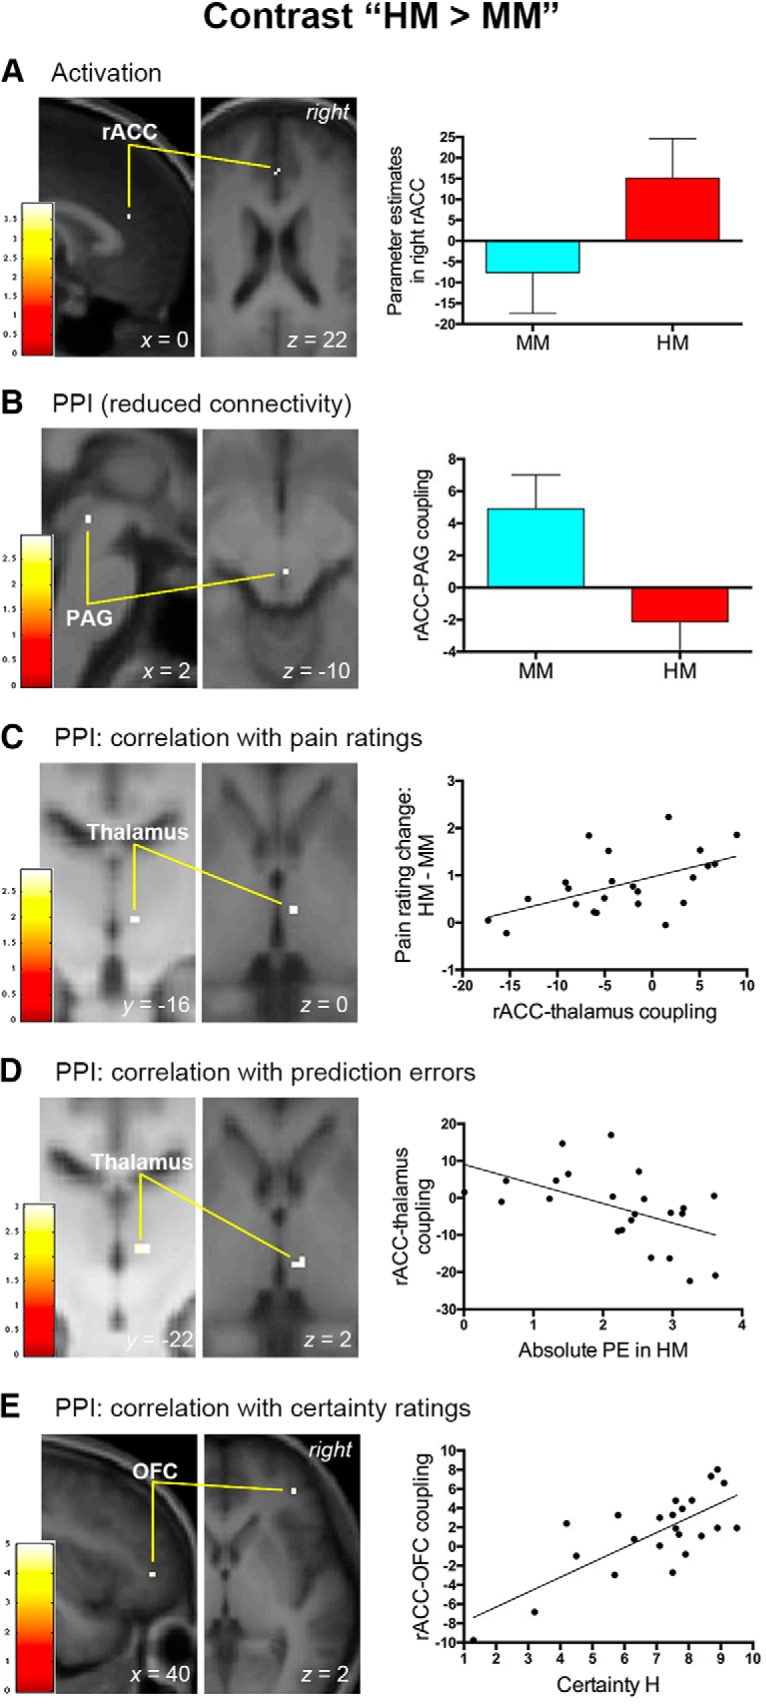
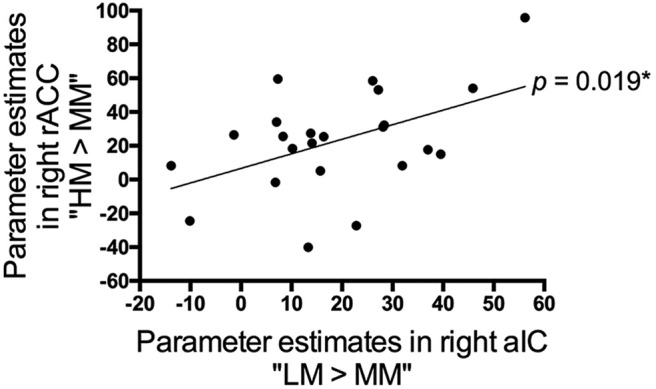
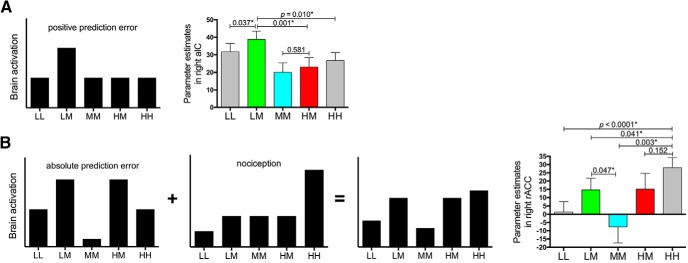
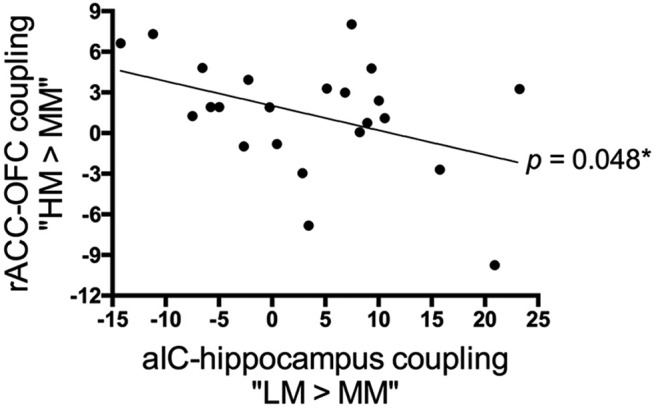
Expectations substantially influence pain perception, but the relationship between positive and negative expectations remains unclear. Recent evidence indicates that the integration between pain-related expectations and prediction errors is crucial for pain perception, which suggests that aversive prediction error-associated regions, such as the anterior insular cortex (aIC) and rostral anterior cingulate cortex (rACC), may play a pivotal role in expectation-induced pain modulation and help to delineate the relationship between positive and negative expectations. In a stimulus expectancy paradigm combining fMRI in healthy volunteers of both sexes, we found that, although positive and negative expectations respectively engaged the right aIC and right rACC to modulate pain, their associated activations and pain rating changes were significantly correlated. When positive and negative expectations modulated pain, the right aIC and rACC exhibited opposite coupling with periaqueductal gray (PAG) and the mismatch between actual and expected pain respectively modulated their coupling with PAG and thalamus across individuals. Participants' certainty about expectations predicted the extent of pain modulation, with positive expectations involving connectivity between aIC and hippocampus, a region regulating anxiety, and negative expectations engaging connectivity between rACC and lateral orbitofrontal cortex, a region reflecting outcome value and certainty. Interestingly, the strength of these certainty-related connectivities was also significantly associated between positive and negative expectations. These findings suggest that aversive prediction-error-related regions interact with pain-processing circuits to underlie stimulus expectancy effects on pain, with positive and negative expectations engaging dissociable but interrelated neural responses that are dependently regulated by individual certainty about expectations.SIGNIFICANCE STATEMENT Positive and negative expectations substantially influence pain perception, but their relationship remains unclear. Using fMRI in a stimulus expectancy paradigm, we found that, although positive and negative expectations engaged separate brain regions encoding the mismatch between actual and expected pain and involved opposite functional connectivities with the descending pain modulatory system, they produced significantly correlated pain rating changes and brain activation. Moreover, participants' certainty about expectations predicted the magnitude of both types of pain modulation, with the underlying functional connectivities significantly correlated between positive and negative expectations. These findings advance current understanding about cognitive modulation of pain, suggesting that both types of pain modulation engage different aversive prediction error signals but are dependently regulated by individual certainty about expectations.

Keywords: anterior cingulate cortex; expectation; functional magnetic resonance imaging; insula; pain; prediction error.


Figures

Figure 1.
Figure 1.
Experimental design and behavioral results. A, Each trial was initiated with a 1.5 s pain-predictive visual cue (a high-pain cue in this example). After a 3–5 s anticipation period, a 0.1 s electrical pain stimulus was applied to the dorsum of the left hand and, after a 3.9 s delay, participants reported subjective pain intensity on a VAS within 3.5 s. The intertrial interval was 4–6 s. B, Cue–stimulus contingencies. The conditioned visual cue was a compound image consisting of a square and a circle. The lower and upper part of the square brightened to constitute the low- and high-pain cue, respectively. Brightening of the inner circle denoted the medium-pain cue. On trials without a conditioned cue, the visual cue consisted of a question mark. The numbers in parentheses indicate the number of repetitions of each trial type in a single scanning session (totally 40 trials per session). C, Compared with a medium-pain cue and during the receipt of an identical medium pain stimulation, a low- and high-pain cue significantly reduced and increased subjective pain intensity, respectively (both p < 0.0001). D, The change in pain rating caused by a low-pain cue was positively correlated with that caused by a high-pain cue (p = 0.045). E, The low- and high-pain cue respectively elicited a significantly lower and higher expected pain intensity compared with that provoked by a medium-pain cue (both p < 0.0001). F, The cue-elicited subjective certainty about expected pain was not significantly different among the three cues (p > 0.065 for all pairwise comparisons). G, For both low- and high-pain cues, subjective certainty ratings were positively correlated with the extent of pain rating changes (p = 0.021 for the low-pain cue and p = 0.027 for the high-pain cue), with no significant difference between both correlations (p = 0.626). H, The subjective certainty elicited by a high-pain cue exhibited a significant negative correlation with the signed prediction error (PE) of pain (i.e., reported pain intensity − expected pain intensity) engendered in the HM condition (p = 0.009). The correlation associated with a low-pain cue was not significant (p = 0.159). I, The anxiety level elicited by a low- and high-pain cue was significantly lower (p = 0.009) and higher (p = 0.001) than that provoked by a medium-pain cue. J, For a low-pain cue, the level of provoked anxiety was negatively correlated with the corresponding change in pain rating (p = 0.0003). These relationships did not reach statistical significance for a high-pain cue (p = 0.052) and the correlation related to a low-pain cue was significantly stronger than that associated with a high-pain cue (p = 0.025). Error bars in C, E, F, and I represent SDs. *p < 0.05.
Figure 2.
Figure 2.
Brain regions reflecting intensity coding of pain. Activations were identified from the contrast “NL < NM < NH.” A, A whole-brain analysis revealed significant activations in the right primary somatosensory cortex (SI), bilateral SII, right posterior insular cortex (pIC), and cerebellum. B, Activation within the right thalamus survived small-volume corrections (p < 0.05, FWE corrected). Bar graphs depict parameter estimates extracted from the suprathreshold cluster. Error bars represent SEM. A, B, Activations were overlapped on an average structural image. The bar on the left shows the range of t scores for SPM 8.
Figure 3.
Figure 3.
Neural mechanisms associated with positive expectancy effects on pain. This figure shows the results of brain activation and PPI analyses in the right aIC associated with positive expectancy effects on pain. A, The right aIC exhibited increased activation as positive expectations reduced subjective pain perception. B, Positive expectations were also accompanied by an increase in functional connectivity between the right aIC and PAG. C, Functional connectivity between the right aIC and PAG predicted the magnitude of pain rating changes caused by positive expectations. D, The signed prediction error (PE) of pain engendered in the LM condition was inversely associated with the aIC–PAG connectivity associated with positive expectations. E, Functional connectivity between the right aIC and right hippocampus was inversely correlated with subjective certainty ratings elicited by a low-pain cue. AE, Activation clusters survived small-volume corrections (p < 0.05, FWE corrected) and were overlapped on an average structural image. The bar on the left shows the range of t scores for SPM 8. Bar graphs and scatter plots depict parameter estimates extracted from the suprathreshold cluster. Error bars in A and B represent SEM. Scatter plots depict the relationship between behavioral data and the strength of functional connectivity.
Figure 4.
Figure 4.
Neural mechanisms associated with negative expectancy effects on pain. This figure shows the results of brain activation and PPI analyses in the right rACC associated with negative expectancy effects on pain. A, Pain modulation by negative expectations entailed increased activation in the right rACC. B, Negative expectations were also accompanied by reduced functional connectivity between the rACC and PAG. C, Functional connectivity between the right rACC and right thalamus predicted the magnitude of pain rating changes provoked by negative expectations. D, The absolute prediction error (PE) of pain engendered in the HM condition was inversely correlated with the rACC–thalamus functional connectivity associated with negative expectations. E, Functional connectivity between the right rACC and right lateral OFC covaried with subjective certainty ratings elicited by a high-pain cue. AE, Activation clusters survived small-volume corrections (p < 0.05, FWE corrected) and were overlapped on an average structural image. The bar on the left shows the range of t scores for SPM 8. Bar graphs and scatter plots depict parameter estimates extracted from the suprathreshold cluster. Error bars in A and B represent SEM. Scatter plots depict the relationship between behavioral data and the strength of functional connectivity.
Figure 5.
Figure 5.
Linear relationship between positive expectation- and negative expectation-associated brain activations. The BOLD signal within the significant cluster in the right aIC (contrast “LM > MM”) increased monotonically with that in the right rACC (contrast “HM > MM”) across subjects (p = 0.019). Data in this scatter plot were parameter estimates extracted from the suprathreshold cluster of the contrast “LM > MM” (Fig. 3A) and “HM > MM” (Fig. 4A). *p < 0.05.
Figure 6.
Figure 6.
Response patterns in key regions underlying stimulus expectancy effects on pain. Black bars depict theoretical pattern of BOLD signals across different trial types (equal weighting of both components in B). A, The right aIC possibly engendered a positive prediction error of pain because its response during the LM condition was significantly stronger than all the rest four conditions and there was no significant difference between the HM and MM conditions. B, The response profile of the right rACC could be accounted for by an absolute pain prediction error component (highest responses in LM and HM, lowest in MM, with LL and HH in the middle) plus a nociception component (highest for high-pain stimulation, followed in descending order by middle- and low-pain stimulation). For the aIC and rACC, the BOLD signals were extracted from the suprathreshold cluster of the contrast “LM > MM” (Fig. 3A) and “HM > MM” (Fig. 4A), respectively. *p < 0.05.
Figure 7.
Figure 7.
Linear relationship in certainty-related functional connectivities between positive and negative expectations. Across subjects, positive expectation-associated functional connectivity between the right aIC and right hippocampus was inversely correlated with negative expectation-associated functional connectivity between the right rACC and right lateral OFC (p = 0.048). Data in this scatter plot were parameter estimates extracted from the suprathreshold cluster in Figures 3E and 4E. *p < 0.05.

Similar articles

Cited by

References

    1. Apkarian AV, Bushnell MC, Treede RD, Zubieta JK (2005) Human brain mechanisms of pain perception and regulation in health and disease. Eur J Pain 9:463–484. 10.1016/j.ejpain.2004.11.001 - DOI - PubMed
    1. Atlas LY, Wager TD (2014) A meta-analysis of brain mechanisms of placebo analgesia: consistent findings and unanswered questions. Handb Exp Pharmacol 225:37–69. 10.1007/978-3-662-44519-8_3 - DOI - PMC - PubMed
    1. Atlas LY, Bolger N, Lindquist MA, Wager TD (2010) Brain mediators of predictive cue effects on perceived pain. J Neurosci 30:12964–12977. 10.1523/JNEUROSCI.0057-10.2010 - DOI - PMC - PubMed
    1. Augustine JR. (1996) Circuitry and functional aspects of the insular lobe in primates including humans. Brain Res Rev 22:229–244. 10.1016/S0165-0173(96)00011-2 - DOI - PubMed
    1. Bannerman DM, Sprengel R, Sanderson DJ, McHugh SB, Rawlins JN, Monyer H, Seeburg PH (2014) Hippocampal synaptic plasticity, spatial memory and anxiety. Nat Rev Neurosci 15:181–192. 10.1038/nrn3677 - DOI - PubMed

Publication types

MeSH terms