

Towards Quantitative Microbiome Community Profiling Using Internal Standards
- PMID: 30552195
- PMCID: PMC6384117
- DOI: 10.1128/AEM.02634-18
Towards Quantitative Microbiome Community Profiling Using Internal Standards
Abstract
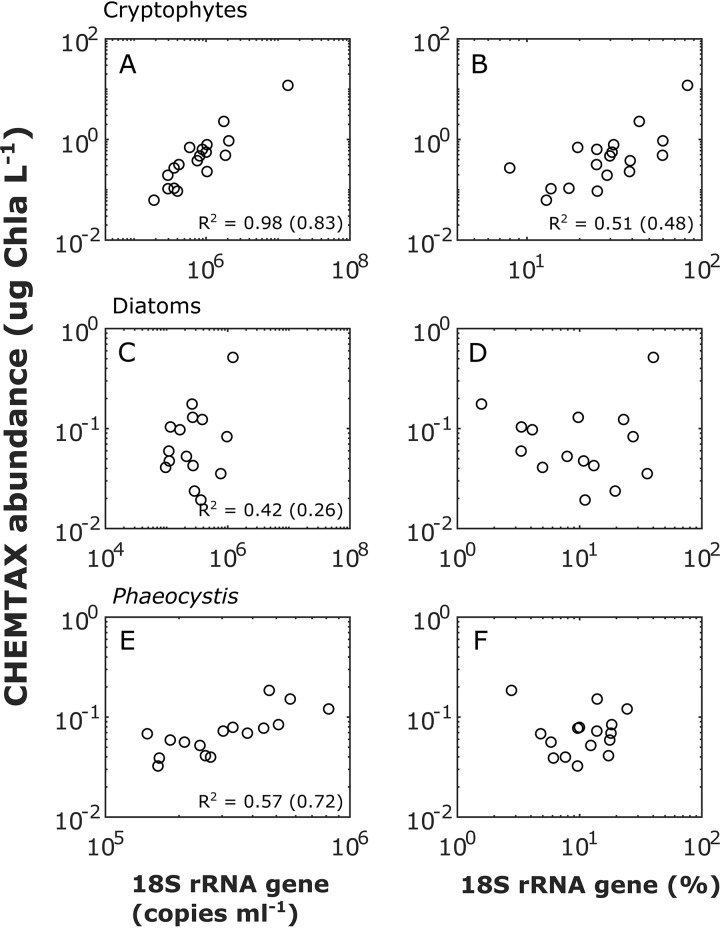
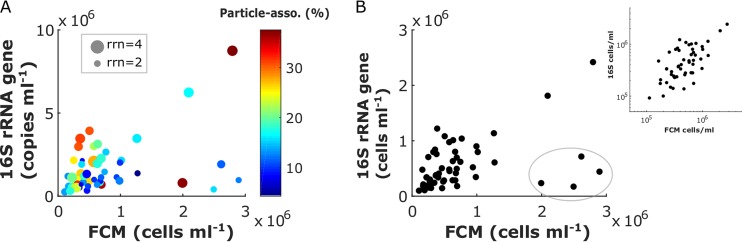
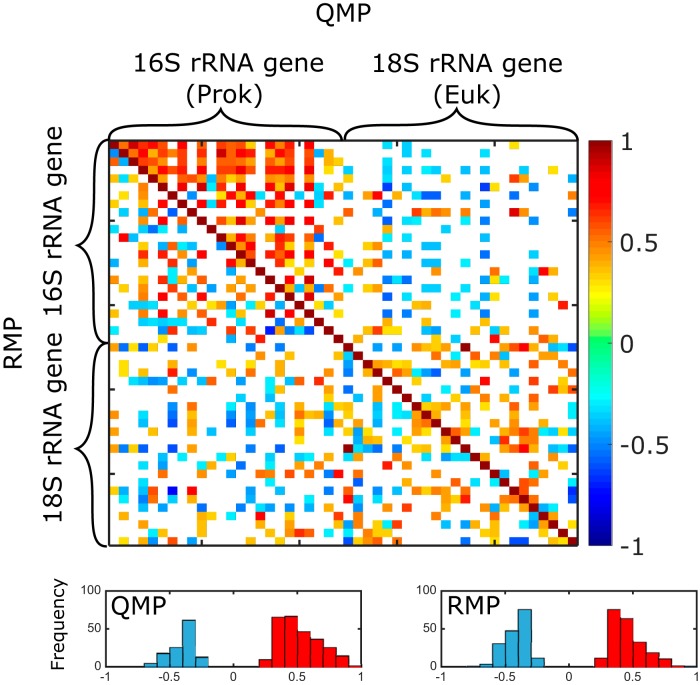
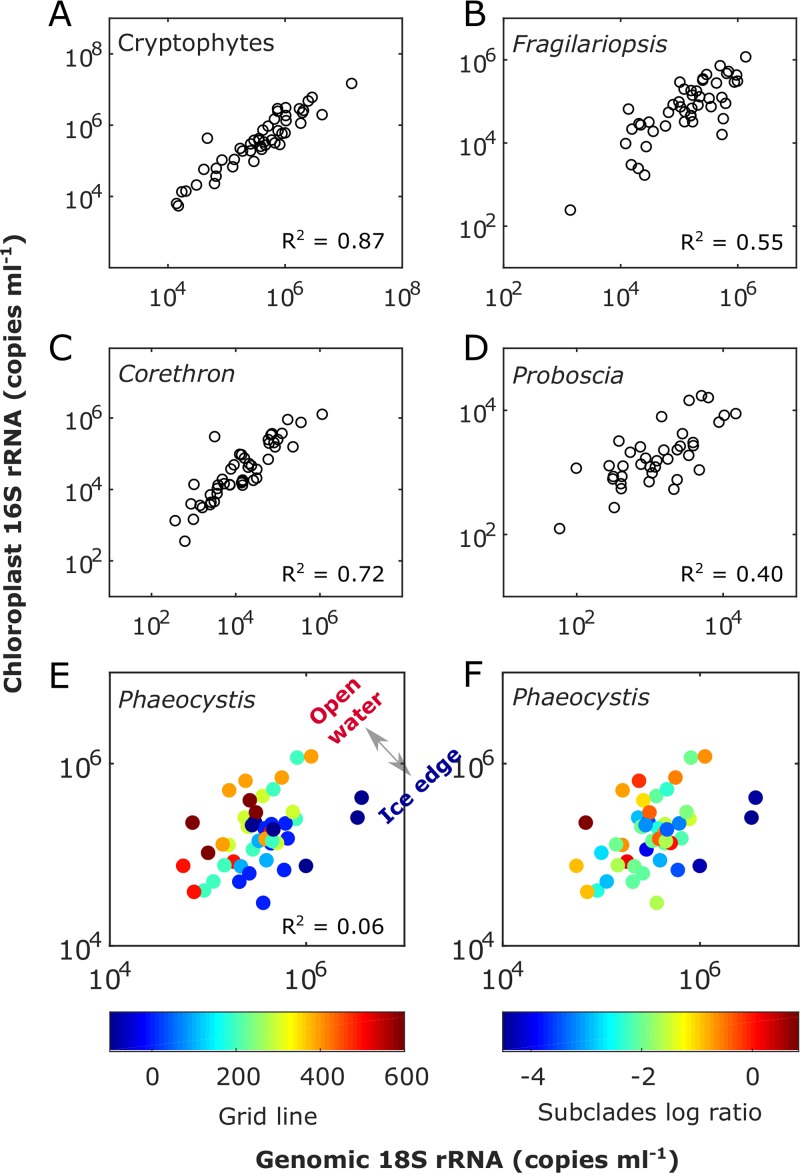
An inherent issue in high-throughput rRNA gene tag sequencing microbiome surveys is that they provide compositional data in relative abundances. This often leads to spurious correlations, making the interpretation of relationships to biogeochemical rates challenging. To overcome this issue, we quantitatively estimated the abundance of microorganisms by spiking in known amounts of internal DNA standards. Using a 3-year sample set of diverse microbial communities from the Western Antarctica Peninsula, we demonstrated that the internal standard method yielded community profiles and taxon cooccurrence patterns substantially different from those derived using relative abundances. We found that the method provided results consistent with the traditional CHEMTAX analysis of pigments and total bacterial counts by flow cytometry. Using the internal standard method, we also showed that chloroplast 16S rRNA gene data in microbial surveys can be used to estimate abundances of certain eukaryotic phototrophs such as cryptophytes and diatoms. In Phaeocystis, scatter in the 16S/18S rRNA gene ratio may be explained by physiological adaptation to environmental conditions. We conclude that the internal standard method, when applied to rRNA gene microbial community profiling, is quantitative and that its application will substantially improve our understanding of microbial ecosystems.IMPORTANCE High-throughput-sequencing-based marine microbiome profiling is rapidly expanding and changing how we study the oceans. Although powerful, the technique is not fully quantitative; it provides taxon counts only in relative abundances. In order to address this issue, we present a method to quantitatively estimate microbial abundances per unit volume of seawater filtered by spiking known amounts of internal DNA standards into each sample. We validated this method by comparing the calculated abundances to other independent estimates, including chemical markers (pigments) and total bacterial cell counts by flow cytometry. The internal standard approach allows us to quantitatively estimate and compare marine microbial community profiles, with important implications for linking environmental microbiomes to quantitative processes such as metabolic and biogeochemical rates.
Keywords: amplicon sequencing; community profiling; internal standard; marine microbiome.
Copyright © 2019 American Society for Microbiology.
Figures
Similar articles
-
Species-level bacterial community profiling of the healthy sinonasal microbiome using Pacific Biosciences sequencing of full-length 16S rRNA genes.Microbiome. 2018 Oct 23;6(1):190. doi: 10.1186/s40168-018-0569-2. Microbiome. 2018. PMID: 30352611 Free PMC article.
-
Bacterial and Eukaryotic Small-Subunit Amplicon Data Do Not Provide a Quantitative Picture of Microbial Communities, but They Are Reliable in the Context of Ecological Interpretations.mSphere. 2020 Mar 4;5(2):e00052-20. doi: 10.1128/mSphere.00052-20. mSphere. 2020. PMID: 32132159 Free PMC article.
-
Characterization of Eukaryotic Microbiome Using 18S Amplicon Sequencing.Methods Mol Biol. 2018;1849:29-48. doi: 10.1007/978-1-4939-8728-3_3. Methods Mol Biol. 2018. PMID: 30298246
-
Microbiome Sequencing Methods for Studying Human Diseases.Methods Mol Biol. 2018;1706:77-90. doi: 10.1007/978-1-4939-7471-9_5. Methods Mol Biol. 2018. PMID: 29423794 Review.
-
PCR-based quantification of taxa-specific abundances in microbial communities: Quantifying and avoiding common pitfalls.J Microbiol Methods. 2018 Oct;153:139-147. doi: 10.1016/j.mimet.2018.09.015. Epub 2018 Sep 26. J Microbiol Methods. 2018. PMID: 30267718 Review.
Cited by
-
Multi-factor analysis of the quality of cellar mud of Luzhou-flavor liquor in Yibin production area.Food Sci Nutr. 2024 May 30;12(7):5231-5249. doi: 10.1002/fsn3.4174. eCollection 2024 Jul. Food Sci Nutr. 2024. PMID: 39055204 Free PMC article.
-
Cross-comparison of microbiota in the oropharynx, hypopharyngeal squamous cell carcinoma and their adjacent tissues through quantitative microbiome profiling.J Oral Microbiol. 2022 May 10;14(1):2073860. doi: 10.1080/20002297.2022.2073860. eCollection 2022. J Oral Microbiol. 2022. PMID: 35573640 Free PMC article.
-
Diurnal oscillations in gut bacterial load and composition eclipse seasonal and lifetime dynamics in wild meerkats.Nat Commun. 2021 Oct 14;12(1):6017. doi: 10.1038/s41467-021-26298-5. Nat Commun. 2021. PMID: 34650048 Free PMC article.
-
Absolute abundance calculation enhances the significance of microbiome data in antibiotic treatment studies.Front Microbiol. 2025 Mar 24;16:1481197. doi: 10.3389/fmicb.2025.1481197. eCollection 2025. Front Microbiol. 2025. PMID: 40196033 Free PMC article.
-
Supplemental Oxygen Alters the Airway Microbiome in Cystic Fibrosis.mSystems. 2022 Oct 26;7(5):e0036422. doi: 10.1128/msystems.00364-22. Epub 2022 Aug 24. mSystems. 2022. PMID: 36000724 Free PMC article.
References
-
- de Vargas C, Audic S, Henry N, Decelle J, Mahe F, Logares R, Lara E, Berney C, Le Bescot N, Probert I, Carmichael M, Poulain J, Romac S, Colin S, Aury J-M, Bittner L, Chaffron S, Dunthorn M, Engelen S, Flegontova O, Guidi L, Horak A, Jaillon O, Lima-Mendez G, Luke J, Malviya S, Morard R, Mulot M, Scalco E, Siano R, Vincent F, Zingone A, Dimier C, Picheral M, Searson S, Kandels-Lewis S, Acinas SG, Bork P, Bowler C, Gorsky G, Grimsley N, Hingamp P, Iudicone D, Not F, Ogata H, Pesant S, Raes J, Sieracki ME, Speich S, Stemmann L, Sunagawa S, Weissenbach J, Wincker P, Karsenti E, Boss E, Follows M, Karp-Boss L, Krzic U, Reynaud EG, Sardet C, Sullivan MB, Velayoudon D. 2015. Eukaryotic plankton diversity in the sunlit ocean. Science 348:1261605. doi:10.1126/science.1261605. - DOI - PubMed
Publication types
MeSH terms
Substances
LinkOut - more resources
Full Text Sources
