. 2019 Feb;179(2):761-769.
doi: 10.1104/pp.18.01357. Epub 2018 Dec 14.

Genome-Scale Fluxome of Synechococcus elongatus UTEX 2973 Using Transient 13C-Labeling Data

Affiliations

Genome-Scale Fluxome of Synechococcus elongatus UTEX 2973 Using Transient 13C-Labeling Data

John I Hendry et al. Plant Physiol. 2019 Feb.

Abstract

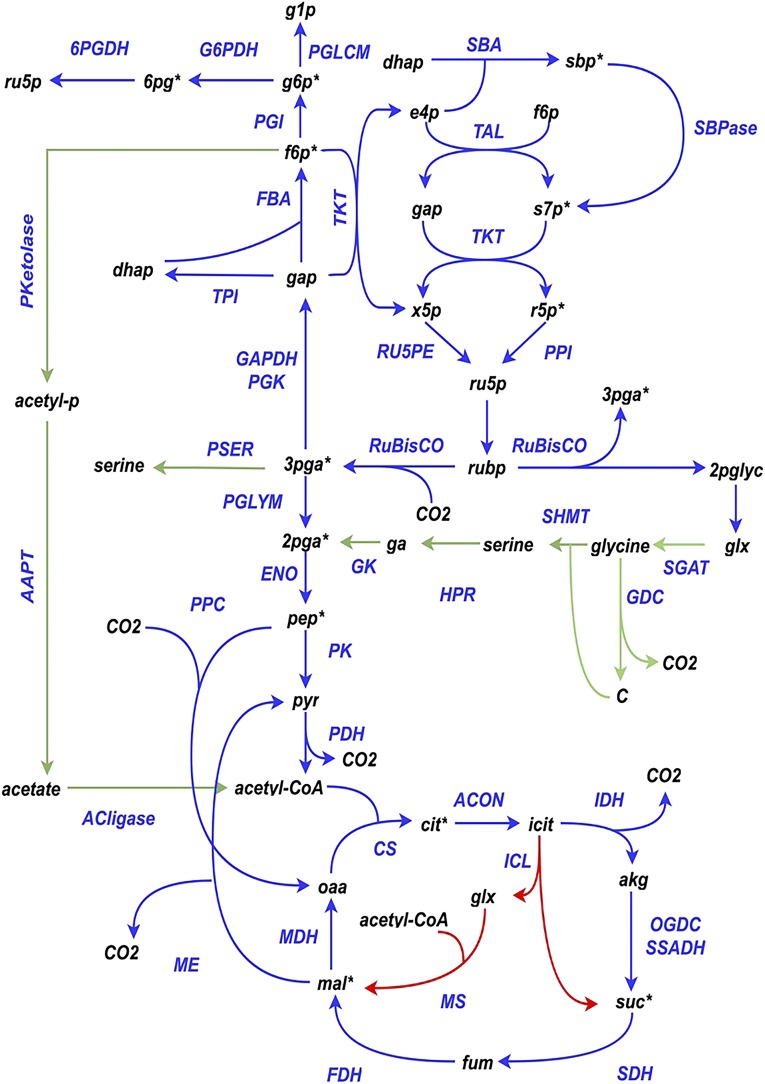
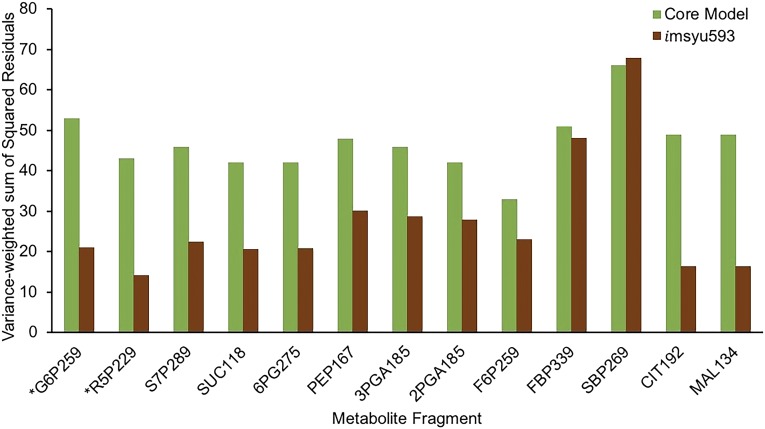
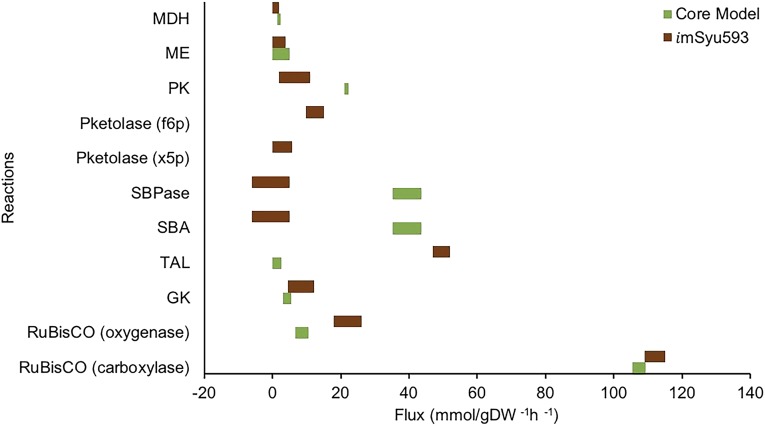
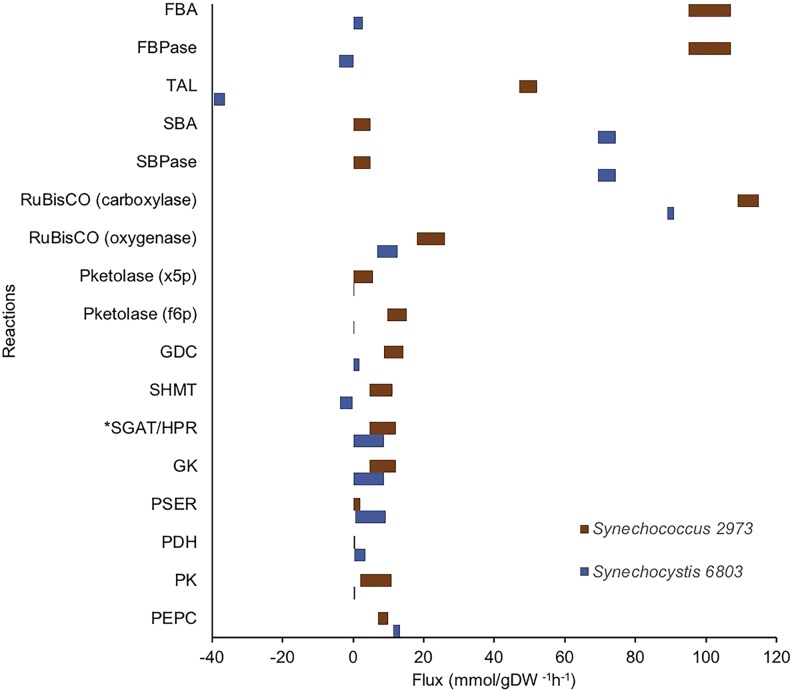
Synechococcus elongatus UTEX 2973 (Synechococcus 2973) has the shortest reported doubling time (2.1 h) among cyanobacteria, making it a promising platform for the solar-based production of biochemicals. In this meta-analysis, its intracellular flux distribution was recomputed using genome-scale isotopic nonstationary 13C-metabolic flux analysis given the labeling dynamics of 13 metabolites reported in an earlier study. To achieve this, a genome-scale mapping model, namely imSyu593, was constructed using the imSyn617 mapping model for Synechocystis sp. PCC 6803 (Synechocystis 6803) as the starting point encompassing 593 reactions. The flux elucidation revealed nearly complete conversion (greater than 96%) of the assimilated carbon into biomass in Synechococcus 2973. In contrast, Synechocystis 6803 achieves complete conversion of only 86% of the assimilated carbon. This high biomass yield was enabled by the reincorporation of the fixed carbons lost in anabolic and photorespiratory pathways in conjunction with flux rerouting through a nondecarboxylating reaction such as phosphoketolase. This reincorporation of lost CO2 sustains a higher flux through the photorespiratory C2 cycle that fully meets the glycine and serine demands for growth. In accordance with the high carbon efficiency drive, acetyl-coenzyme A was entirely produced using the carbon-efficient phosphoketolase pathway. Comparison of the Synechococcus 2973 flux map with that of Synechocystis 6803 revealed differences in the use of Calvin cycle and photorespiratory pathway reactions. The two species used different reactions for the synthesis of metabolites such as fructose-6-phosphate, glycine, sedoheptulose-7-phosphate, and Ser. These findings allude to a highly carbon-efficient metabolism alongside the fast carbon uptake rate in Synechococcus 2973, which explains its faster growth rate.


Figures

Figure 1.
Figure 1.
Schematic of the central carbon metabolism of Synechococcus 2973. Reactions exclusive to the core model (Abernathy et al., 2017) and imSyu593 are highlighted in red and green, respectively. *, Metabolites whose labeling data were fitted in this study. 2pglyc, 2-Phosphoglycolate; 6PGDH, 6-phosphogluconate dehydrogenase; acetyl-p, acetyl phosphate; ACON, aconitase; akg, α-ketoglutarate; CS, citrate synthase; dhap, dihydroxyacetone phosphate; ENO, enolase; FBA, Fru bisphosphate aldolase; fbp, Fru bisphosphate; FDH, fumarate dehydrogenase; fum, fumarate; g1p, Glc-1-P; G6PDH, Glc-6-P dehydrogenase; gap, glyceraldehyde-3-phosphate; GAPDH, glyceraldehyde-3-phosphate dehydrogenase; GDC, Gly decarboxylase; GK, glycerate kinase; glx, glyoxalate; HPR, hydroxypyruvate reductase; ICL, isocitrate lyase; IDH, isocitrate dehydrogenase; MS, malate synthase; oaa, oxaloacetate; OGDC, 2-oxoglutarate decarboxylase; PGI, phosphoglucose mutase; PGK, phosphoglycerate kinase, PGLCM, phosphoglucomutase; PGLYM, phosphoglycerate mutase; PK, pyruvate kinase; PPC, phosphoenolpyruvate carboxylase; PPI, pentose phosphate isomerase; pyr, pyruvate; ru5p, ribulose-5-phosphate; RU5PE, ribulose-5-phosphate epimerase; rubp, ribulose-1,5-bisphosphate; SDH, succinate dehydrogenase; SGAT, Ser-glyoxylate aminotransferase; SHMT, Ser-hydroxymethyl transferase; SSDH, succinic semialdehyde dehydrogenase; TKT, transketolase; TPI, triosephosphate isomerase.
Figure 2.
Figure 2.
Comparison of variance-weighted SSR obtained, in the case of Synechococcus 2973, using the core model and imSyu593 for the various metabolite fragments. Green bars correspond to the core model, and brown bars correspond to imsyu593. Lower SSR indicates a better recapitulation of the labeling dynamics for the corresponding fragment. *Fragments for which the difference in SSR is greater than 25.
Figure 3.
Figure 3.
Comparison of the flux ranges (95% confidence interval) for relevant reactions obtained using the core model (Abernathy et al., 2017) and imSyu593 under photoautotrophic conditions. Green bars correspond to the core model, and brown bars correspond to imsyu593. The left end of each bar indicates the lower bound, and the right end of each bar indicates the upper bound. The fluxes are normalized to a carbon uptake of 100 mmol g−1 dry weight (DW) h−1. See Figure 1 for abbreviations and details of individual reactions.
Figure 4.
Figure 4.
Comparison of the normalized flux ranges (95% confidence interval) of selected reactions between Synechococcus 2973 and Synechocystis 6803 (Gopalakrishnan et al., 2018) under the photoautotrophic conditions. Brown bars correspond to Synechococcus 2973, and blue bars correspond to Synechocystis 6803. The left end of each bar indicates the lower bound, and the right end of each bar indicates the upper bound. The fluxes are normalized to a bicarbonate uptake of 100 mmol g−1 dry weight (DW) h−1. See Figure 1 for abbreviations and details on individual reactions.

References

    1. Abernathy MH, Yu J, Ma F, Liberton M, Ungerer J, Hollinshead WD, Gopalakrishnan S, He L, Maranas CD, Pakrasi HB, et al. (2017) Deciphering cyanobacterial phenotypes for fast photoautotrophic growth via isotopically nonstationary metabolic flux analysis. Biotechnol Biofuels 10: 273. - PMC - PubMed
    1. Adebiyi AO, Jazmin LJ, Young JD (2015) 13C flux analysis of cyanobacterial metabolism. Photosynth Res 126: 19–32 - PubMed
    1. Alagesan S, Gaudana SB, Sinha A, Wangikar PP (2013) Metabolic flux analysis of Cyanothece sp. ATCC 51142 under mixotrophic conditions. Photosynth Res 118: 191–198 - PubMed
    1. Allen DK. (2016) Quantifying plant phenotypes with isotopic labeling & metabolic flux analysis. Curr Opin Biotechnol 37: 45–52 - PubMed
    1. Anfelt J, Kaczmarzyk D, Shabestary K, Renberg B, Rockberg J, Nielsen J, Uhlén M, Hudson EP (2015) Genetic and nutrient modulation of acetyl-CoA levels in Synechocystis for n-butanol production. Microb Cell Fact 14: 167. - PMC - PubMed

Publication types

LinkOut - more resources