. 2018 Dec 14;9(1):5315.
doi: 10.1038/s41467-018-07659-z.

Drug and disease signature integration identifies synergistic combinations in glioblastoma

Affiliations

Drug and disease signature integration identifies synergistic combinations in glioblastoma

Vasileios Stathias et al. Nat Commun. .

Abstract

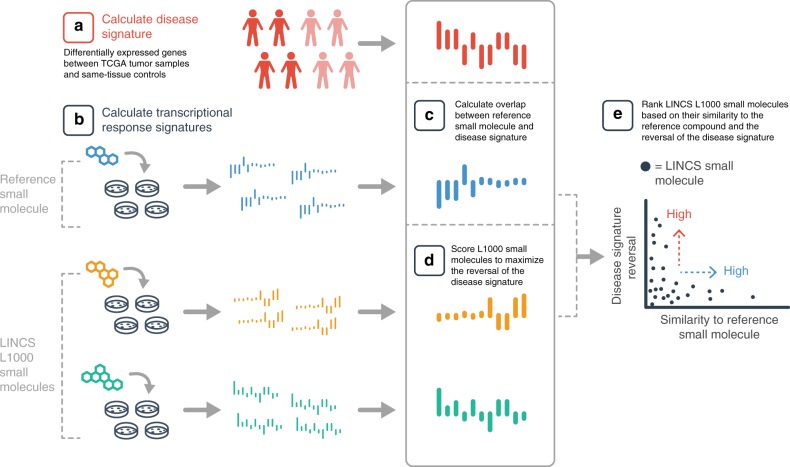
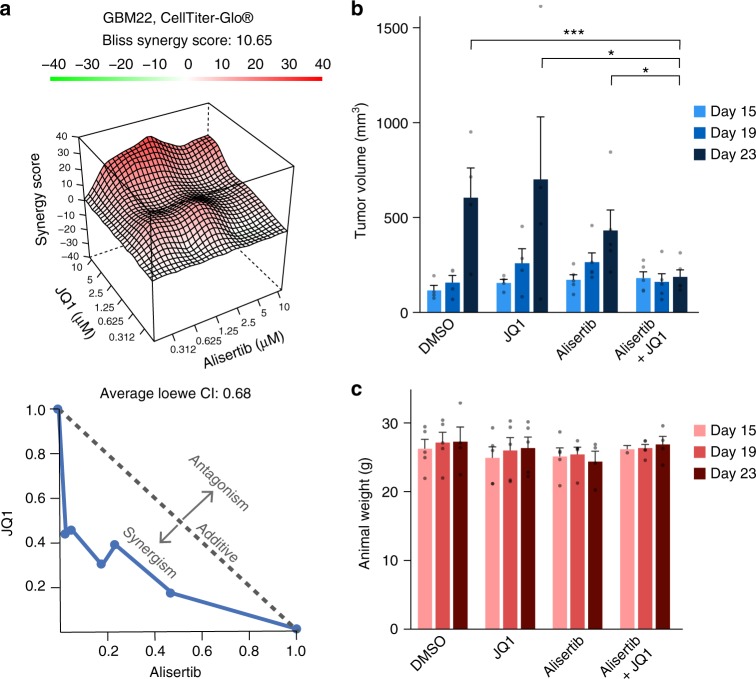
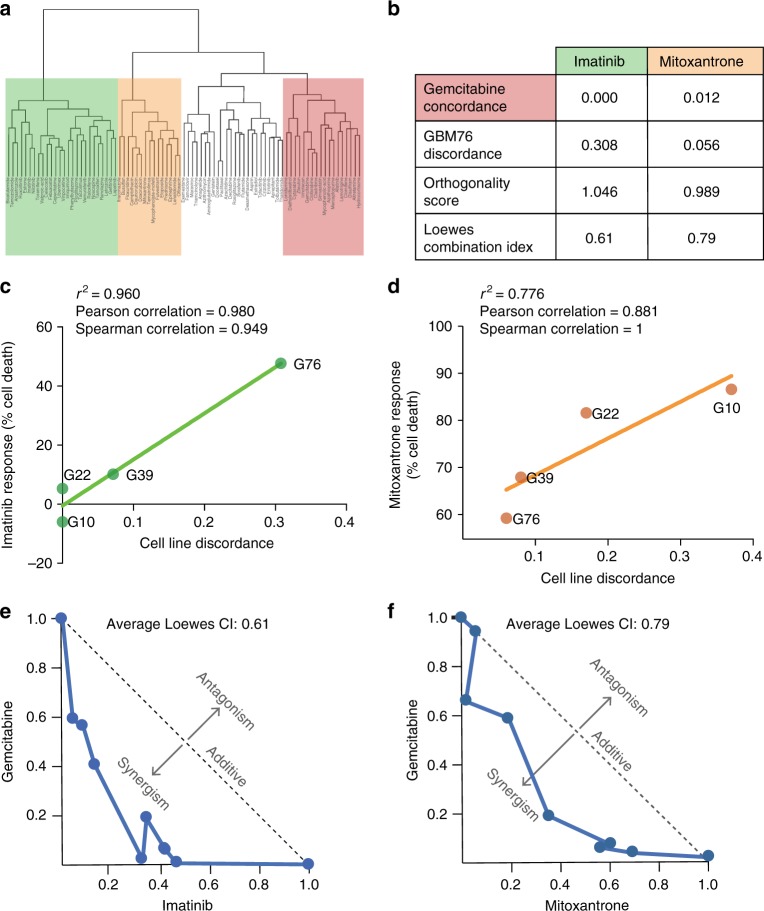
Glioblastoma (GBM) is the most common primary adult brain tumor. Despite extensive efforts, the median survival for GBM patients is approximately 14 months. GBM therapy could benefit greatly from patient-specific targeted therapies that maximize treatment efficacy. Here we report a platform termed SynergySeq to identify drug combinations for the treatment of GBM by integrating information from The Cancer Genome Atlas (TCGA) and the Library of Integrated Network-Based Cellular Signatures (LINCS). We identify differentially expressed genes in GBM samples and devise a consensus gene expression signature for each compound using LINCS L1000 transcriptional profiling data. The SynergySeq platform computes disease discordance and drug concordance to identify combinations of FDA-approved drugs that induce a synergistic response in GBM. Collectively, our studies demonstrate that combining disease-specific gene expression signatures with LINCS small molecule perturbagen-response signatures can identify preclinical combinations for GBM, which can potentially be tested in humans.


Conflict of interest statement

The authors declare no competing interests.

Figures

Fig. 1
Fig. 1
SynergySeq workflow for identifying synergistic drug combinations using disease discordance and drug concordance. a A disease signature is calculated by identifying the differentially expressed genes between tumor samples and same-tissue controls. b Transcriptional consensus signatures (TCS) are calculated for a reference small molecule and the LINCS L1000 small molecules. c The overlap between the reference TCS and the disease signature is calculated. d The LINCS L1000 small molecules are ranked to maximize the reversal of the disease signature. e The LINCS L1000 small molecules are plotted based on their similarity to the reference small molecule and the reversal of the disease signature
Fig. 2
Fig. 2
Clustering of TCGA samples and GBM PDX samples using the L1000 gene set reflects cancer types. a PCA plot, b Hierarchical Clustering, and c t-distributed stochastic neighbor embedding (tSNE) plot of 4515 RNA-Seq TCGA tumor samples labeled based on their cancer type by using the expression of only 978 genes. d Heatmap of the Spearman correlation of 41 PDX GBM samples from Mayo Clinic and 4515 tumor samples downloaded from TCGA. Cancer types: BRCA: breast invasive carcinoma, COAD: colon adenocarcinoma, GBM: glioblastoma, HNSC: head-neck squamous cell carcinoma, KIRC: kidney renal clear cell carcinoma, LUAD: lung adenocarcinoma, LUSC: lung squamous cell carcinoma, READ: rectum adenocarcinoma, UCEC: uterine corpus endometrial carcinoma, OV: ovarian cancer
Fig. 3
Fig. 3
Transcriptional consensus signatures can identify common transcriptional responses to compounds. a Histogram of the number of genes in the TCS per compound. Most of the compounds tested have a low number of genes in their TCS. b The number of genes that each compound has in its TCS is correlated with the Transcription activity score, a metric for the consistency in a compound’s transcriptional response. PCC: Pearson correlation coefficient. c Specificity and concordance of L1000 compounds compared to the JQ1 TCS. Only a few compounds overlap and have a concordant transcriptional response with the JQ1 TCS. d The JQ1 Transcriptional response signature. The top two (e, f) and the bottom two (g, h) compounds with the highest specificity to the JQ1 TCS. i The top 10 compounds with the highest concordance to the JQ1 TCS are BET inhibitors
Fig. 4
Fig. 4
L1000 consensus signatures reflect molecule mechanism of action. a Correlation matrix of the 285 LINCS consensus signatures and the 14 GBM consensus signatures. The LINCS L1000 dataset was merged with the GBM L1000 dataset, and TCSs were calculated and used to produce the correlation matrix. The red clusters along the diagonal indicate compounds that have highly correlated consensus signatures. b Networks of highly correlated LINCS small molecules. A connection indicates a 0.7 or above Pearson correlation of their consensus gene signatures. The compounds were colored and labeled based on their mechanism of action as identified through a literature search. Compound names and mechanisms of action can be found in Supplementary Figure 3
Fig. 5
Fig. 5
Synergistic response of cell proliferation inhibition and apoptosis after treatment with JQ1 and/or GSK-1070916. a Ranking of the 285 LINCS compounds based on their orthogonality to the GBM-JQ1 consensus signature. Compounds with a high x-axis value have a signature concordant to JQ1 and compounds with a high y-axis value have a signature discordant to the disease. b, c Synergy was assessed for a total of 5 cell lines and the Bliss synergy scores (b) and the Loewe combination indices (c) were plotted against the cell line-specific discordance from GSK-1070916. A strong correlation was seen between increased discordance and increased synergy (higher Bliss score, lower Loewe CI). d Reduced cell proliferation measured by ATP levels using CellTiter-Glo® are normalized to positive control (Velcade) and negative control (DMSO). From left to right, the Bliss score surface and an isobologram plot of the Loewe combination index for the combination of JQ1 with GSK-1070916. Synergy analyses for additional cell lines can be found in Supplementary Figure 4. e Apoptosis measured by Caspase3/7 levels using Caspase-Glo® and normalized to positive control (Velcade) and negative control (DMSO). f Synergistic response of the Bliss score surface observed using JQ1 with GSK-1070916 as measured by CellTiter-Glo®. g Sub-synergistic response of the Bliss score surface observed using JQ1 with SR1277 as measured by CellTiter-Glo®. Source data can be found in the Source Data file, Supplementary Data 6, under tab Fig. 5
Fig. 6
Fig. 6
JQ1 and alisertib synergize in vitro and in vivo in reducing GBM tumor growth. a Synergistic response of JQ1 and alisertib measured by ATP levels using CellTiter-Glo® in GBM22 PDX cells. ATP levels are normalized to positive control (Velcade) and negative control (DMSO). The Bliss score surface (top) and isobologram plot of the Loewe combination index (bottom). b Synergistic response observed for JQ1 and alisertib combination in vitro in a flank model of GBM, measured by caliper. Mice were implanted with GBM22 PDX cells and treated starting at day 15 with 25 mg kg−1 per day of alisertib and/or 30 mg kg−1 per day of JQ1 for 10 days. Significance was determined using an unpaired t-test with Holm-Sidak correction for multiple comparisons, *p < 0.05, ***p < 0.001. c JQ1 and alisertib combination does not reduce mouse weight. Weight of mice analyzed in (c) was assessed at the indicated time points. Sample size was as follows: DMSO, JQ1 n = 4; Alisertib, Alisertib+JQ1 n = 5. Please note that one mouse in each the Alisertib and Alisertib+JQ1 group perished before 23-day animal weight was obtained. Mean and standard error bars are shown. Source data can be found in the Source Data file, Supplementary Data 6, under tab Fig. 6
Fig. 7
Fig. 7
Combining FDA-approved compounds induces synergy in reducing GBM cell proliferation. L1000 profiling was performed for 83 FDA-approved compounds. a Compounds were clustered according to the transcriptional profile they induce in all cancer cells. Group 1, shaded in green, contains imatinib; Group 2, shaded in orange, contains mitoxantrone, and Group 3, shaded in red, contains gemcitabine. b Compounds were ranked based on concordance to gemcitabine and discordance from signature of the mean of the PDX GBM cell lines and two compounds were selected to test for proof of concept: imatinib and mitoxantrone. Orthogonality score was computed and the Loewes combination index was calculated in PDX GBM76 cells. c, d The reduced cell proliferation responses to imatinib and mitoxantrone in monotherapy for 4 cell lines were plotted against the cell line-specific discordance scores for imatinib (c) or mitoxantrone (d). e, f Combinations were tested in PDX GBM76 cells. Synergy was calculated using the Loewe additive model and a normalized isobologram was plotted to visualize synergy for each combination. Source data can be found in the Source Data file, Supplementary Data 6, under tab Fig. 7

Comment in

References

    1. Carlsson SK, Brothers SP, Wahlestedt C. Emerging treatment strategies for glioblastoma multiforme. EMBO Mol. Med. 2014;6:1359–1370. doi: 10.15252/emmm.201302627. - DOI - PMC - PubMed
    1. Ostrom QT, et al. CBTRUS statistical report: primary brain and central nervous system tumors diagnosed in the United States in 2006–2010. Neuro. Oncol. 2013;15:ii1–ii56. doi: 10.1093/neuonc/not151. - DOI - PMC - PubMed
    1. Stupp R, et al. Radiotherapy plus concomitant and adjuvant temozolomide for glioblastoma. New Engl. J. Med. 2005;352:987–996. doi: 10.1056/NEJMoa043330. - DOI - PubMed
    1. Lee SY. Temozolomide resistance in glioblastoma multiforme. Genes & Dis. 2016;3:198–210. doi: 10.1016/j.gendis.2016.04.007. - DOI - PMC - PubMed
    1. Tan SK, et al. Drug Repositioning in Glioblastoma: a Pathway Perspective. Front. Pharmacol. 2018;9:218. doi: 10.3389/fphar.2018.00218. - DOI - PMC - PubMed

Publication types

MeSH terms

Substances