. 2018 Dec 14;9(1):5314.
doi: 10.1038/s41467-018-07732-7.

Blood flow-induced Notch activation and endothelial migration enable vascular remodeling in zebrafish embryos

Affiliations

Blood flow-induced Notch activation and endothelial migration enable vascular remodeling in zebrafish embryos

Bart Weijts et al. Nat Commun. .

Abstract

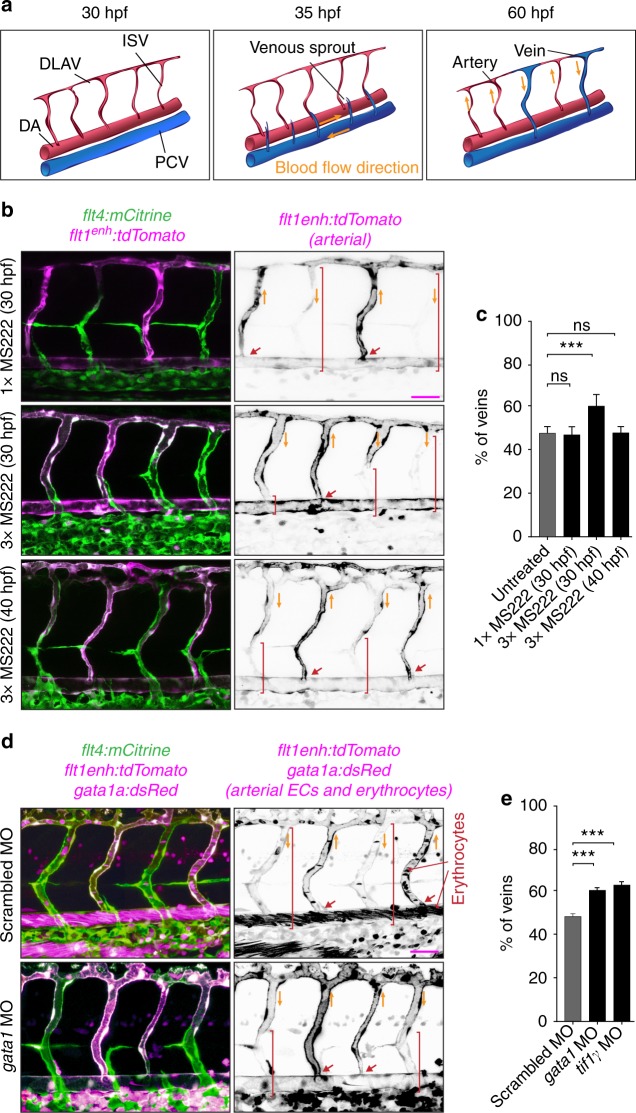
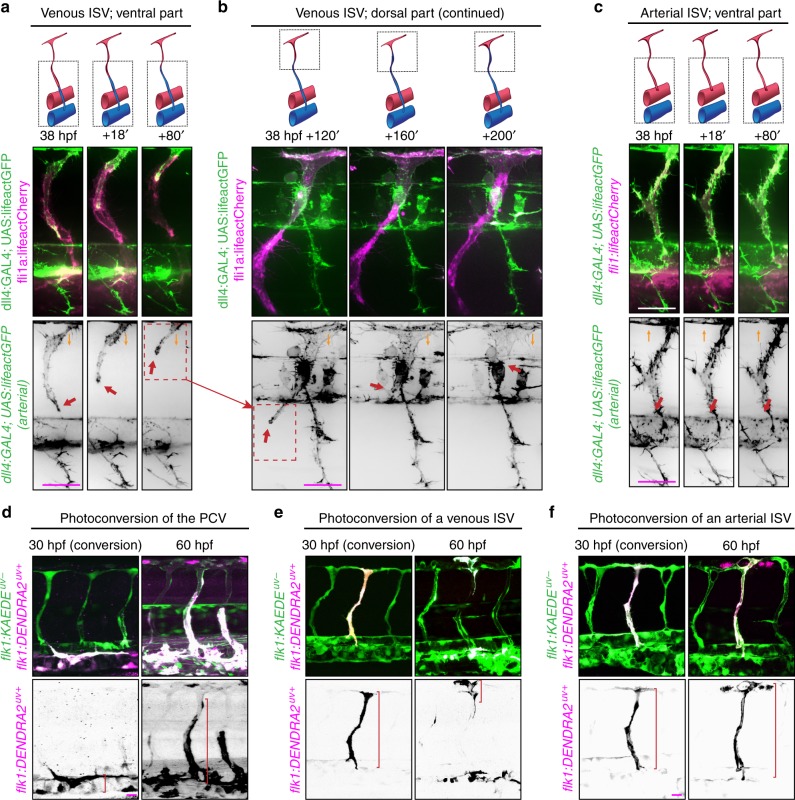
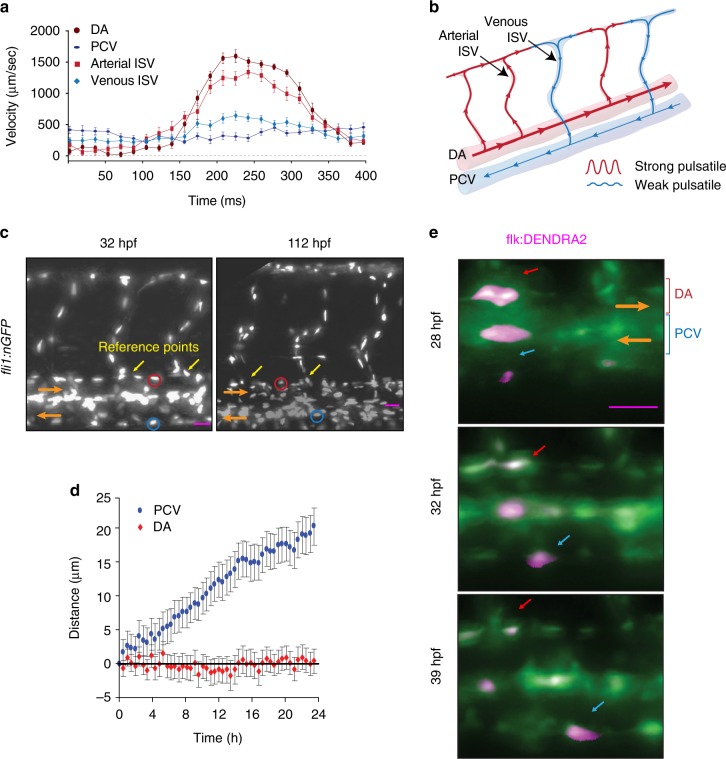
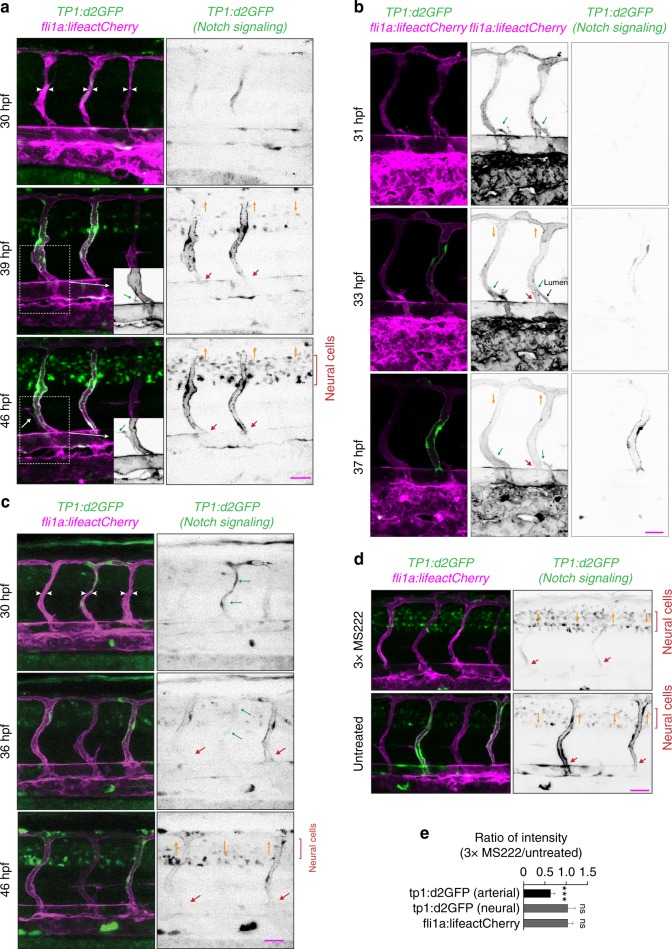
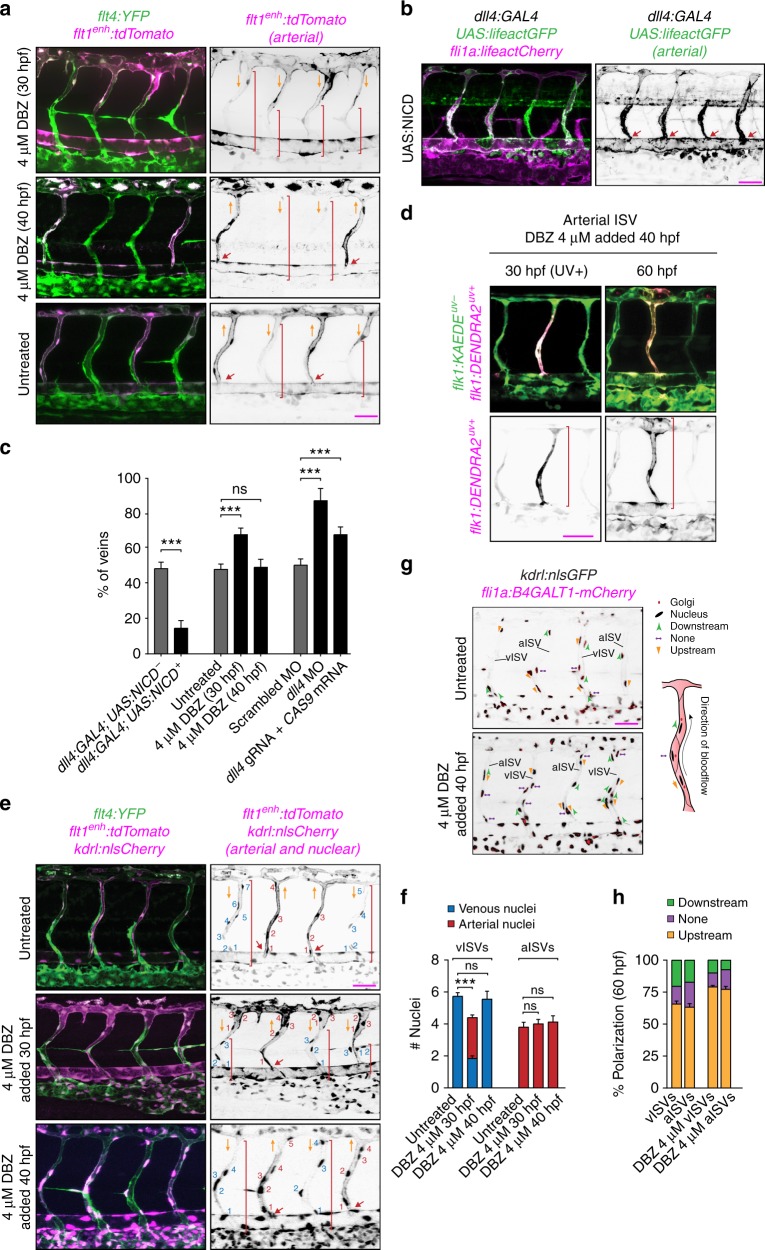
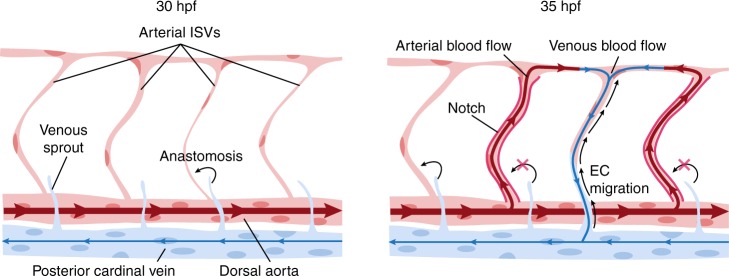
Arteries and veins are formed independently by different types of endothelial cells (ECs). In vascular remodeling, arteries and veins become connected and some arteries become veins. It is unclear how ECs in transforming vessels change their type and how fates of individual vessels are determined. In embryonic zebrafish trunk, vascular remodeling transforms arterial intersegmental vessels (ISVs) into a functional network of arteries and veins. Here we find that, once an ISV is connected to venous circulation, venous blood flow promotes upstream migration of ECs that results in displacement of arterial ECs by venous ECs, completing the transformation of this ISV into a vein without trans-differentiation of ECs. Arterial blood flow initiated in two neighboring ISVs prevents their transformation into veins by activating Notch signaling in ECs. Together, different responses of ECs to arterial and venous blood flow lead to formation of a balanced network with equal numbers of arteries and veins.


Conflict of interest statement

The authors declare no competing interests.

Figures

Fig. 1
Fig. 1
Blood flow controls vascular remodeling of the trunk. Panels in (b) and (d) show lateral images of zebrafish embryos at 60 hpf with anterior side facing left. Venous ECs are labelled with mCitrine and arterial ECs are labelled with mCitrine and tdTomato. Orange arrows indicate the direction of blood flow, red arrows point to arterial ISVs and red brackets highlight regions of venous ISVs without arterial ECs. Scale bars are 25 μm. The numbers are averages ± SEM from at least three independent experiments with a minimum of n = 25 animals per conditions per experiment. P < 0.001. a Schematic overview of intersegmental vasculature remodeling. DA dorsal aorta, PCV posterior cardinal vein, DLAV dorsal longitudinal anastomotic vessel, ISV intersegmental vessel. b Flow of blood was reduced by administering 3x MS222 at indicated time point. c Percentage of venous ISVs in embryos with reduced blood flow. d Viscosity of blood was reduced by morpholino knock down of gata1a or tif1γ which are required for the formation of erythrocytes. Erythrocytes are marked by dsRed. e Percentage of venous ISVs in embryos without erythrocytes
Fig. 2
Fig. 2
Displacement of arterial ECs by venous ECs in venous ISVs. Lateral images of zebrafish embryos with anterior side facing left. Orange arrows indicate the direction of blood flow through the ISVs. Scale bars are 25 μm. ac Representative images from four independent experiments. Venous ECs are labelled with lifeactCherry and arterial ECs are labelled with lifeactGFP and lifeactCherry. a Stills from Supplementary Movie 2. Red arrows point at an arterial EC migrating in a venous ISV, ventral part. b Stills from Supplementary Movie 2. Red arrows point at an arterial EC migrating in a venous ISV, dorsal part. c Stills from Supplementary Movie 4. Red arrows point at an arterial EC in an arterial ISV, ventral part. df Representative images from three independent experiments. All ECs express the photo-convertible (green-to-red) fluorescent protein DENDRA2. Red brackets highlight ECs with photo-converted DENDRA2. The photo-conversion was done at 30 hpf in the posterior cardinal vein (PCV) (d), a venous ISV (e) or an arterial ISV (f)
Fig. 3
Fig. 3
Upstream polarization and migration of ECs under flow. a Lateral images of zebrafish embryos with anterior side facing left. Orange arrows indicate the direction of blood flow through the ISVs. All ECs express nuclear-GFP and mCherry-fused marker of the Golgi. Planar polarization of ECs in ISVs is measured by the vector connecting the nucleus with the Golgi. Scale bar is 25 μm. b Quantification of EC planar polarization in venous and arterial ISVs (n = 10 embryos). c Positions of microtubule organization complexes (MTOCs) and nuclei in individual HUVECs and instantaneous velocities of HUVECs in a microfluidic perfusion chamber were monitored for 300 min after the exposure to flow with a shear stress of 7.2 dyn/cm2. Blue dashes show the values of the polarization angle, β, with 90° corresponding to polarization against the flow and β = −90°—polarization along the flow. Red circles show the values of the migration angle, β*, with 90° corresponding to migration against the flow and  −90°—migration along the flow. Grey line (ordinate on the right) show the average cell migration velocity in the upstream direction. d Phase images from Supplementary Movie 6 showing confluent HUVECs after 10 h under laminar flow with shear stresses of 0.23 and 14.5 dyn/cm2. Scale bar is 100 µm. e Average velocities of upstream migration for HUVECs exposed to different shear stresses as functions of time after the inception of shear flow (n = 250 to 600 for individual shear stresses). f Average velocities of upstream migration as functions of time after the inception of shear flow (n = 250). Arrows at the bottom (colors correspond to those of the velocity data points) indicate the time points at which the migration of cells against the flow becomes statistically significant (average upstream velocity becomes positive with p < 0.05)
Fig. 4
Fig. 4
Blood flow promotes EC migration in veins but not in arteries. Panels (c), and (e) show lateral images of zebrafish embryos with anterior side facing left. Orange arrows indicate the direction of blood flow. a Velocity of erythrocytes as a function of time within one heart beat (n = 16 vessels per condition; average of large number of heart beats per vessel). b Schematic representation of the dynamics of blood flow in the intersegmental vasculature. c All ECs express nuclear-localized GFP. Intersegmental vessels (yellow arrows) serve as reference points for determining the location of tracked arterial (red ovals) and venous (blue ovals) ECs. Scale bar is 30 μm. d Average displacements of ECs in the PCV (blue, n = 42, 6 embryos) and DA (red, n = 25, 6 embryos) as functions of time. Displacement of ECs was analyzed with at least 6 venous and 4 arterial ECs per embryo. Displacement is considered positive, if the cell migrates upstream. e All ECs express photo-convertible (green-to-red) fluorescent protein DENDRA2. The photo-conversion was done at 28 hpf in the DA and PCV. Red arrows point to an arterial EC and blue arrows point to a venous EC. Scale bar is 25 μm
Fig. 5
Fig. 5
Arterial blood flow activates Notch signaling in ISVs. Panels (ad) show lateral images of zebrafish embryos with anterior side facing left. ECs express lifeact-mCherry. Notch signaling is reported by the expression of destabilized GFP (d2GFP) under the control of 12xCSL Notch responsive elements. Red arrows point to arterial ISVs. Orange arrows indicate the direction of blood flow. White arrowheads highlight ISVs without blood flow. Scale bars are 25 μm. The numbers are averages ± SEM. P < 0.001. a Stills from Supplementary Movie 9. White arrowheads highlight ISVs without blood flow. Insets a’ and a” show expression of lifeactCherry (grey). Green arrows in the insets point to a venous sprout that did not anastomose with an arterial ISV. b Stills from Supplementary Movie 11. Green arrows point to venous sprouts. The sprout on the right detached from an ISV expressing d2GFP before a functional connection with the PCV was formed, as indicated by the extent of lumen formation (black arrow). c Green arrows highlight an ISV with above-the-average expression of d2GFP prior to initiation of blood flow. d Expression of Notch signaling reporter in embryos with reduced blood flow (60 hpf). e Quantification of the effect of a reduction in blood flow on d2GFP expression in arterial ISVs (60 hpf; n = 10 embryos per condition; 4–6 ISVs per embryo)
Fig. 6
Fig. 6
Notch signaling protects ISVs from transforming into veins. All images are representative from at least three independent experiments. Panels in (a), (b), (d), (e) and (g) show lateral images of zebrafish embryos with anterior side facing left. Embryos in (a), (b), (e) and (g) are 60 hpf. Red arrows point to arterial ISVs and red brackets highlight regions of venous ISVs without arterial ECs. Orange arrows indicate the direction of blood flow. Scale bars are 25 μm. All numbers are averages ± SEM from at least three independent experiments with a minimum of n = 25 animals per conditions per experiment. P < 0.001. a Inhibition of Notch signaling at different time points of the development. Venous ECs are labelled with mCitrine and arterial ECs are labelled with mCitrine and tdTomato. Red brackets highlight regions of venous ISVs without arterial ECs. b Ectopic expression of the Notch Intracellular Domain (NICD) specifically in arterial ECs. Venous ECs are labelled with lifeactCherry and arterial ECs are labelled with lifeactGFP and lifeactCherry. c The percentage of venous ISVs in embryos with perturbed Notch signaling. (At least three independent experiments with a minimum of n = 25 animals per conditions per experiment). d The inhibition of Notch does not affect EC migration in an arterial ISV. All ECs express the photo-convertible (green-to-red) fluorescent protein DENDRA2. Red brackets highlight ECs with photo-converted DENDRA2. The photo-conversion was done at 30 hpf in an arterial ISV. e The effect of inhibition of Notch on the number of ECs in ISVs. Arterial ECs express mCitrine, tdTomato and nuclear-Cherry, and venous ECs express mCitrine and nuclear-Cherry. Red brackets depict venous ECs in venous ISVs. f Number of arterial and venous ECs in arterial and venous ISVs in experiments with inhibition of Notch. g Notch inhibition does not affect EC polarization in ISVs. All ECs express nuclear-GFP and mCherry-fused marker of the Golgi. Planar polarization of ECs in ISVs is measured by a vector connecting the nucleus with Golgi. h Quantification of EC planar polarization in venous and arterial ISVs in experiments with inhibition of Notch
Fig. 7
Fig. 7
Summary Model. This model explains how blood flow-induced Notch signaling and endothelial migration enable the remodeling of all-arterial intersegmental vasculature into a network with ~1:1 ratio of arteries and veins

References

    1. Chen Q, et al. Haemodynamics-driven developmental pruning of brain vasculature in zebrafish. PLoS Biol. 2012;10:e1001374. doi: 10.1371/journal.pbio.1001374. - DOI - PMC - PubMed
    1. Price RJ, Less JR, Van Gieson EJ, Skalak TC. Hemodynamic stresses and structural remodeling of anastomosing arteriolar networks: design principles of collateral arterioles. Microcirculation. 2002;9:111–124. doi: 10.1080/713774059. - DOI - PubMed
    1. Hogan BM, Schulte-Merker S. How to plumb a pisces: understanding vascular development and disease using zebrafish embryos. Dev. Cell. 2017;42:567–583. doi: 10.1016/j.devcel.2017.08.015. - DOI - PubMed
    1. Isogai S, Lawson ND, Torrealday S, Horiguchi M, Weinstein BM. Angiogenic network formation in the developing vertebrate trunk. Development. 2003;130:5281–5290. doi: 10.1242/dev.00733. - DOI - PubMed
    1. Dela Paz NG, D’Amore PA. Arterial versus venous endothelial cells. Cell Tissue Res. 2009;335:5–16. doi: 10.1007/s00441-008-0706-5. - DOI - PMC - PubMed

Publication types

MeSH terms