

Tissue Concentrations of Zinc, Iron, Copper, and Magnesium During the Phases of Full Thickness Wound Healing in a Rodent Model
- PMID: 30552609
- PMCID: PMC6656798
- DOI: 10.1007/s12011-018-1600-y
Tissue Concentrations of Zinc, Iron, Copper, and Magnesium During the Phases of Full Thickness Wound Healing in a Rodent Model
Abstract
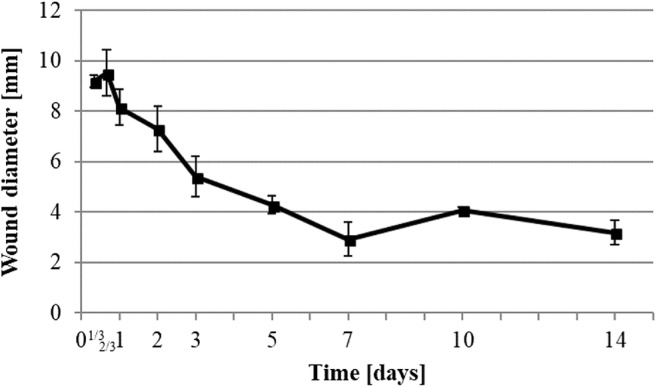
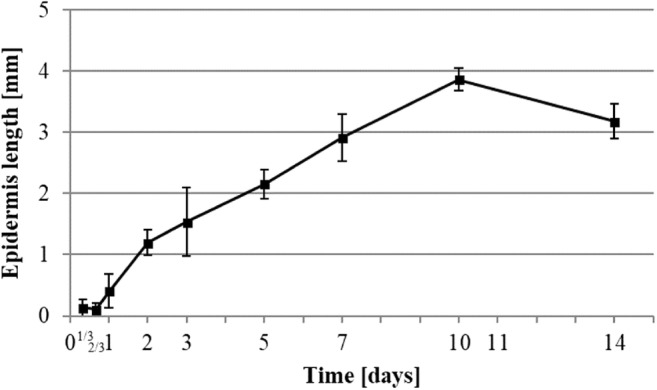
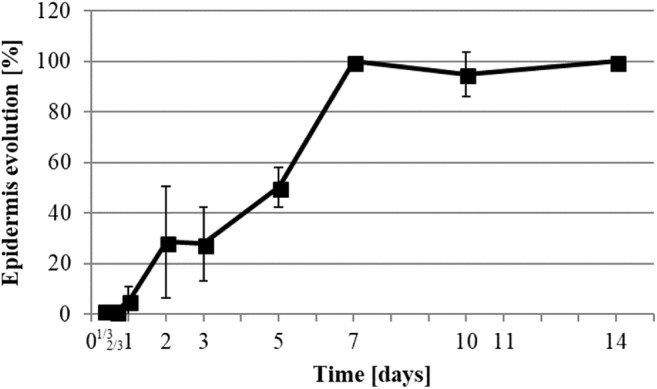
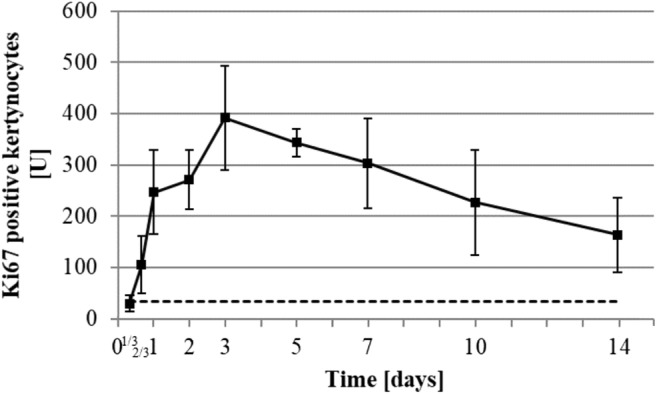
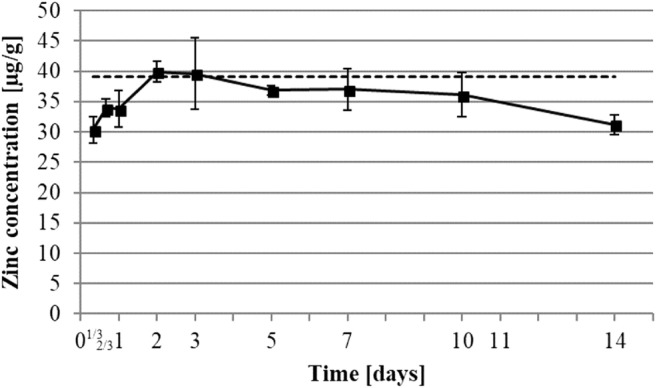
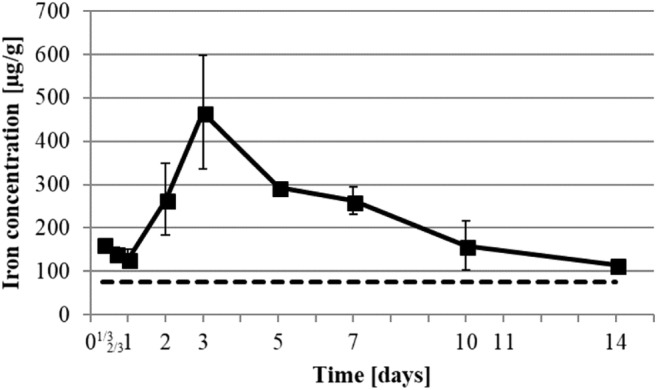
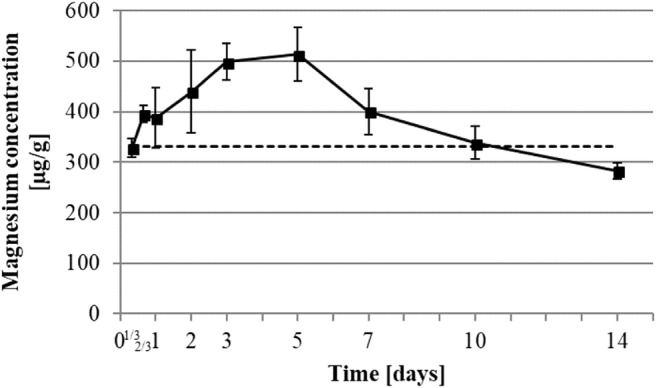
Wound healing is a complex orchestration of processes involving cell proliferation, migration, differentiation, anabolism, and catabolism in order to restore skin continuity. Within these processes, elements such as metallic ions are involved due to their implications in cell behavior and enzymatic activity regulation. This study analyzed the kinetics of zinc, iron, copper and magnesium concentrations in a full thickness open wound rat model over 14 days. We made wounds with a diameter of 6 mm on the back of Lewis rats and let them heal naturally prior to analysis by histology and inductively coupled plasma mass spectrometry analysis. Histological and immunofluorescence analysis confirmed an inflammation phase until 7 days, epithelial proliferation phase from 16 h to 10 days, and remodeling phase from 7 days onward. These defined phases were correlated with the measured metal element kinetics. Zinc concentrations showed an inverted parabolic progression between 30.4 and a maximum of 39.9 μg/g dry weight. Magnesium values had a similar pattern between 283 and 499 μg/g dry weight. Copper concentrations, on the other hand, followed an inverted sigmoid trend with a decrease from 9.8 to 1.5 μg/g dry weight. Iron had a slight decrease in concentration for 24 h followed by an increase to a maximum of 466 μg/g dry weight. In conclusion, zinc, iron, and copper, even though differing in their total mass within the wound, exhibited concentration curve transitions at day 3. Interestingly, this time point correlates with the maximum proliferating keratinocyte rate during the proliferation phase.
Keywords: Copper; Iron; Magnesium; Metal; Skin wound healing; Zinc.
Conflict of interest statement
The authors declare that they have no conflict of interest.
Figures

References
-
- Freeman L, Pethe RS, Hollander J. Update on wound management: evidence-based strategies for optimizing outcomes. Emerg Med Rep. 2002;23(26):315–328.
-
- Mirastschijski U, Jokuszies A, Vogt PM. Skin wound healing: repair biology, wound, and scar treatment. Plastic surgery. 3. Philadelphia: Elsevier Saunders; 2013. pp. 267–296.
-
- Razzaghi R, Pidar F, Momen-Heravi M, Bahmani F, Akbari H, Asemi Z. Magnesium supplementation and the effects on wound healing and metabolic status in patients with diabetic foot ulcer: a randomized, double-blind, placebo-controlled trial. Biol Trace Elem Res. 2018;181(2):207–215. doi: 10.1007/s12011-017-1056-5. - DOI - PubMed
MeSH terms
Substances
Grants and funding
LinkOut - more resources
Full Text Sources
Medical
Molecular Biology Databases
