. 2019 Feb 1;446(1):102-118.
doi: 10.1016/j.ydbio.2018.12.014. Epub 2018 Dec 13.

Live imaging reveals hub cell assembly and compaction dynamics during morphogenesis of the Drosophila testis niche

Affiliations

Live imaging reveals hub cell assembly and compaction dynamics during morphogenesis of the Drosophila testis niche

Lauren Anllo et al. Dev Biol. .

Abstract

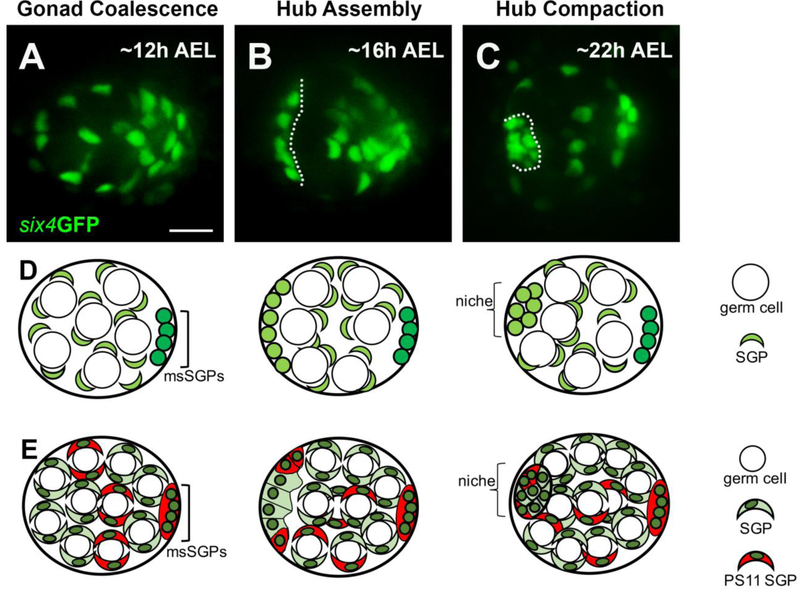
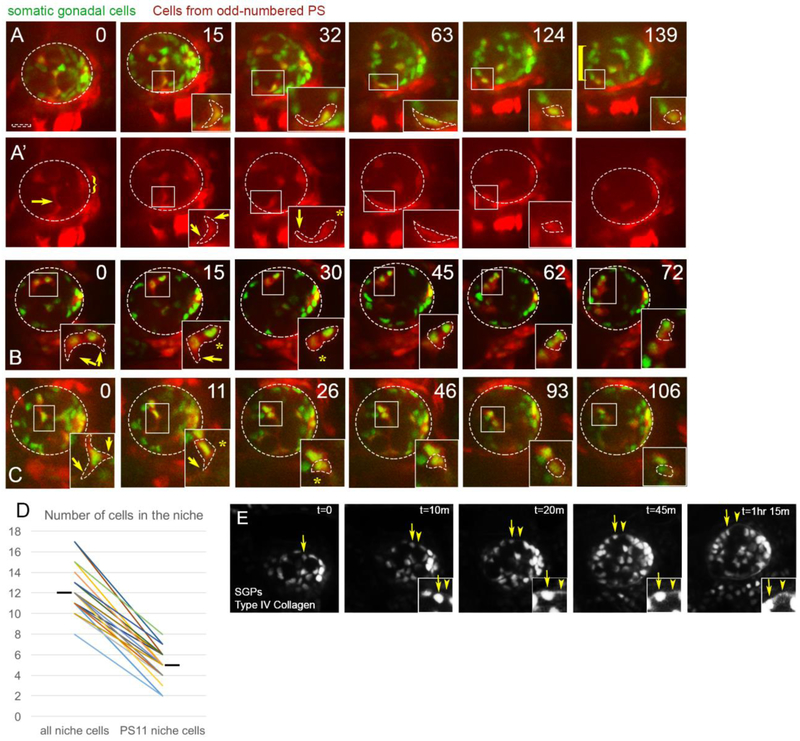
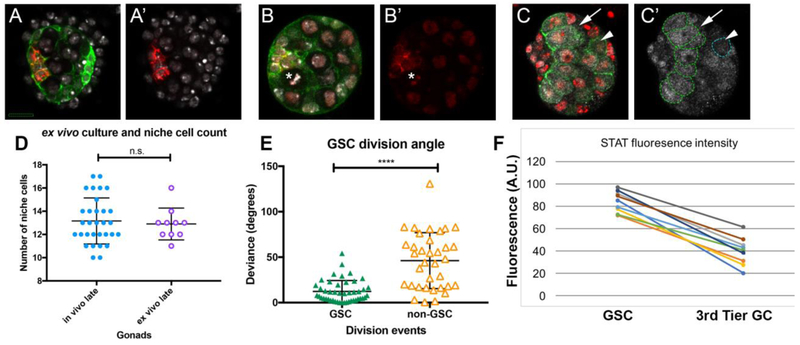
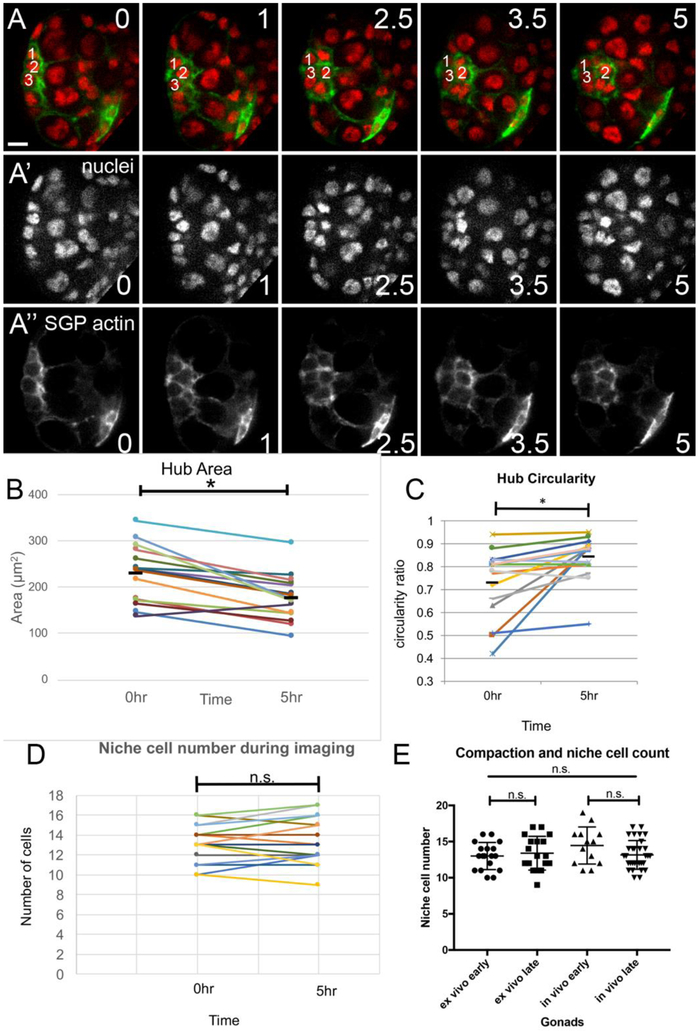
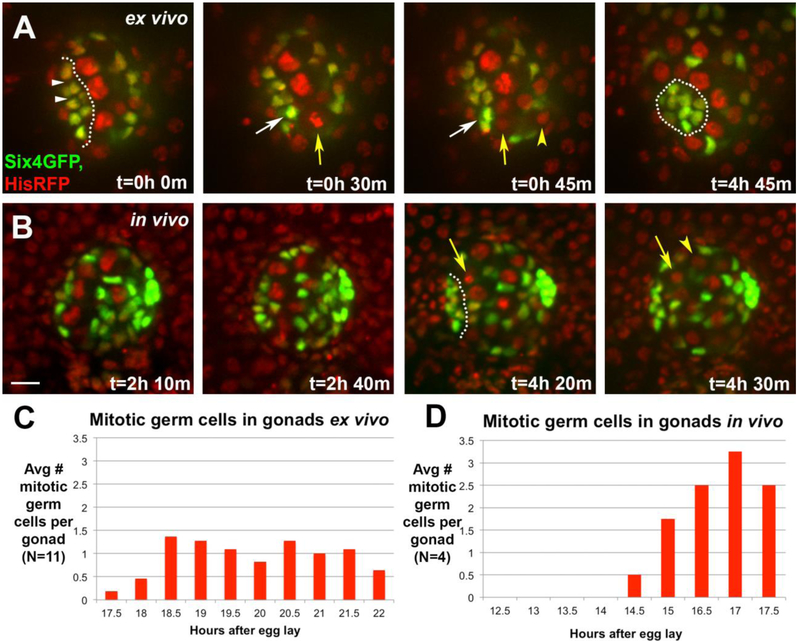
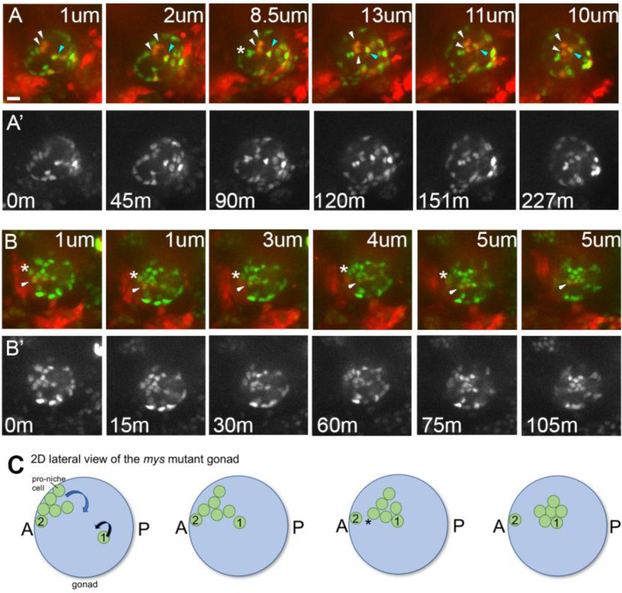
Adult stem cells are often found in specialized niches, where the constituent cells direct self-renewal of their stem cell pool. The niche is therefore crucial for both normal homeostasis and tissue regeneration. In many mammalian tissues, niche cells have classically been difficult to identify, which has hampered any understanding of how tissues first construct niches during development. Fortunately, the Drosophila germline stem cell (GSC) niche is well defined, allowing for unambiguous identification of both niche cells and resident stem cells. The testis niche first forms in the early embryo, during a late stage of gonadogenesis. Here, using live-imaging both in vivo and ex vivo, we follow pro-niche cells as they assemble and assume their final form. We show that after ex vivo culture the niche appears fully functional, as judged by enrichment of adhesion proteins, the ability to activate STAT in adjacent GSCs, and to direct GSCs to divide orthogonally to the niche, just as they would in situ. Collectively, our imaging has generated several novel insights on niche morphogenesis that could not be inferred from fixed images alone. We identify dynamic processes that constitute an assembly phase and a compaction phase during morphogenesis. The compaction phase correlates with cell neighbor exchange among the assembled pro-niche cells, as well as a burst of divisions among newly recruited stem cells. Before compaction, an assembly phase involves the movement of pro-niche cells along the outer periphery of the gonad, using the extracellular matrix (ECM) to assemble at the anterior of the gonad. Finally, live-imaging in integrin mutants allows us to define the role of pro-niche cell-ECM interaction with regard to the new assembly and compaction dynamics revealed here.

Keywords: Drosophila testis stem cell niche; Gonadogenesis; Niche morphogenesis.


Figures

Figure 1:
Figure 1:. Live-imaging reveals the stages of hub formation. A – C)
Three stages of niche formation: Gonad Coalescence, Hub Assembly, and Hub Compaction are shown using a selected still from live-imaging of six4GFPnls (green), which marks all SGPs. A) A view of a coalesced gonad, imaged in vivo at 12h AEL, showing that SGPs were relatively dispersed, intermingled with germ cells (large negatively-marked spaces). B) A view of a gonad at Hub Assembly, imaged in vivo at 16h AEL, showing that a subset of SGPs had assembled at the anterior forming the prospective hub (left of dotted line), and had recruited a tier of prospecive germline stem cells (negative space; GSCs). C) A view of a gonad after Hub Compaction, imaged ex vivo at 22 h AEL. D, E) For each of the three stages, two schematics, each at an increasing level of detail, are drawn directly below their respective live image view. The schematics are labeled using the same terms as in the text, and a key is shown along the right hand side. All SGPs, green; msSGPs, bright green. In E), in addition to all SGPs (green), this series marks PS 11 cells and msSGPs (red). Some PS11 cells will assemble with PS10 cells as a pro-niche. Scale bar is 10 microns.
Figure 2:
Figure 2:. PS11 hub cells migrate anteriorly along the periphery.
Representative stills (time in minutes) from live imaging of six4-nlsGFP marking all SGPs (green) and Prd-GAL4>tdTomato to mark SGPs originating from PS11 (red). Scalebar is 10 microns. A) Merge, and A’) Prd>tdTomato channel alone. At Time 0 before anterior movement of pro-niche cells, tdTomato is expressed only in a central column of SGPs (originating from PS11) and the posterior msSGPs (from PS13, bracket), and not SGPs from even-numbered parasegments. The stills in this time series were from Z-slices at mid-depth within the gonad (13-16 um in from the periphery of the gonad (26.5 um represents full depth in this gonad)). At Time 0 a PS11 hub cell can be seen extending a protrusion towards the gonad periphery, and moving on to it. This same cell also has a trailing extension that is likely wrapped around a germ cell (arrow). As this cell moves to the lower edge of the gonad, it is moving from within the internal milieu of the gonad to the periphery. This cell is followed from time 0 through 139 min, and the boxed region is magnified in the inset, where the cell body is outlined. A trailing extension visible at Time 0 and 15 min, is retracted by 32 min (asterisk), while the anterior extension persists as the cell moves along the gonad periphery (arrow). By 124min, this PS11 cell has joined the anterior assembly of pro-niche cells, and retracted its anterior extension.B) Two PS11 pro-niche cells (inset) that were already located on the gonad periphery at the start of imaging. Both cells migrated anteriorly and ended in assembly (72 min) with a third PS11 pro-niche cell, and two nonPS11 SGPs (expressing six4-nlsGFP, but not Prd>tdTomato). Both PS11 cells intially had cytoplasmic protrusions surrounding a germ cell (0min; arrows) that were subsequently retracted (asterisks, 15 and 30min). (C) The inset initially focuses on one peripheraly located PS11 pro-niche cell, with cytoplasmic protrusions surrounding a germ cell (arrows, 0min) that were retracted (asterisk, 11min) or remodeled (0 – 26min, asterisk) as the cell moved anteriorly. Pro-niche cells tracked in (B) and (C) were visible in the first z-slice containing cells from their region of the gonad; i.e., within 1 micron of the gonad periphery. (D) Quantification of total niche cells and PS11 niche cells in each gonad imaged (n = 22; hashmark, mean). Connectors pair data collected from each gonad. A larger contribution from PS 11 did not always correlate with a larger niche. E) Basement membrane is desposited during hub assembly. Live-imaging of SGPs (six4-nlsGFP) simultaneously with Collagen::GFP to monitor depositon of ECM. A PS11 pro-hub cell moves out to and then along the periphery arrow). ECM was detectable by the time the PS11 cell reached the periphery (t=10m and onward, arrowhead; and insets).
Figure 3:
Figure 3:. An alary muscle is located near the niche.
A) Live-imaging AbdA>tdTomato revealed a Y-shaped structure anterior to assembled hub (dotted line, six4-nlsGFP). B) Tup> tdTomato identified the structure as an alary muscle (AM); one located at the anterior and one at the posterior of the gonad (arrowheads). C) tupAME-moe::GFP specifically marked the AM (arrowhead), which was present as pro-hub cells assembled (outline, six4-nlsGFP). (D, D’) Control embryo carrying tupAME-GAL4>GFP, stained with Traffic jam to mark the gonad. D) A control embryo with GFP under control of the AME driver, revealing the position of the alary muscles. E, E’) Embryo with Alary muscles ablated by tupAME-GAL4>Grim, GFP. Lone GFP+ cells are likely pycnotic, unfused alary muscle precursors. Dissected gonads from control (F) and alary ablated (G) embryos, stained for germ cells (Vasa, red) and hub cells (FIII, white). Ablation did not disrupt niche formation, which was consistently at the gonad anterior, located opposite the msSGPs (not shown in the image). (H) Quantification of niche morphology from control and ablated embryos. Scale bars are 10 microns.
Figure 4:
Figure 4:. The hub often adopts an internal tilt, relative to A-P axis of embryo.
A, B, C)The final time point from a movie visualizing niche assembly (six4-nlsGFP). Each sequence shows Z slices starting from the external region of the gonad, and moving more internally, with the fractional position along the external-internal gonad axis indicated (0, most external; 1, most internal). Niche cells (arrow), msSGPs (asterisk), and either trachea (A, C; breathless>GFP, blue arrowhead), or the Alary (C; tupAME-GFP, blue arrowhead). Scale bar is 10 microns. D) Frequency distribution of the tilt of the niche. E) Schematic of an embryo showing a dorsal view of the gut, the gonads, and an internally tilted niche in each gonad.
Figure 5:
Figure 5:. ex vivo culture enables analysis of niche compaction.
A, A’) Gonad expressing six4-Moe-GFP to visualze F-actin enrichment at SGP cell cortices (green), cultured ex vivo for ~5 hours, then post-fixed and stained for the niche (FasIII, red), and nuclei (Hoechst, white). FasIII accumulated properly at niche cell boundaries (not all boundaries are visible in this section). Hub cells and, especially, msSGPs at posterior of gonad accumulate higher levels of F-actin than other SGPs. B, B’) Gonad from an embryo expressing six4-Moe-GFP (green) and HistoneRFP (red), cultured ex vivo for ~5 hours, then post-fixed and stained for ECad (red), and Hoechst (white), also revealing nuclei. E-cad accumulated as expected among niche boundaries (red). Note the metaphase plate of a GSC (asterisk); a division plane perpendicular to the hub-GSC interface, as expected. C, C’) Gonad expressing nos-Moe-GFP to visualize F-actin in germ cells (green), cultured ex vivo for ~5 hours, then post-fixed and stained for STAT92E (white), and nuclei (Hoechst, white), nos-Moe-GFP outlines all germ cells. A GSC (arrow) and a non-GSC (arrowhead, blue dotted line) are marked. Germ cells in contact with the niche in this slice are outlineed with a green dotted line, and represent GSCs. D) Niche cell number (FasIII) per gonad (circles), comparing cases where the niche developed fully in vivo (dissected from late-stage embryos, ~23h AEL, blue closed circles), to gonads cultured ex vivo until the compact architecture was achieved (purple open circles). E) For GSCs (n=46, green closed triangles) and non GSCs (n=35, orange open triangles), the graph plots the deviation of each division from an idealized axis perpendicular to the niche-GSC boundary. F) Average STAT accumualtion (arbirtrary units) in ex vivo culture, comparing the GSC tier to germ cells removed from the hub/GSC boundary (3rd tier germ cells). Connectors report values from the same gonad. In D,E bars represent mean and standard deviation; n.s., not significant; ****, p < 0.0001. For A-C, scale bar is 10 microns.
Figure 6:
Figure 6:. After compaction the hub occupies a smaller area and forms smoother boundaries facing the GSC tier.
A) ex vivo culture during compaction, showing all nuclei (HistoneRFP, red; single channel, A’), and F-actin in SGPs (six4-moesin-GFP; green, single channel, A”). The prospective hub is outlined, with three, cells labeled that were tracked. These cells exchanged neighbor relationships during compaction (t=0 through t=2.5hr). msSGPs, which exhibit higher F-actin, are labled (asterisk). Scale bar is 10 microns. B - D) Gonads were cultured ex vivo, and measured before Compaction (time =0) and after Compaction was completed (5hr), with connectors reporting values from the same gonad. B) Hub area showed a significant decrease (p < 0.05). C) The hub-GSC boundary became significantly smoother, reflected in increased circularity. Several niches exhibited fairly substantial changes. D) Niche cell number remained relatively constant during compaction, while area was decreasing and circularity was increasing. E) A direct comparison revealed no differences to niche cell number between ex vivo culture and in vivo development. Ex vivo early and late are the 0 and 5hr time points from (D). The in vivo samples are from gonads that were dissected and immediately fixed and stained, either early before compaction (~16h AEL), or late, after compaction was completed (~23h AEL).
Figure 7:
Figure 7:. There is a burst in germline divisions during hub compaction.
A) An ex vivo timelapse, monitoring SGPs (six4-nlsGFP) and all nuclei (HistoneRFP). At t=0, the pro-hub is just passed initial assembly, and covers an extended region (outline). Its nuclei are separated by negative space (white arrowheads). A GSC enters metaphase (t=30min, yellow arrow) and then anaphase (t=45min, arrow and arrowhead mark daughters), with division orthogonal to the hub-GSC interface. Coincident with anaphase, the hub cell nucleus (white arrow) nearest the dividing GSC, moves closer to its neighbor (compare internuclear distance at t=30 and 45min). By the end of the timelapse, the hub has compacted with less negative space among hub cell nuclei (t=4h 45min, outline). B) An in vivo timelapse of a gonad monitoring SGPs (six4-nlsGFP) and all nuclei (HistoneRFP). The initial panels show a stage just prior to and at assembly (t=2h 10min – 2h 40min). After assembly, a GSC divided orthogonal to the hub (t=4h 20min – 4h 30min, arrow; daughter cell marked by arrowhead). For A-B, scale bar is 10 microns. C, D) Quantification of mitotic germ cells by stage, comparing gonads imaged ex vivo (C) and in vivo (D). Compaction begins ~16h AEL, and is completed by ~23h AEL.
Figure 8:
Figure 8:. Integrin mutants exhibit defects in niche morphogenesis.
A-B) In intergrin mutants niche cells begin assembly, with most cells relocating to the anterior periphery of the gonad, but then dropping internally. A, B) Selected stills from two different in vivo time series of myospheroid mutants, imaged to follow all SGPs (six4nlsGFP), and PS11 SGPs (prd>tdTomato). A, B, merge; A’, B’ single six4nlsGFP channel. Each frame is taken at a different depth into the gonadal sphere, with the distance in from the periphery marked for each panel in microns (um; minutes, m).Scale bar is 10 microns. A) t=0, an assembly phase gonad, with the pro-hub consisting of a mix of PS10 cells (green only, 5 cells visible) and PS11 cells (red+green, 2 visible). Within 45 minutes, the assembled niche began to internalize before completing compaction. Over the next 2 hours, two PS11 SGPs (white arrowheads) dropped inwards; note the section depth changing from 1 to 13 um. Simultaneously, another PS11 SGP (blue arrowhead), which had not assembled at the anterior, migrated in and joined the internalizing niche. Lastly, between 45min and 90 min three orignially assembled PS10 SGPs separated (asterisk), with two internalizing and one remaining peripheral. B) Shows a partial, face-on view of the niche, just after initial assembly. A PS11 SGP was initally on the periphery of the gonad, but was internalized as the niche dropped inwards (arrowhead). Similar to the case shown in ‘A’, internalization began before compaction was completed. Note also that an adjacent PS10 SGP that remained on the gonad periphery (asterisk) and did not internalize with the rest of the pro-niche cells. C) A schematic of a mys mutant gonad depicting various defects observed in live imaging of panels A and B. In this lateral, 2D view, only relevant proniche cells are shown. Of seven pro-niche cells (green), 6 have asembled at the anterior. These cells are all on the gonad periphery (left panel), which is difficult to convey in 2D. Five of these cells leave the periphery and move internally over time (curved blue arrow), similar to the case shown in panels A-B. The cluster adopts a more compact form only after it internalizes (i.e., by the fourth frame). Note also that one proniche cell, Cell #1, never migrated to the anterior. Instead, it migrates into the milieu of the gonad (curved black arrow) from its initially more posterior position, and joins the five internalizing niche cells (frames 2 -4). This behavior is similar to the the cell marked by the blue arrowhead in ‘A’. Finally, of the six cells that assembled at the anteior only five leave the gonad periphery. Cell #2 is left behind at the gonad periphery during internalization of the niche. This behavior is similar to the cell marked by an asterisk in ‘B’.

References

    1. Morrison SJ & Spradling AC Stem Cells and Niches : Mechanisms That Promote Stem Cell Maintenance throughout Life. Cell 132, 598–611 (2008). - PMC - PubMed
    1. Yan KS et al. The intestinal stem cell markers Bmi1 and Lgr5 identify two functionally distinct populations. Proc. from Natl. Acad. Sci. 109, 466–471 (2011). - PMC - PubMed
    1. Takeda N et al. Interconversion between intestinal stem cell populations in distinct niches. Science 334, 1420–4 (2011). - PMC - PubMed
    1. Calvi LM et al. Osteoblastic cells regulate the haematopoietic stem cell niche. Nature 425, 841–846 (2003). - PubMed
    1. Sasaki N, Sachs N, Wiebrands K, Ellenbroek SIJ & Fumagalli A Reg4 + deep crypt secretory cells function as epithelial niche for Lgr5 + stem cells in colon. Proc. from Natl. Acad. Sci E5399–E5407 (2016). doi: 10.1073/pnas.1607327113 - DOI - PMC - PubMed

Publication types

MeSH terms

Substances