. 2019 Feb 7;9(2):513-522.
doi: 10.1534/g3.118.200803.

Metformin Affects Heme Function as a Possible Mechanism of Action

Affiliations

Metformin Affects Heme Function as a Possible Mechanism of Action

Xiyan Li et al. G3 (Bethesda). .

Abstract

Metformin elicits pleiotropic effects that are beneficial for treating diabetes, as well as particular cancers and aging. In spite of its importance, a convincing and unifying mechanism to explain how metformin operates is lacking. Here we describe investigations into the mechanism of metformin action through heme and hemoprotein(s). Metformin suppresses heme production by 50% in yeast, and this suppression requires mitochondria function, which is necessary for heme synthesis. At high concentrations comparable to those in the clinic, metformin also suppresses heme production in human erythrocytes, erythropoietic cells and hepatocytes by 30-50%; the heme-targeting drug artemisinin operates at a greater potency. Significantly, metformin prevents oxidation of heme in three protein scaffolds, cytochrome c, myoglobin and hemoglobin, with Kd values < 3 mM suggesting a dual oxidation and reduction role in the regulation of heme redox transition. Since heme- and porphyrin-like groups operate in diverse enzymes that control important metabolic processes, we suggest that metformin acts, at least in part, through stabilizing appropriate redox states in heme and other porphyrin-containing groups to control cellular metabolism.

Keywords: diabetes; heme; hemoprotein; mechanism of action; metformin; porphyrin; redox.


Figures

Figure 1
Figure 1
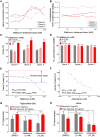
Metformin modulates growth and heme production in yeast. Cell growth was continuously monitored by absorption at 600 nm (A600) for the haploid strain BY4741 (A-C, N = 6) and the diploid strain BY4743 (D-F, N = 6) cells incubated with metformin at different concentrations from 0-200 mM (A, D) and 0-5 mM (B, E). The endpoint A600 after 16 h incubation was determined by a light spectrometer (C, F). The relative heme content of yeast cells after metformin treatment was determined by oxalic acid method (G, N = 3, also see Materials and Methods). The growth of wild-type control (BY4741, H) and a mitochondria-deficient mutant strain mip1Δ (I) was also affected by metformin (N = 3), and the corresponding relative heme content (J) and biomass (K) were also determined. P values were given for unpaired Welch’s t-test. ns = not significant; *, P < 0.05; **, P < 0.01; ***, P < 0.001; ****, P < 0.0001. Error bars = SEM.
Figure 2
Figure 2
Metformin modulates heme in human cells. The heme content (A) and cell vitality (CellTiter-Glo luminescence) (B) of human erythrocytes were determined after incubation with metformin at varying levels for 24 hr. The relative heme levels (C, technical N = 8) and cell vitality (D, technical N = 4) in human blood cells were compared with unpaired Welch’s t-test and the significance was indicated as: ns, not significant; *, P < 0.05; **, P < 0.01; ***, P < 0.001; ****, P < 0.0001. The relative heme content in cultured K562 cells, a line of hematopoietic lineage, was determined after treatment with metformin (E) or anti-malaria drug artemisinin (F) for 16 hr, one representative curve from two experiments is shown for each drug. Effective concentration at 50% effect (EC50), correlation coefficient (R2) and max inhibition were calculated after curve-fitting to single inhibitor model. The triglyceride (G) and heme levels (H) in human liver cells (HepG2) were determined after metformin and artemisinin treatment under normal and high glucose (6 mg/ml) conditions, P values from unpaired t-test were indicated as: ns, not significant; *, P < 0.05; for duplicate results (N = 2).
Figure 3
Figure 3
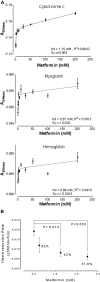
Metformin suppresses heme oxidation and heme-enzyme activity. The absorption at specific wavelength was used to measure the reduced form of cytochrome c, myoglobin, and hemoglobin upon incubation with metformin at ambient conditions for 5, 2, and 1 day(s), respectively (A). Affinity constant (Kd), R2, and Sy.x (equivalent to standard error of regression) were based on curve fitting to a one-side binding model, N = 4. The initial enzymatic rate of rabbit liver NADPH-cytochrome c reductase was modulated by metformin (B), P values were from Unpaired Welch’s t-test (N = 3-5).
Figure 4
Figure 4
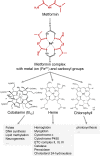
Model for mechanisms of action of metformin. A summary of the mechanism(s) of metformin action is presented.

Similar articles

Cited by

References

    1. Abu-el-wafa S. M., El-ries M. A., Ahmed F. H., 1987. Formation of Metformin Complexes with Some Transition-Metal Ions - Their Biological-Activity. Inorganica Chimica Acta-Bioinorganic Chemistry 136: 127–131. 10.1016/S0020-1693(00)81143-3 - DOI
    1. Andersson L. C., Nilsson K., Gahmberg C. G., 1979. K562–a human erythroleukemic cell line. Int. J. Cancer 23: 143–147. 10.1002/ijc.2910230202 - DOI - PubMed
    1. Aroda V. R., Edelstein S. L., Goldberg R. B., Knowler W. C., Marcovina S. M., et al. , 2016. Long-term Metformin Use and Vitamin B12 Deficiency in the Diabetes Prevention Program Outcomes Study. J. Clin. Endocrinol. Metab. 101: 1754–1761. 10.1210/jc.2015-3754 - DOI - PMC - PubMed
    1. Balzi E., Goffeau A., 1995. Yeast multidrug resistance: the PDR network. J. Bioenerg. Biomembr. 27: 71–76. 10.1007/BF02110333 - DOI - PubMed
    1. Callaghan T. S., Hadden D. R., Tomkin G. H., 1980. Megaloblastic anaemia due to vitamin B12 malabsorption associated with long-term metformin treatment. BMJ 280: 1214–1215. 10.1136/bmj.280.6225.1214 - DOI - PMC - PubMed

Publication types

LinkOut - more resources