. 2019 Jun 15;199(12):1517-1536.
doi: 10.1164/rccm.201712-2410OC.

Single-Cell Transcriptomic Analysis of Human Lung Provides Insights into the Pathobiology of Pulmonary Fibrosis

Affiliations

Single-Cell Transcriptomic Analysis of Human Lung Provides Insights into the Pathobiology of Pulmonary Fibrosis

Paul A Reyfman et al. Am J Respir Crit Care Med. .

Abstract

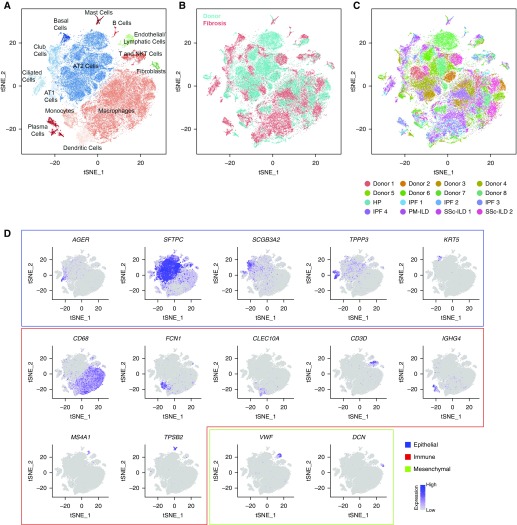
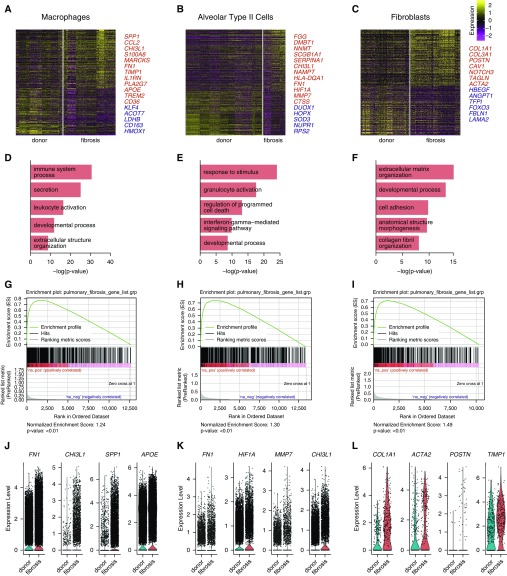
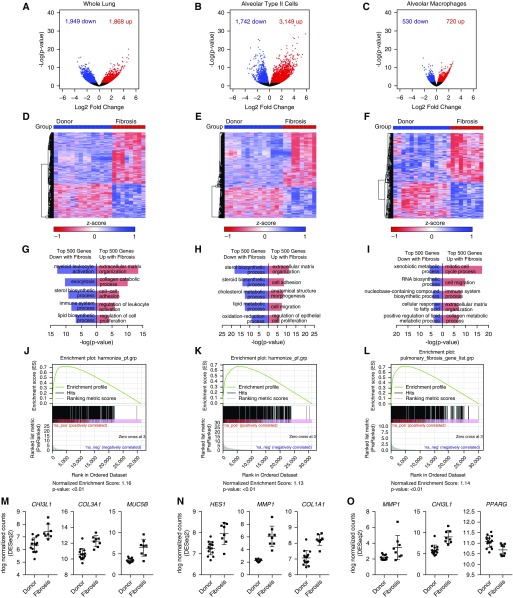
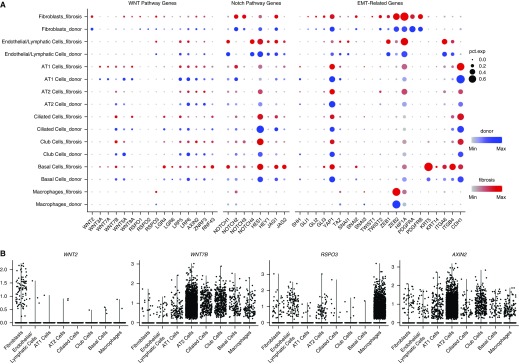
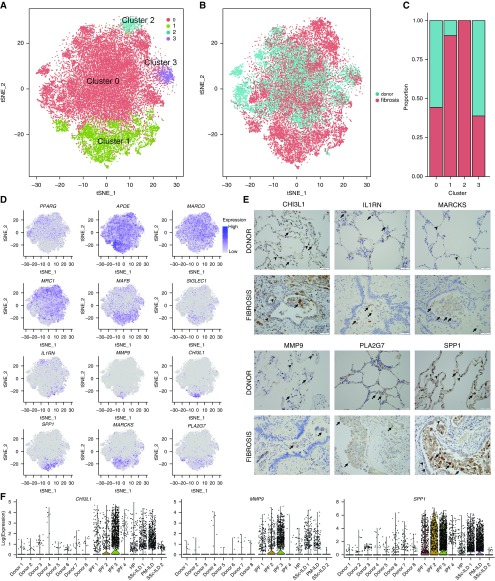
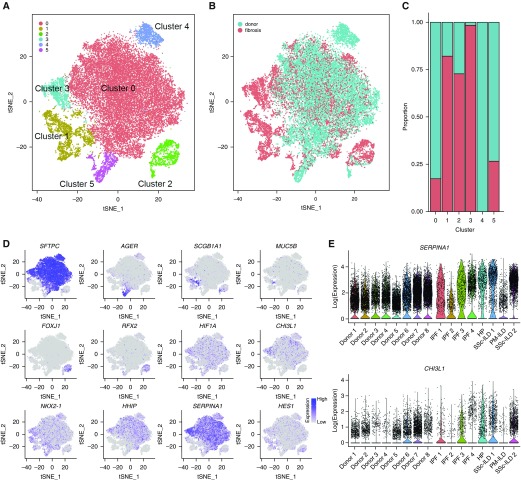
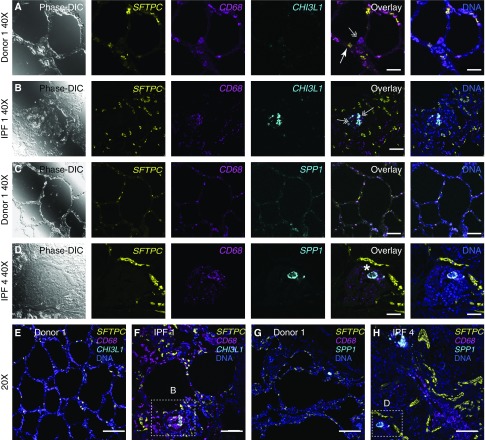
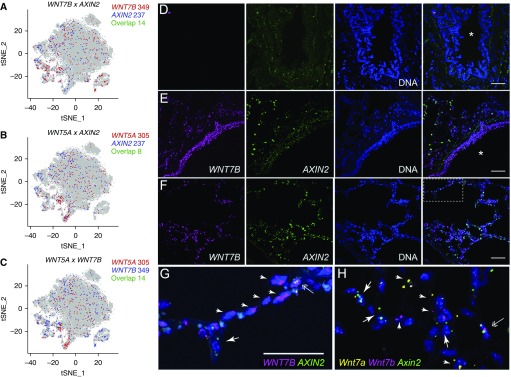
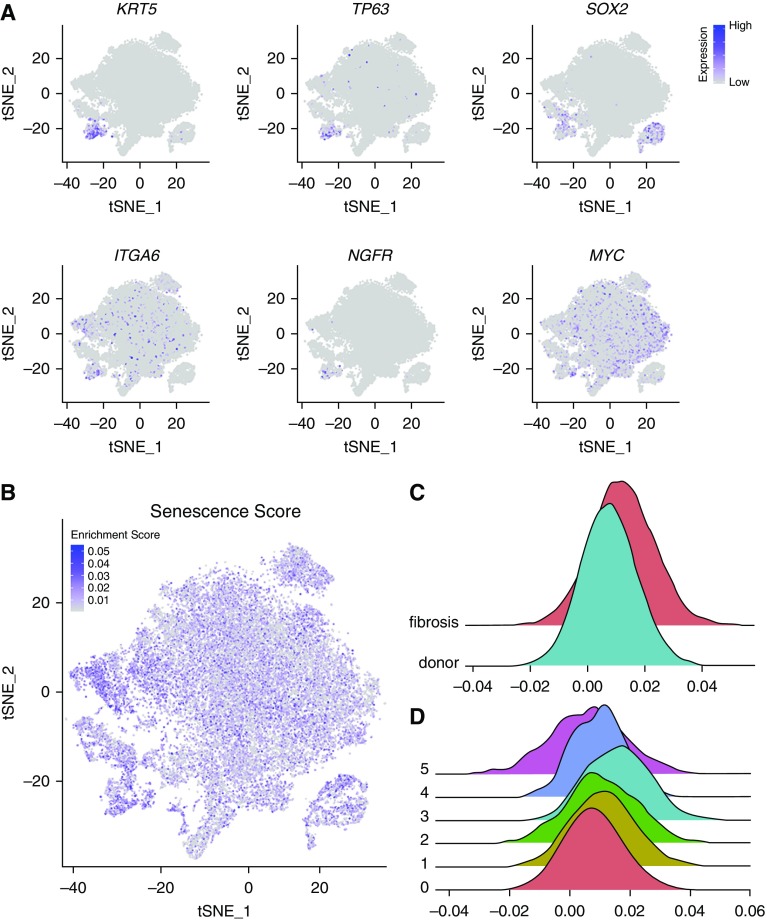
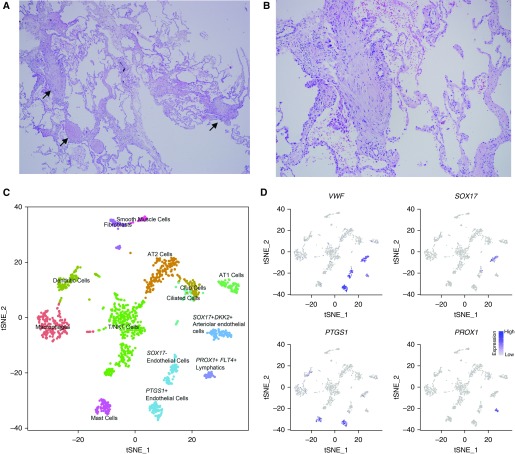
Rationale: The contributions of diverse cell populations in the human lung to pulmonary fibrosis pathogenesis are poorly understood. Single-cell RNA sequencing can reveal changes within individual cell populations during pulmonary fibrosis that are important for disease pathogenesis. Objectives: To determine whether single-cell RNA sequencing can reveal disease-related heterogeneity within alveolar macrophages, epithelial cells, or other cell types in lung tissue from subjects with pulmonary fibrosis compared with control subjects. Methods: We performed single-cell RNA sequencing on lung tissue obtained from eight transplant donors and eight recipients with pulmonary fibrosis and on one bronchoscopic cryobiospy sample from a patient with idiopathic pulmonary fibrosis. We validated these data using in situ RNA hybridization, immunohistochemistry, and bulk RNA-sequencing on flow-sorted cells from 22 additional subjects. Measurements and Main Results: We identified a distinct, novel population of profibrotic alveolar macrophages exclusively in patients with fibrosis. Within epithelial cells, the expression of genes involved in Wnt secretion and response was restricted to nonoverlapping cells. We identified rare cell populations including airway stem cells and senescent cells emerging during pulmonary fibrosis. We developed a web-based tool to explore these data. Conclusions: We generated a single-cell atlas of pulmonary fibrosis. Using this atlas, we demonstrated heterogeneity within alveolar macrophages and epithelial cells from subjects with pulmonary fibrosis. These results support the feasibility of discovery-based approaches using next-generation sequencing technologies to identify signaling pathways for targeting in the development of personalized therapies for patients with pulmonary fibrosis.

Keywords: RNA sequencing; alveolar macrophages; alveolar type II cells; pulmonary fibrosis.


Figures

Figure 1.
Figure 1.
Integrated single-cell RNA-Seq analysis of patients with pulmonary fibrosis identifies diverse lung cell populations. Single-cell RNA-Seq was performed on single-cell suspensions generated from eight lung biopsies from transplant donors and eight lung explants from transplant recipients with pulmonary fibrosis. All 16 samples were analyzed using canonical correlation analysis within the Seurat R package. Cells were clustered using a graph-based shared nearest neighbor clustering approach and visualized using a t-distributed Stochastic Neighbor Embedding (tSNE) plot. (A) Cellular populations identified. (B) Cells on the tSNE plot of all 16 samples were colored as originating either from a donor or from a patient with pulmonary fibrosis. (C) Each population included cells from donors and patients with pulmonary fibrosis. (D) Canonical cell markers were used to label clusters by cell identity as represented in the tSNE plot. Cell types were classified as epithelial, immune, or mesenchymal as indicated in the legend. AT1 = alveolar type I; HP = hypersensitivity pneumonitis; ILD = interstitial lung disease; IPF = idiopathic pulmonary fibrosis; NK = natural killer; PM = polymyositis; SSc = systemic sclerosis.
Figure 2.
Figure 2.
Differential expression analysis of single-cell RNA-Seq data from normal and fibrotic lungs identifies genes characteristic of pulmonary fibrosis. (AC) Differential expression analysis was performed comparing cells from normal and fibrotic lungs within macrophages, alveolar type II cells, and fibroblasts (Wilcoxon rank sum test as implemented within Seurat toolkit). Heatmaps are shown representing the upregulated and downregulated genes in macrophages, alveolar type II cells, and fibroblasts, highlighting genes involved in fibrosis. The full table of genes is found in Table E3. (DF) Functional enrichment analysis with GO Biological Processes was performed using GOrilla with the significantly upregulated genes in cells from fibrotic compared with normal lungs. Representative significantly enriched GO processes are shown for macrophages, alveolar type II cells, and fibroblasts. (GI) Gene Set Enrichment Analysis was performed using the Comparative Toxicogenomics Database Pulmonary Fibrosis Gene Set with genes ranked by log difference in average expression between fibrotic and normal lungs. Enrichment plots together with normalized enrichment scores and false discovery rate q values are shown for macrophages, alveolar type II cells, and fibroblasts. (JL) Violin plots of expression for select genes significantly upregulated in patients with fibrotic compared with normal lungs.
Figure 3.
Figure 3.
Bulk RNA-Seq of whole-lung tissue and flow cytometry–sorted alveolar type II cells and alveolar macrophages from normal and fibrotic lungs validates the single-cell RNA-Seq analysis. (AC) Bulk RNA-Seq was performed on whole-lung tissue and flow cytometry–sorted alveolar type II cells and alveolar macrophages from 14 normal and 8 fibrotic lungs. Estimation of differential gene expression using DESeq2 was performed comparing fibrotic with normal lungs. Volcano plots are shown for whole lung, alveolar type II cells, and alveolar macrophages, respectively. (DF) Hierarchical clustering heatmaps of significant differentially expressed genes were generated using GENE-E. (GI) Functional enrichment analysis with GO Biological Processes was performed using GOrilla with the top 500 genes upregulated and downregulated in fibrotic compared with donor lungs. Representative GO processes are shown. (JL) Gene Set Enrichment Analysis was performed using the Comparative Toxicogenomics Database Pulmonary Fibrosis Gene Set with genes ranked by −log(P value). Enrichment plots together with normalized enrichment scores and false discovery rate q values are shown for whole lung, alveolar type II cells, and alveolar macrophages. (MO) Expression of selected significant differentially expressed genes previously described to be important in pulmonary fibrosis.
Figure 4.
Figure 4.
Single-cell RNA-Seq analysis reveals distinct contributions of individual cell populations to pathways implicated in the pathogenesis of pulmonary fibrosis. (A) Expression of selected Wnt pathway, Notch pathway, and epithelial-to-mesenchymal transition–related genes is shown in fibroblasts, endothelial cells, alveolar type I cells, alveolar type II cells, ciliated cells, club cells, basal cells, and macrophages, separated by donor (blue) or pulmonary fibrosis (red) origin. Dot size corresponds to the percentage of cells in the cluster expressing a gene, and dot color corresponds to the average expression level for the gene in the cluster. (B) Violin plots of WNT2, WNT7B, AXIN2, and RSPO3 expression are shown, suggesting the presence of distinct Wnt-expressor and Wnt-responder cell populations in the human lung. AT 1/2 = alveolar type I/II; EMT = epithelial to mesenchymal transition.
Figure 5.
Figure 5.
Distinct populations of alveolar macrophages emerge during pulmonary fibrosis. (A) Cells identified as macrophages by individual annotation of single-cell RNA-Seq data from eight normal and eight fibrotic lungs were combined and then clustered, revealing four clusters. (B and C) Relative contributions of alveolar macrophages from normal and fibrotic lungs to each cluster as shown by t-distributed Stochastic Neighbor Embedding plot and by bar plots. (D) Feature plots demonstrating differential expression of selected alveolar macrophage maturation genes (PPARG, APOE, MARCO, MRC1, MAFB, and SIGLEC1), and genes associated with fibrosis (IL1RN, MMP9, CHI3L1, SPP1, MARCKS, and PLA2G7). (E) Immunohistochemistry on lung sections from the same patients confirms heterogeneity in fibrotic gene expression within alveolar macrophages. Arrows indicate positive staining in alveolar macrophages; arrowheads indicate positive staining in alveolar epithelium for CHI3L1 and SPP1, endothelium for MARCKS, and neutrophils for MMP9. Scale bars, 50 μm. (F) Violin plots representing heterogeneity in expression of CHI3L1, MMP9, and SPP1 in macrophages from donor and fibrotic lungs. HP = hypersensitivity pneumonitis; ILD = interstitial lung disease; IPF = idiopathic pulmonary fibrosis; PM = polymyositis; SSc = systemic sclerosis; tSNE = t-distributed Stochastic Neighbor Embedding.
Figure 6.
Figure 6.
Distinct populations of alveolar epithelial cells emerge during fibrosis. (A) Six clusters were identified after epithelial cells from each of eight normal and eight fibrotic lungs were combined and clustered. (B and C) Relative contributions of epithelial cells from normal and fibrotic lungs to each cluster as shown by t-distributed Stochastic Neighbor Embedding plot and by bar plots. (D) Feature plots demonstrating differential expression of selected epithelial marker genes: SFTPC (alveolar type II cells), AGER (alveolar type I cells), SCGB1A1 (club cells), FOXJ1, and RFX2 (ciliated airway epithelial cells). Also shown are genes implicated in pulmonary fibrosis (HIF1A, CHI3L1, NKX2-1, HHIP, FASN, and HES1). (E) Violin plots representing heterogeneity in expression of SERPINA1 and CHI3L1 in epithelial cells from normal and fibrotic lungs. For definition of abbreviations, see Figure 5.
Figure 7.
Figure 7.
In situ RNA hybridization with amplification confirms the emergence of distinct populations of alveolar macrophages in patients with pulmonary fibrosis. (AD) Lung sections from Donor 1 (A and C), IPF 1 (B), and IPF 4 (D) were hybridized with indicated target probes. High-magnification (×40) images for differential interference contrast phase are shown on the left, followed by single-channel images for SFTPC (yellow), CD68 (magenta), and either CHI3L1 or SPP1 (cyan), with overlay images (with and without nuclei staining, Hoechst, blue) shown on the right. (A and B) CHI3L1-positive and CHI3L1-negative alveolar macrophages coexist in the same niche in patients with pulmonary fibrosis. Arrows show alveolar type II cells (double positive for SFTPC and CHI3L1), double arrows show alveolar macrophages (CD68-positive) negative or positive for CHI3L1 in the donor and fibrotic lung, respectively. (C and D) SPP1-positive and SPP1-negative alveolar macrophages coexist in the same niche in patients with pulmonary fibrosis. Note that donor alveolar macrophages lack expression of SPP1 (C), whereas alveolar macrophages from the fibrotic lung exhibit heterogeneity of SPP1 expression (D); double-positive CD68 and SPP1 are indicated with asterisk. Scale bars, 50 μm. (EH) Low-magnification (×20) overlay images from the same subjects. Boxes indicate areas shown on B and D, respectively. Scale bars, 50 μm. See Figures E8A–E8D for corresponding single-channel panels. DIC = differential interference contrast; IPF = idiopathic pulmonary fibrosis.
Figure 8.
Figure 8.
Wnt secretion and response are restricted to distinct nonoverlapping epithelial cells. (AC) Expression of WNT7B, WNT5A, and AXIN2 in epithelial cells from normal and fibrotic lungs by single-cell RNA-Seq. Total number of single-positive or double-positive cells is indicated. (D and E) Fluorescence RNA in situ hybridization with amplification reveals Wnt-expresser and Wnt-responder cells in the proximal airways of human lung. Images were obtained from human donor lung sections incubated without (D) or with designated target probes, WNT7B (magenta) and AXIN2 (green) (EG). Nuclei are stained with Hoechst (blue) and overlay images are shown on the far right. Note WNT7B is abundantly detected in small airway epithelial cells (E), consistent with its prominent detection in club cells by single-cell RNA-Seq. AXIN2 is not similarly enriched in club cells and is only specifically detected in alveolar regions (F) under higher magnification (G is a higher-magnification image of the boxed region in F). (H) High magnification of mouse lung alveoli subjected to fluorescence RNA in situ hybridization with amplification with probes for Wnt7a (yellow), Wnt7b (magenta), and Axin2 (green). Arrows indicate cells that are only positive for Axin2; arrowheads indicate specified Wnts. Double arrows indicate cells that may express both Wnts and Axin2, although quantification suggests cells that highly express Wnts and Axin2 are rare (Figure E9D). Asterisks indicate airway lumen. Scale bars, 50 μm. tSNE = t-distributed Stochastic Neighbor Embedding.
Figure 9.
Figure 9.
Identification of rare cell populations among lung epithelial cells using single-cell RNA-Seq. (A) Expression of markers associated with airway basal stem cells. (B) Feature plot showing cells enriched for senescence-associated genes using a senescence score for each cell. (C) Histograms showing the distribution of senescence scores in all epithelial cells from eight fibrotic compared with eight normal lungs (P = 0.0001; Student’s t test; n = 8 per group). (D) Histograms showing the distribution of senescence scores by epithelial cell cluster (see Figure 6A for cluster details). tSNE = t-distributed Stochastic Neighbor Embedding.
Figure 10.
Figure 10.
Single-cell RNA-Seq of a cryobiopsy from a living patient with idiopathic pulmonary fibrosis. (A and B) Representative histology (hematoxylin and eosin) showing fibroblastic foci (arrows), ×40 and ×100 magnification, respectively. (C) tSNE plot clustering of 1,516 cells into 13 distinct cellular types. (D) Subsets of endothelial cells were identified by expression of VWF, SOX17, and PTGS1; lymphatics were identified by expression of PROX1. AT 1/2 = alveolar type I/II; NK = natural killer; tSNE = t-distributed Stochastic Neighbor Embedding.

Comment in

References

    1. Lederer DJ, Martinez FJ. Idiopathic pulmonary fibrosis. N Engl J Med. 2018;378:1811–1823. - PubMed
    1. Richeldi L. Idiopathic pulmonary fibrosis: current challenges and future perspectives. Eur Respir Rev. 2013;22:103–105. - PMC - PubMed
    1. Martinez FJ, Chisholm A, Collard HR, Flaherty KR, Myers J, Raghu G, et al. The diagnosis of idiopathic pulmonary fibrosis: current and future approaches. Lancet Respir Med. 2017;5:61–71. - PMC - PubMed
    1. Hutchinson J, Fogarty A, Hubbard R, McKeever T. Global incidence and mortality of idiopathic pulmonary fibrosis: a systematic review. Eur Respir J. 2015;46:795–806. - PubMed
    1. Collard HR, Chen SY, Yeh WS, Li Q, Lee YC, Wang A, et al. Health care utilization and costs of idiopathic pulmonary fibrosis in US Medicare beneficiaries aged 65 years and older. Ann Am Thorac Soc. 2015;12:981–987. - PubMed

Publication types