

A Pediatric Asthma Risk Score to better predict asthma development in young children
- PMID: 30554722
- PMCID: PMC6504569
- DOI: 10.1016/j.jaci.2018.09.037
A Pediatric Asthma Risk Score to better predict asthma development in young children
Abstract
Background: Asthma phenotypes are currently not amenable to primary prevention or early intervention because their natural history cannot be reliably predicted. Clinicians remain reliant on poorly predictive asthma outcome tools because of a lack of better alternatives.
Objective: We sought to develop a quantitative personalized tool to predict asthma development in young children.
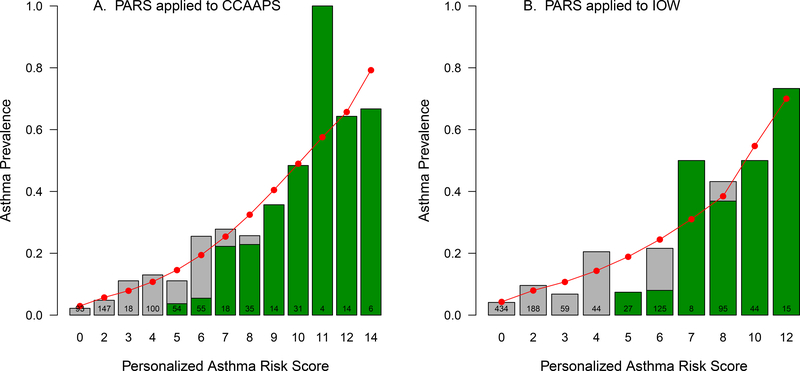
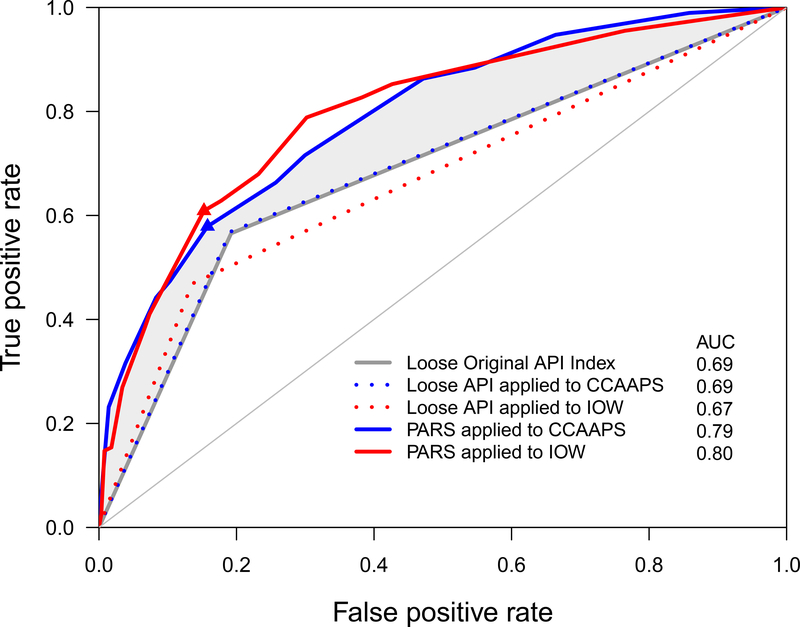
Methods: Data from the Cincinnati Childhood Allergy and Air Pollution Study (n = 762) birth cohort were used to identify factors that predicted asthma development. The Pediatric Asthma Risk Score (PARS) was constructed by integrating demographic and clinical data. The sensitivity and specificity of PARS were compared with those of the Asthma Predictive Index (API) and replicated in the Isle of Wight birth cohort.
Results: PARS reliably predicted asthma development in the Cincinnati Childhood Allergy and Air Pollution Study (sensitivity = 0.68, specificity = 0.77). Although both the PARS and API predicted asthma in high-risk children, the PARS had improved ability to predict asthma in children with mild-to-moderate asthma risk. In addition to parental asthma, eczema, and wheezing apart from colds, variables that predicted asthma in the PARS included early wheezing (odds ratio [OR], 2.88; 95% CI, 1.52-5.37), sensitization to 2 or more food allergens and/or aeroallergens (OR, 2.44; 95% CI, 1.49-4.05), and African American race (OR, 2.04; 95% CI, 1.19-3.47). The PARS was replicated in the Isle of Wight birth cohort (sensitivity = 0.67, specificity = 0.79), demonstrating that it is a robust, valid, and generalizable asthma predictive tool.
Conclusions: The PARS performed better than the API in children with mild-to-moderate asthma. This is significant because these children are the most common and most difficult to predict and might be the most amenable to prevention strategies.
Keywords: Asthma prediction score; childhood asthma; persistent wheezing; sensitization.
Copyright © 2018 American Academy of Allergy, Asthma & Immunology. Published by Elsevier Inc. All rights reserved.
Conflict of interest statement
Figures
References
-
- Akinbami LJ, Moorman JE, Bailey C, Zahran HS, King M, Johnson CA, et al. Trends in asthma prevalence, health care use, and mortality in the United States, 2001–2010. NCHS Data Brief 2012:1–8. - PubMed
-
- Palmer LJ, Cookson WO. Genomic approaches to understanding asthma. Genome Res 2000; 10:1280–7. - PubMed
-
- Savenije OE, Kerkhof M, Koppelman GH, Postma DS. Predicting who will have asthma at school age among preschool children. J Allergy Clin Immunol 2012; 130:325–31. - PubMed
-
- Castro-Rodriguez JA, Holberg CJ, Wright AL, Martinez FD. A clinical index to define risk of asthma in young children with recurrent wheezing. Am J Respir Crit Care Med 2000; 162:1403–6. - PubMed
Publication types
MeSH terms
Grants and funding
LinkOut - more resources
Full Text Sources
Medical
Miscellaneous
