. 2019 Jan;7(1):e58-e67.
doi: 10.1016/S2214-109X(18)30422-4.

Effect and cost-effectiveness of pneumococcal conjugate vaccination: a global modelling analysis

Affiliations

Effect and cost-effectiveness of pneumococcal conjugate vaccination: a global modelling analysis

Cynthia Chen et al. Lancet Glob Health. 2019 Jan.

Abstract

Background: Introduction of pneumococcal conjugate vaccines (PCVs) has substantially reduced disease burden due to Streptococcus pneumoniae, a leading cause of childhood morbidity and mortality globally. However, PCVs are among the most expensive vaccines, hindering their introduction in some settings and threatening sustainability in others. We aimed to assess the effect and cost-effectiveness of introduction of 13-valent PCV (PCV13) vaccination globally.

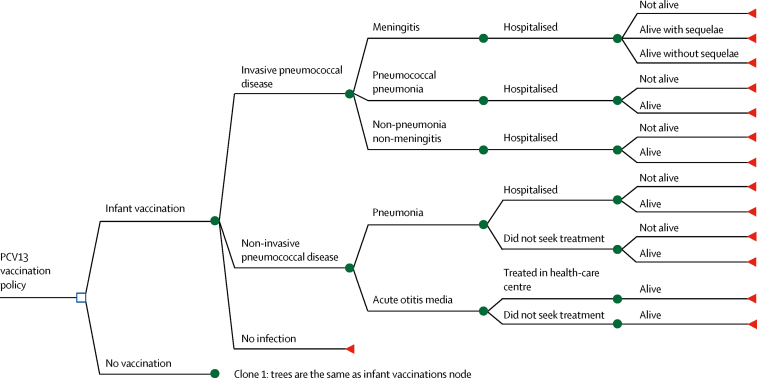
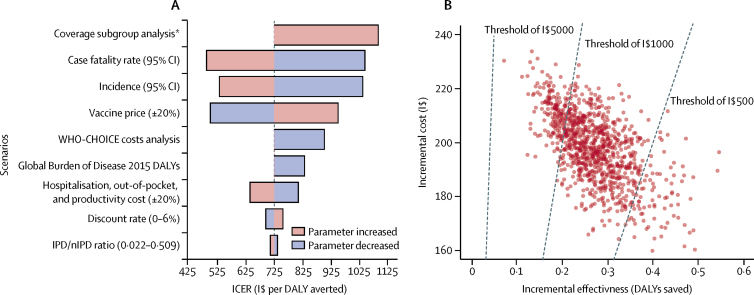
Methods: We assessed the incremental cost-effectiveness ratio of PCV13 introduction by integrating two models: an ecological model (a parsimonious, mechanistic model validated with data from post-seven-valent PCV introduction in 13 high-income settings) to predict the effect of PCV on childhood invasive pneumococcal disease, and a decision-tree model to predict a range of clinical presentations and economic outcomes under vaccination and no-vaccination strategies. The models followed 30 birth cohorts up to age 5 years in 180 countries from 2015 to 2045. One-way scenario and probabilistic sensitivity analyses were done to explore model uncertainties.

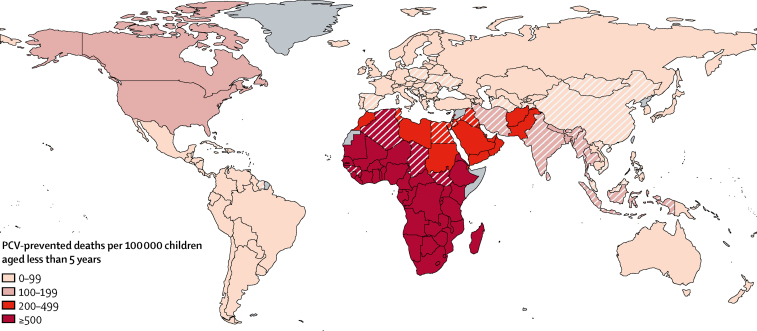
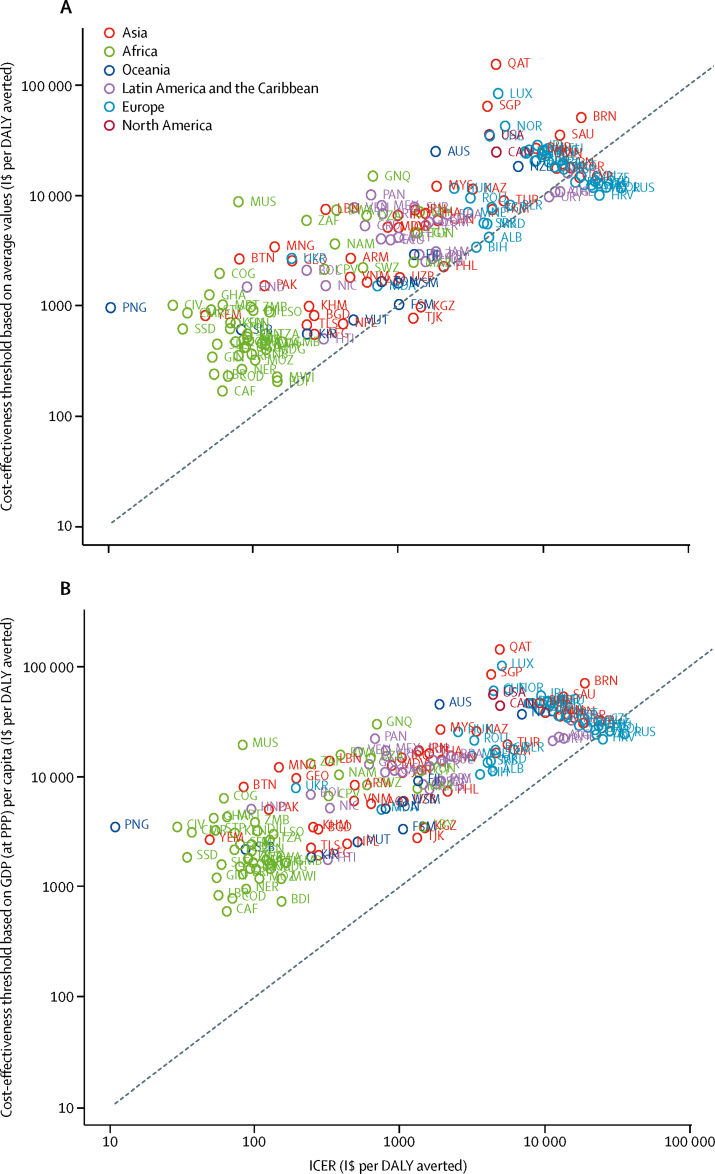
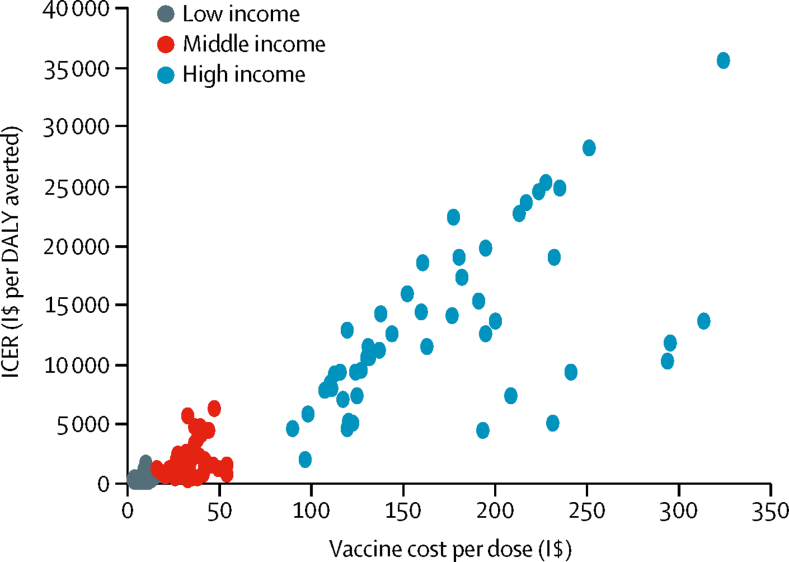
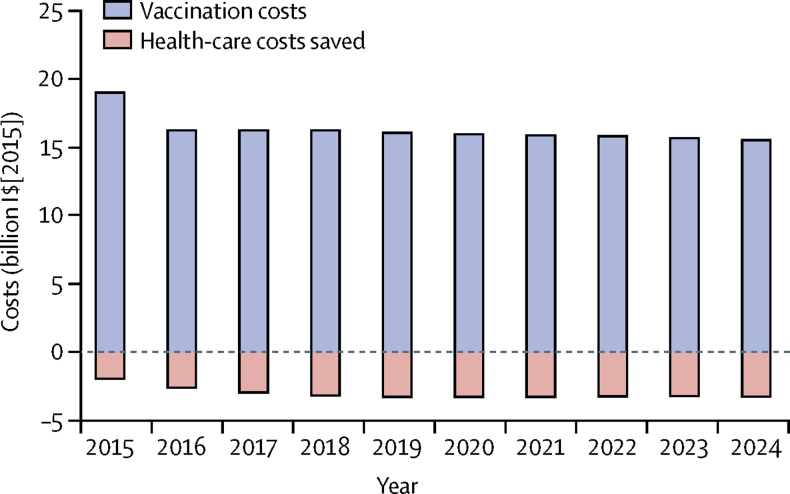
Findings: We estimate that global PCV13 use could prevent 0·399 million child deaths (95% credible interval 0·208 million to 0·711 million) and 54·6 million disease episodes (51·8 million to 58·1 million) annually. Global vaccine costs (in 2015 international dollars) of $15·5 billion could be partially offset by health-care savings of $3·19 billion (2·62 billion to 3·92 billion) and societal cost savings of $2·64 billion (2·13 billion to 3·28 billion). PCV13 use is probably cost-effective in all six UN regions. The 71 countries eligible for support from Gavi, the Vaccine Alliance, account for 83% of PCV13-preventable deaths but only 18% of global vaccination costs. The expected cost of PCV vaccination globally is around $16 billion per year.

Interpretation: Our findings highlight the value of Gavi's support for PCV introduction in low-income countries and of efforts to improve the affordability of PCVs in countries not eligible for, or transitioning from, Gavi support.

Funding: World Health Organization; Gavi, the Vaccine Alliance; and the Bill & Melinda Gates Foundation.


Figures

Figure 1
Figure 1
Decision tree for outcomes over a single year of age, depicting vaccination with PCV13 versus no vaccination An age-stratified decision-tree economic model was developed to represent disease outcomes and associated health states for vaccinated and unvaccinated populations in the model. The same structure is repeated for every year of age between 0 and 5 years. PCV13=13-valent pneumococcal conjugate vaccine.
Figure 2
Figure 2
Estimated deaths prevented by PCV vaccination per 100 000 children younger than 5 years in 180 countries The map represents the number of deaths prevented by routine childhood vaccination with PCV at 2015 coverage levels compared with the no vaccination scenario. Countries that have implemented PCV programmes are shaded with solid colours. Countries without existing PCV programmes are shown with diagonal lines. Countries in grey (n=17) were excluded because of missing data. PCV=pneumococcal conjugate vaccine.
Figure 3
Figure 3
Cost-effectiveness of routine PCV13 childhood vaccination The graphs show ICERs of PCV13 vaccination versus no vaccination, by country, compared with cost-effectiveness thresholds based on average values reported by Woods and colleagues (A) and thresholds based on GDP (at PPP) per capita (B). The x-axis represents the cost-effectiveness estimate obtained from our model. Countries above the line (y=x) are cost-effective. Graphs are presented using a log-log scale. Credible intervals were omitted for clarity. DALY=disability-adjusted life-year. GDP=gross domestic product. ICER=incremental cost-effectiveness ratio. I$=international dollars. PCV13=13-valent pneumococcal conjugate vaccine. PPP=purchasing power parity.
Figure 4
Figure 4
Comparison of ICER and vaccine purchase cost per dose by income regions Vaccine purchase cost per dose was converted to I$ using the World Bank and International Monetary Fund price level ratios of gross domestic product (at purchasing power parity) per capita to market exchange rate in 2015. Each point on the chart represents one country. Countries with higher vaccine cost had lower cost-effectiveness of vaccination (higher ICER). DALY=disability-adjusted life-year. ICER=incremental cost-effectiveness ratio. I$=international dollars.
Figure 5
Figure 5
Results of one-way parameter scenario and probabilistic sensitivity analyses (A) One-way sensitivity analysis was done to test the robustness of the economic model by varying key parameters over plausible ranges (shown in parentheses) to assess their global effect on ICER and number of deaths. Bars represent the median ICER generated from 1000 bootstraps. Longer bars represent greater sensitivity of the global results to variations in that key parameter. (B) In the probabilistic sensitivity analysis diagram, each point represents the result of the incremental cost (y-axis), and effectiveness (x-axis) of one bootstrap sample on the global scale. A total of 1000 bootstraps were generated. 100% of the simulations resulted in a positive ICER (quadrant 1). Dotted lines indicate willingness-to-pay thresholds of I$500, $1000, and $5000 per DALY saved. Points to the right of each dotted line are cost-effective at that willingness-to-pay threshold. CI=credible interval. DALY=disability-adjusted life-year. ICER=incremental cost-effectiveness ratio. IPD=invasive pneumococcal disease. nIPD=non-invasive pneumococcal disease. I$=international dollars. *In the coverage subgroup analysis, 63 countries without national immunisation programmes or with three-dose diphtheria-tetanus-pertussis coverage of less than 70% were excluded.
Figure 6
Figure 6
Global budget impact analysis of PCV vaccination over 10 years The budget impact analysis shows the effect of PCV vaccination on health-care costs (in 2015 I$). Negative values represent net savings in the health-care costs. Birth cohort size was assumed to vary based on UN population projection, and vaccine purchase costs were assumed to vary by countries' income classification. In the first birth cohort, we included a buffer stock of 25% and assumed it to remain constant over time. I$=international dollars. PCV=pneumococcal conjugate vaccine.

References

    1. WHO Pneumococcal vaccines WHO position paper—2012. Wkly Epidemiol Rec. 2012;87:129–144. - PubMed
    1. Whitney CG. Measuring progress on preventing pneumonia deaths: are we there yet? Lancet Infect Dis. 2017;17:1100–1101. - PubMed
    1. O'Brien KL, Wolfson LJ, Watt JP. Burden of disease caused by Streptococcus pneumoniae in children younger than 5 years: global estimates. Lancet. 2009;374:893–902. - PubMed
    1. WHO Estimated Hib and pneumococcal deaths for children under 5 years of age. 2008. http://www.who.int/immunization/monitoring_surveillance/burden/estimates...
    1. Theodoratou E, Johnson S, Jhass A. The effect of Haemophilus influenzae type b and pneumococcal conjugate vaccines on childhood pneumonia incidence, severe morbidity and mortality. Int J Epidemiol. 2010;39(suppl 1):i172–i185. - PMC - PubMed

Publication types

MeSH terms