. 2019 Jan 10;176(1-2):213-226.e18.
doi: 10.1016/j.cell.2018.11.026. Epub 2018 Dec 13.

Intrinsic Dynamics of a Human Gene Reveal the Basis of Expression Heterogeneity

Affiliations

Intrinsic Dynamics of a Human Gene Reveal the Basis of Expression Heterogeneity

Joseph Rodriguez et al. Cell. .

Abstract

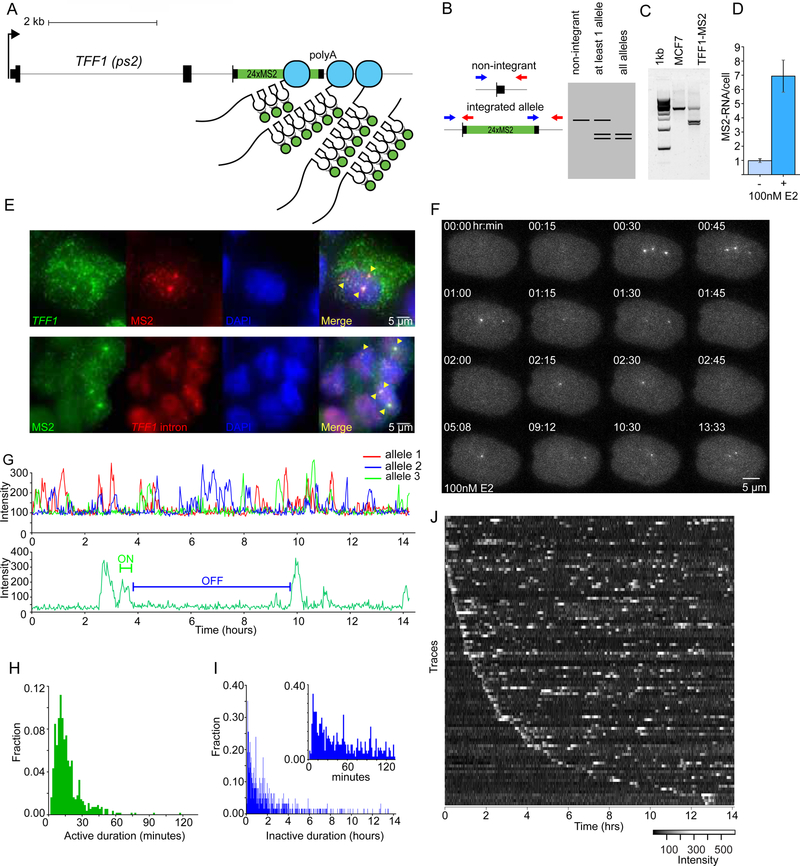
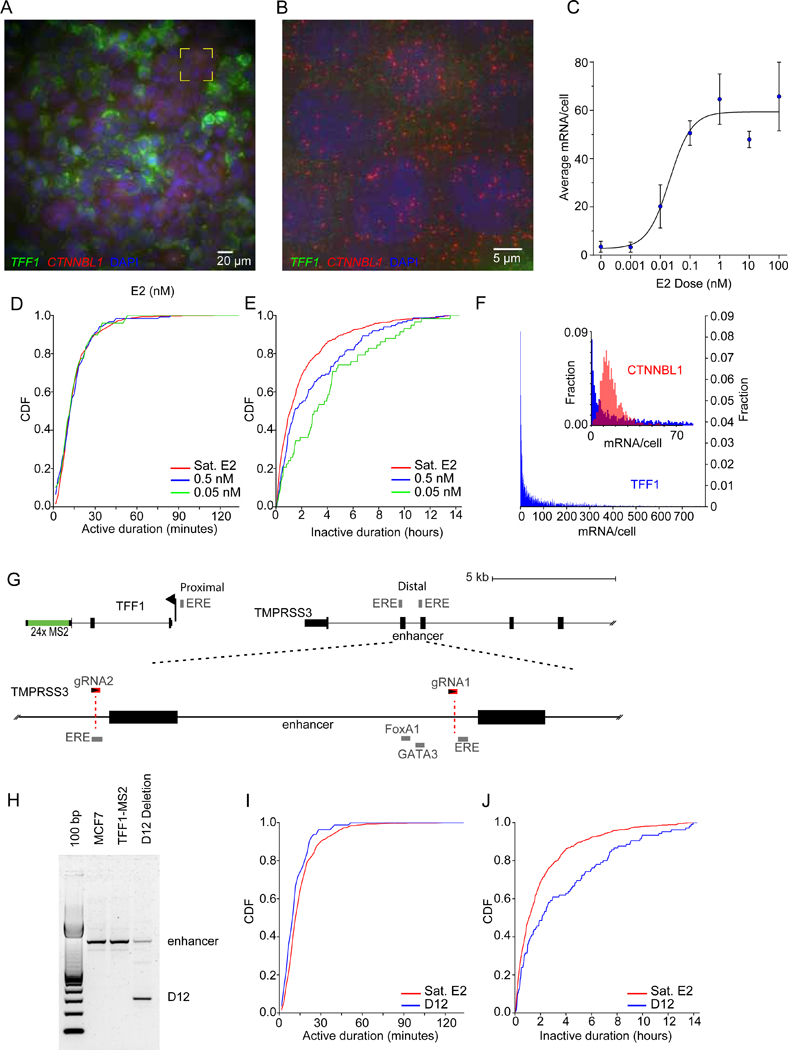
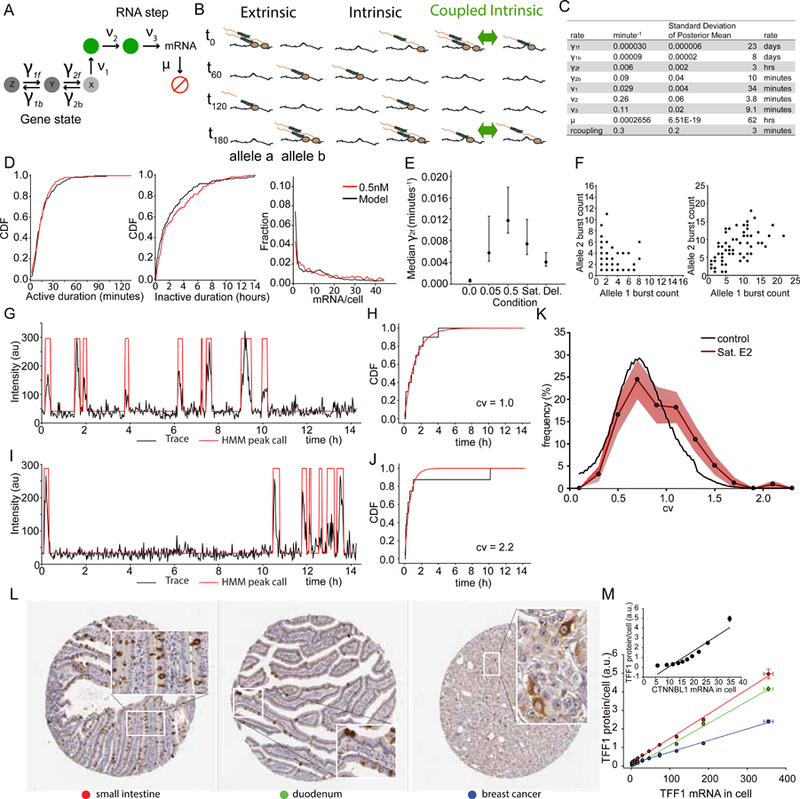
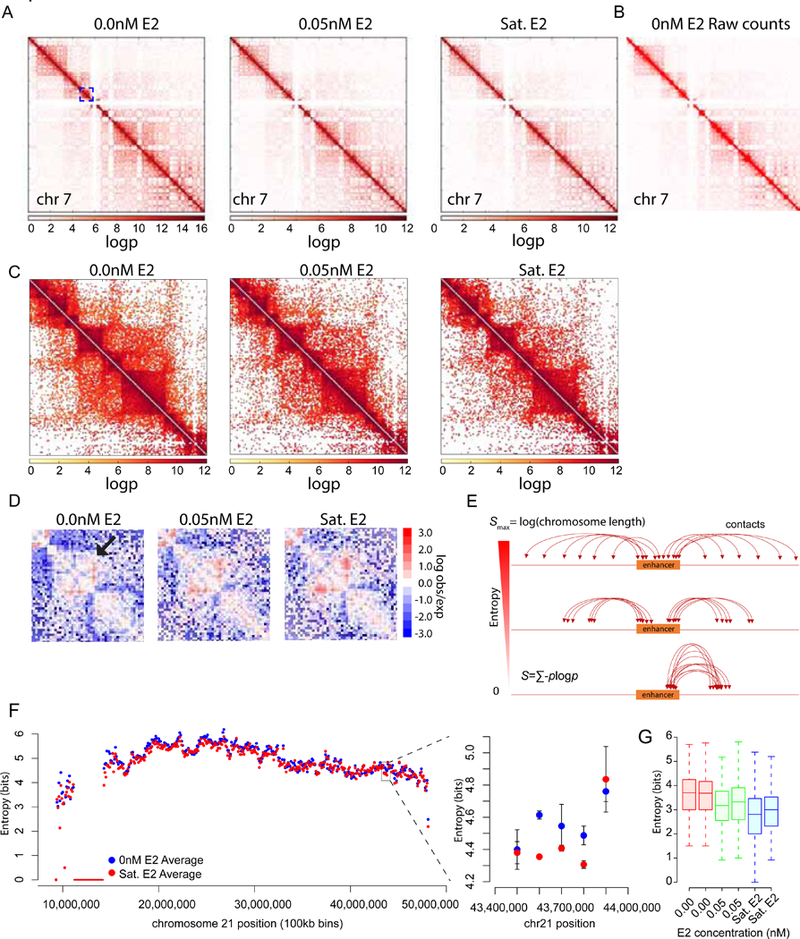
Transcriptional regulation in metazoans occurs through long-range genomic contacts between enhancers and promoters, and most genes are transcribed in episodic "bursts" of RNA synthesis. To understand the relationship between these two phenomena and the dynamic regulation of genes in response to upstream signals, we describe the use of live-cell RNA imaging coupled with Hi-C measurements and dissect the endogenous regulation of the estrogen-responsive TFF1 gene. Although TFF1 is highly induced, we observe short active periods and variable inactive periods ranging from minutes to days. The heterogeneity in inactive times gives rise to the widely observed "noise" in human gene expression and explains the distribution of protein levels in human tissue. We derive a mathematical model of regulation that relates transcription, chromosome structure, and the cell's ability to sense changes in estrogen and predicts that hypervariability is largely dynamic and does not reflect a stable biological state.

Keywords: RNA; chromosome; estrogen; fluorescence; heterogeneity; imaging; live-cell; single-molecule; steroid; transcription.


Conflict of interest statement

Declaration of interests

The authors declare no competing financial interests.

Figures

Figure 1
Figure 1
Live-cell imaging of endogenous TFF1 transcription reveals long and variable inactive periods (A) Illustration of the 24XMS2 stem loop labeling approach of the TFF1 3’UTR. (B) Screening methodology for 24XMS2 integrated single-cell clones yields double band PCR amplicons. Genomic PCR primers designed from outside of homology arms are incorporated into the donor plasmid. (C) Double bands indicate construct integrated at TFF1 in the TFF1-MS2 single-cell clone, and not in the parental unedited cell line. (D) smFISH quantification of MS2 RNA show the 24X MS2 cell line is inducible by 100nM E2. ls per sample (E) smFISH shows MS2 labeled RNA is exported into the cytoplasm in the TFF1-MS2 cell line. Bottom panel shows MS2 and TFF1 intron co-localization. Cells are fixed at steady state in saturating E2. (F) Three alleles can be visualized in the TFF1-MS2 clone upon induction with 100nM E2. (G) Multiple alleles can be tracked and observed transcribing in the same cell (top). A Hidden Markov Model was used to identify the periods of activity and inactivity (bottom). (H-I) Distribution of active periods and inactive periods. N=100 alleles from 48 cells.(I) The inset shows an expanded plot of the first 80 bins or ~133 minutes of inactive durations. (J) Raw intensity traces of 100 alleles plotted as a heatmap. See also Figure S1
Figure 2
Figure 2
Estrogen receptor regulates the frequency of TFF1 activation (A) Single molecule FISH imaging of TFF1 (green) and CTNNBL1 RNA (red) in single cells shows broad distribution of TFF1 mRNA in 100nM E2 at steady state. DAPI staining is in blue. (B) Yellow box in Fig 3a expanded to illustrate cells with low TFF1 and uniform CTNNBL1 mRNA expression. (C) TFF1 mRNA smFISH average shows strong response to E2 (blue). Sigmoidal dose response fit in black. The EC50 is 0.02 nM, in agreement with previous measures (May and Westley, 1987). Error bars: max and min of 2 biological replicates. (D-E) Active / inactive cumulative distribution functions (CDF) at different E2 concentrations, respectively (green, 0.05 nM; blue, 0.5 nM; red, complete media). (F) TFF1 mRNA smFISH illustrates broad TFF1 distribution (blue). The inset shows an expanded plot of the TFF1 distribution in comparison to the housekeeping gene CTNNBL1 (red). (G) An enhancer of TFF1 is located ~10kb upstream, and contains two EREs (grey). This region is expanded (dotted lines) to show the cofactor binding sites. Two CRISPR guide RNAs (red) were used to delete these cofactor binding sites, and part of an ERE. (H) PCR amplicons from the parental and deletion TFF1-MS2 cell lines illustrate the deletion amplicon on an agarose gel. (I-J) Active and inactive CDF of the D12 deletion clone (blue) and parental (red), respectively. Cells were grown and imaged in complete media. See also Figure S1
Figure 3
Figure 3
TRIM24 regulates TFF1 initiation rate (A) TFF1 RNA (blue) is downregulated in response to TRIM24 inhibition by MD9571. Cells were treated with different concentrations of TRIM24 inhibitor. A small decrease in mRNA expression was also observed for CTNNBL1 (red). Error bars represent the SEM, n=3 for TFF1, n=2 for CTNNBL1. An average of over 1000 cells/sample was used. (B-C) TRIM24 inhibition effects the active time durations and not the periods of inactivity. p=0.035, >0.5 respectively, by Mann-Whitney test. (D) smFISH validation of TRIM24 effect on TFF1 transcription sites shows less bright transcription sites. Transcription sites were visualized by TFF1 intron probesets. (E) CDF of transcription site intensity of TFF1 control and TRIM24 inhibitor smFISH data shows a significant decrease in intensity. p<0.001 by Mann-Whitney test.
Figure 4
Figure 4
Inter-allelic correlations indicate that intrinsic noise dominates heterogeneity (A-B) Scatter plot of allele activity in the same and different cells, respectively. Total RNA output is determined by summing the area under the time trace for each allele. Correlation coefficient r =0.65 (p-value = 3.8e-10) and −0.02, slope of 1.04 and −0.015, intercepts 513 and 11783 for intra-cell and inter-cell correlations, respectively. The slopes and intercept were calculated using Reduced Major Axis regression (red line). (C) Scatter plot of the number of bursts per allele over a 14-hour period in the same cell. Example pairs with highly-correlated (1,1) and (11,10) and non-correlated alleles (9,1) are marked in red. (D) Traces of example allele pairs in 4C with correlated and non-correlated burst counts. (E) Gab(t) (blue) denotes the experimental cross-correlation between two alleles as a function of time lag, along with the simulated cross-correlation (red). The random cross correlation (gray) is between alleles in different cells. Error bars are from bootstrap. N=219 alleles, resulting in 159 intra-nuclear correlation traces. (F) Different scenarios of cross-correlation between transcriptional pulses from two alleles, denoted as red and green for clarity. N1 is the number of bursts from the red allele; N2 is the number of bursts from the green allele. M is the number of co-occurring bursts. Setting burst duration D = 20 min, and total time T=400 min results in G1,2(0) = −1, 1.5 corresponding to 0% and 50% overlap for upper and lower panels, respectively. (G) Comparison of the autocorrelation (red) and cross-correlation (blue). Autocorrelation: N=219. Cross-correlation: N=159. See also Figures S3-S5
Figure 5
Figure 5
Multi-state model of TFF1 transcription requires interallele coupling (A) Generalized telegraph model for TFF1 depicts three regulatory gene states and two RNA steps. Only one of the gene states is occupied at any given time while each RNA step can be occupied or unoccupied. Red circle denotes degraded mRNA. (B) Schematic of the scenarios where extrinsic, intrinsic and coupled intrinsic (green) dominates transcriptional output. Two alleles are shown at 4 time points (t). Polymerase and RNA in beige, MS2-GFP in green. Green arrow denotes an allele coupling factor. (C) Maximum likelihood rates for TFF1 dynamics in saturating E2 (complete media). (D) Active, inactive live cell and mRNA smFISH distribution model fits are shown for dose 0.5nM. model in black, data in red. (E) Median γ2f rates with 95% confidence intervals. (F) Simulated inter allele total burst correlations for uncoupled (left) and coupled (right) models. The simulated coupled model recapitulates burst output correlations observed in 4C. (G) Single experimental trace for an allele with Poisson-like distributed inactive times. HMM peak calls in red. (H) CDF(black) for trace in panel G) and Poisson fit of inactive times(red) show similar agreement and a coefficient of variation (CV) of 1.0. (I) Single experimental trace (black) from an allele with a very long inactive time. HMM peak calls in red. (J) CDF (black) for trace (panel I) and Poisson fit of inactive times(red) show disagreement and a coefficient of variation 2.2. (K) Distribution of CVs for the 100 alleles at saturating estradiol(red) and a simulated Monte Carlo trace (black) with fixed transcription rates drawn from the pool of measured average rates. (L) TFF1 signal in human tissue images was quantified in three tissues: small intestine(red), duodenum(green) and breast cancer(blue). Image credit to Human Protein Atlas. (M) Decile to decile plots of TFF1 smFISH mRNA histograms in MCF7 cells and respective tissues from 5L show linear relationship. See also Figure S6
Figure 6
Figure 6
Secreted genes are variably expressed in human and mouse tissue (A) Secreted and signal peptide genes are variably expressed in MCF7 cells. This analysis uses genes with long RNA half-lives (>1000 minutes) in MCF7 cells. Shown are gene ontology categories and enrichment values. Categories with Benjamini q-values of less than 0.05 were considered. (B) Several categories are variably expressed within the cell types stem, goblet and enteroendocrine of a small intestine dataset. Secreted and signal peptide genes are variably expressed (Red asterisk). Shown are gene ontology categories and enrichment values. Benjamini pvalues of less than 0.05 were considered. (C) smFISH validation of secreted and signal peptide candidate genes in MCF7 cells show broad gene expression heterogeneity. Images show co hybridization of TFF1(green) and candidate genes (red). Maximum intensity projections are displayed. (D) RNA is expressed heterogeneously in single MCF7 cells for 3 of 4 candidates. Plotted are mRNA/cell histograms from the smFISH data (3C). 600–1200 cells used per sample, 3 replicates. (E) RNA is poorly correlated between estrogen responsive genes in the same cell(r=0.39,0.42,0.26,0.55 respectively). TFF1 mRNA/cell is plotted against candidate gene mRNA/cell in the same cells.
Figure 7
Figure 7
Estrogen regulated enhancers exhibit decreasing entropy and increasing specificity upon induction (A) Chromosome contacts shift from long range to local contacts upon induction with estradiol. Contact probability map of chromosome 7 is plotted with a scaling multiplier for visualization. (B) Raw read count contact matrix output from HOMER software plotted in Treeview. (C) Zoomed-in view of blue box in panel (A). Decrease in long range contacts is observed upon E2 induction. (D) Example region on chromosome 21(hg19:39,900,000–44,500,000) where contact frequency increases in response to E2. Shown are null model normalized contact map generated by Homer. (E) Schematic of enhancer entropy. Entropy is defined as the − ∑ P log where p is the probability of an enhancer contacting a region (bin) along the chromosome. An enhancer making equal contacts to all regions of the genome would have maximal entropy. While an enhancer contacting one region would have zero entropy. (F) Entropy for 100kb bins is calculated across chromosome 21 from two biological replicates (left panel). Entropy for flanking TFF1 region decreases in response to estradiol (right panel). (G) Entropy was calculated for a list of >700 ER bound enhancers with enhancer transcription using 1kb bins. A decrease in entropy was observed in response to estradiol. Two replicates are plotted. See also Figure S7.

References

    1. Akdemir KC, and Chin L (2015). HiCPlotter integrates genomic data with interaction matrices. Genome Biol 16, 198. - PMC - PubMed
    1. Bartman CR, Hsu SC, Hsiung CC, Raj A, and Blobel GA (2016). Enhancer Regulation of Transcriptional Bursting Parameters Revealed by Forced Chromatin Looping. Mol Cell 62, 237–247. - PMC - PubMed
    1. Battich N, Stoeger T, and Pelkmans L (2015). Control of Transcript Variability in Single Mammalian Cells. Cell 163, 1596–1610. - PubMed
    1. Bezanson J, Edelman A, Karpinski S, and Shah VB (2017). Julia: A Fresh Approach to Numerical Computing. Siam Rev 59, 65–98.
    1. Carpenter AE, Jones TR, Lamprecht MR, Clarke C, Kang IH, Friman O, Guertin DA, Chang JH, Lindquist RA, Moffat J , et al. (2006). CellProfiler: image analysis software for identifying and quantifying cell phenotypes. Genome Biol 7, R100. - PMC - PubMed

Publication types

MeSH terms