. 2019 Jan 8;12(1):71-83.
doi: 10.1016/j.stemcr.2018.11.015. Epub 2018 Dec 13.

A Contraction Stress Model of Hypertrophic Cardiomyopathy due to Sarcomere Mutations

Affiliations

A Contraction Stress Model of Hypertrophic Cardiomyopathy due to Sarcomere Mutations

Rachel Cohn et al. Stem Cell Reports. .

Abstract

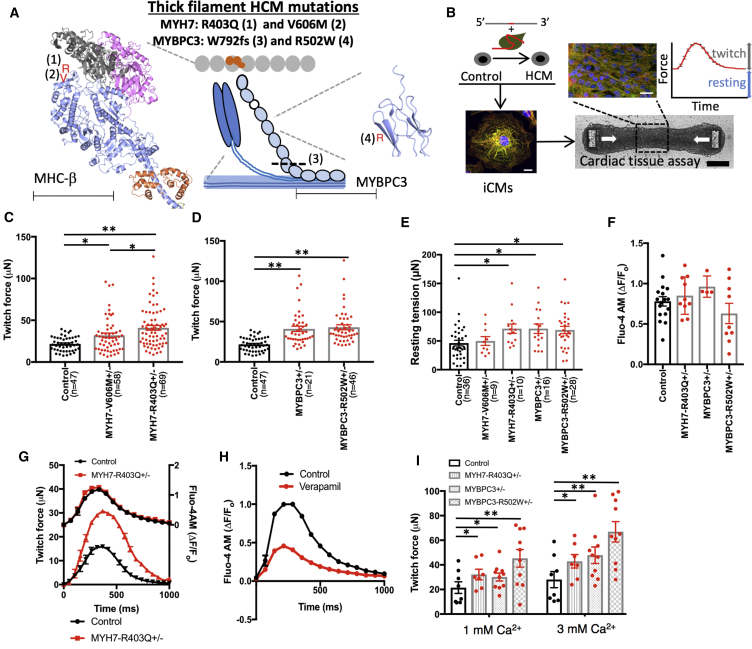
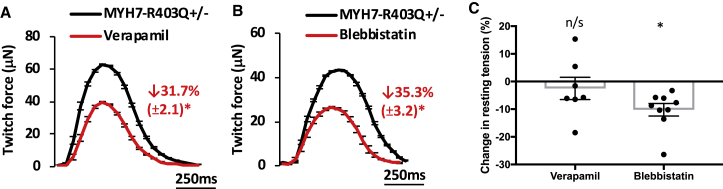
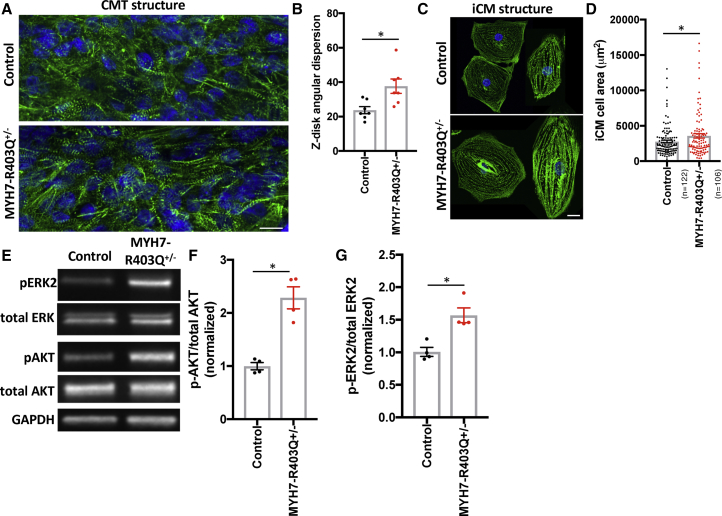
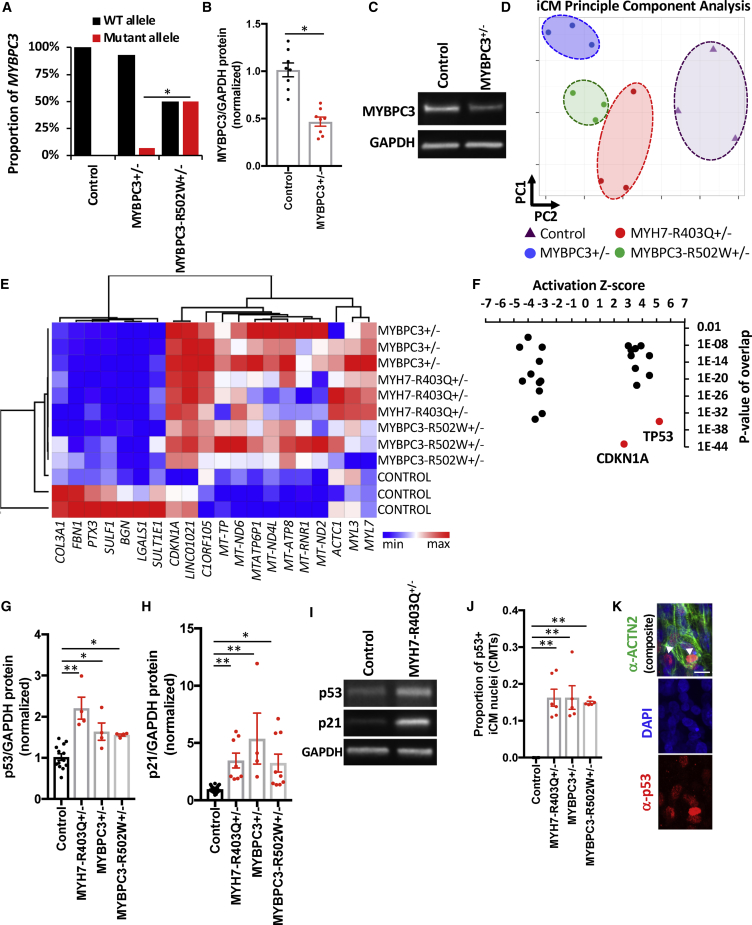
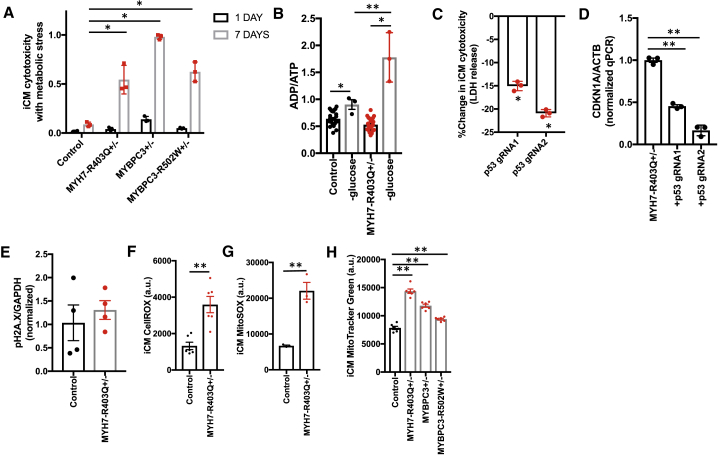
Thick-filament sarcomere mutations are a common cause of hypertrophic cardiomyopathy (HCM), a disorder of heart muscle thickening associated with sudden cardiac death and heart failure, with unclear mechanisms. We engineered four isogenic induced pluripotent stem cell (iPSC) models of β-myosin heavy chain and myosin-binding protein C3 mutations, and studied iPSC-derived cardiomyocytes in cardiac microtissue assays that resemble cardiac architecture and biomechanics. All HCM mutations resulted in hypercontractility with prolonged relaxation kinetics in proportion to mutation pathogenicity, but not changes in calcium handling. RNA sequencing and expression studies of HCM models identified p53 activation, oxidative stress, and cytotoxicity induced by metabolic stress that can be reversed by p53 genetic ablation. Our findings implicate hypercontractility as a direct consequence of thick-filament mutations, irrespective of mutation localization, and the p53 pathway as a molecular marker of contraction stress and candidate therapeutic target for HCM patients.

Keywords: cardiomyopathy; heart failure; hypertrophyp53 signaling; induced pluripotent stem cells; sarcomere function; tissue engineering.


Figures

Figure 1
Figure 1
Human iPSC-Derived CMT Models with Thick-Filament HCM Mutations Result in Hypercontractility (A) A representation of the sarcomere is shown that includes thick-filament components myosin heavy chain β (MHC-β) (blue globular heads connected to thin rods) and myosin-binding protein C (MYBPC3) (chain of light blue ovals); and thin-filament components actin (gray ovals) and the troponin complex (orange ovals). Location of mutations are decorated on the crystal structures of MHC-β-S1 (blue ribbon, left) and a domain of MYBPC3 (blue ribbon, right) (Fujii and Namba, 2017). Note: MHC-β-S1 is shown interacting with two actin molecules (gray and pink ribbons) and a regulatory light chain (orange ribbon). For MYH7, R403Q is identified by a red R (1), and V606M is denoted by a red V (2). For MYBPC3, the location of the truncation W792fs is denoted by a dashed line (3), and R502W is denoted by a red R (4). Scale bars, 62.5 Å (MHC-β) and 31 Å (MYBPC3). (B) Experimental outline of isogenic HCM model generation using the guide RNA (gRNA)/Cas9 complex and single-stranded oligodeoxynucleotide to introduce HCM mutations into a control iPSC line. iPSCs are then differentiated to produce iCMs that are combined with fibroblasts and an extracellular matrix slurry for CMT production. Scale bar, 10 μm. White arrows depict direction of contraction. Scale bars, 25 μm (top panel) and 200 μm (bottom panel). Both tissue twitch force and resting tension are quantified as well as CMT sarcomere structure by immunofluorescence. (C) Maximum twitch force from CMTs generated from control, MYH7-V606M+/– and MYH7-R403Q+/– iCMs. (D) Maximum twitch force from CMTs composed of control, MYBPC3+/−, and MYBPC3-R502W+/– iCMs. (E) Resting tension produced by HCM CMTs compared with controls. (F and G) Quantification of calcium transients (ΔF/Fo) measured in HCM and control CMTs stained with Fluo-4 while pacing at 1 Hz (F). See representative tracing in (G). (H) Representative calcium transient tracing of control iCMs treated with verapamil or carrier control. (I) Dependence of maximum twitch force generated by HCM and control CMTs from extracellular calcium concentration. Significance assessed by ANOVA (C–F and I) (all p < 0.05 and ∗∗all p < 0.001); data are means ± SEM (error bars) (C–I). Each data point represents a single CMT (C–F and I) generated by at least three biological replicates by iPSC differentiation batch.
Figure 2
Figure 2
Contraction and Relaxation Kinetics Are Altered by HCM Mutations (A) Representative twitch force tracings from MYH7-R403Q+/– CMT models compared with isogenic controls. (B–D) Normalized maximum contraction velocity (B), contraction time (C), and relaxation half-time (t1/2) (D) for MYBPC3+/−, MYBPC3-R502W+/–, and MYH7-R403Q+/– compared with controls. Significance was assessed by ANOVA (B–D) (all p < 0.05 and ∗∗all p < 0.001); data are means ± SEM (error bars) (A–D). Each data point represents a single CMT (B–D) generated by at least three biological replicates by iPSC differentiation batch.
Figure 3
Figure 3
Reduction of Hypercontractility in MYH7-R403Q+/– Tissues by Small Molecules Representative tracings and percentage change in twitch force for MYH7-R403Q+/– CMTs treated with carrier control (black tracing) compared with (A) verapamil (0.5 μM; red tracing) or (B) blebbistatin (10 μM; red tracing). (C) Comparison of the effects of verapamil and blebbistatin on resting tension in MYH7-R403Q+/– CMTs. Significance was assessed by Student's t test (A–C) (all p < 0.05); data are means ± SEM (error bars) (A–C). Each data point represents a single CMT (C) generated by at least three biological replicates by iPS differentiation batch.
Figure 4
Figure 4
CMT and iCM Structural and Molecular Signaling Changes in MYH7-R403Q+/– Models (A) Representative confocal image of CMTs generated from MYH7-R403Q+/– and control iCMs and decorated with antibodies to cardiac alpha actinin (green) and co-stained with DAPI (blue). Scale bar, 10 μm. (B) Quantification of sarcomeric Z disk angular dispersion obtained from analysis of confocal regions of interest from CMTs decorated with antibodies to alpha actinin. (C) Representative confocal images of single MYH7-R403Q+/– and control iCMs decorated with antibodies to cardiac alpha actinin (green) and co-stained with DAPI (blue). Scale bar, 10 μm. (D) Quantification of MYH7-R403Q+/– and control iCM cell area from confocal images stained with alpha actinin. (E–G) Representative immunoblots from MYH7-R403Q+/– and control iCM lysates probed with antibodies to phospho- and total ERK (note: ERK2 is highly phosphorylated in iCM lysates) and phospho- and total AKT as well as GAPDH (loading control) (E). Normalized quantification of (F) phospho-AKT to total AKT and (G) phospho-ERK2 to total ERK2. Significance was assessed by Student's t test (B, D, F, and G) (all p < 0.05); data are means ± SEM (error bars) (B, D, F, and G). Each data point represents a single CMT (B), iCM (D), or sample generated from a batch of iCMs (F and G) generated by at least three biological replicates by iPS differentiation batch.
Figure 5
Figure 5
RNA Sequencing of HCM and Isogenic Control iCMs (A) By allele-specific analysis of gene transcripts obtained from isogenic control, MYBPC3+/−, and MYBPC3-R502W+/– iCMs; MYBPC3 transcripts were quantified for control (wild-type [WT]; black bar) and mutant (red bar) alleles and shown as the proportion of total MYBPC3 expression. (B) Densitometry of immunoblots from protein lysates derived from control and MYBPC3+/− iCMs, and probed for MYBPC3 (note: truncated MYBPC3 was not identified) and for protein loading with GAPDH. (C) Representative immunoblot from (B). (D) Principal-component analysis (PCA) of RNA transcripts from three biological replicates of isogenic control (purple triangles) and MYBPC3+/− (blue circles), MYBPC3-R502W+/– (green circles), and MYH7-R403Q+/– iCMs (red circles). (E) Hierarchical clustering of genes contributing to PC1 and PC2 from (D) and illustrated by heatmap (Table S2). (F) Differentially expressed gene transcripts (log2FC > 0.3 or < –0.3 and false discovery rate < 0.1) were analyzed by pathway analysis using Ingenuity Pathway Analysis and identified pathways (black and red dots) were organized by activation Z score and p value of overlap. (G–I) Densitometry of immunoblots from control and HCM iCM protein lysates, normalized for protein loading (GAPDH) (G) and probed with antibodies to p53 or (H) p21. See representative blots in (I). (J and K) Quantification of iCM p53+ nuclei from confocal images of fixed CMTs immunostained with an antibody to p53 (red), cardiomyocyte-specific ACTN2, and DAPI co-stain (J). See representative image in (K), arrowhead marks p53+ nuclei that co-stain with ACTN2. Scale bar, 15 μm. Significance (p < 0.05 and ∗∗p < 0.001) was assessed by Fisher's exact test (A), Student's t test (B), or ANOVA (G, H, and J); and data are means ± SEM (error bars) (B, G, H, and J). Each data point represents a sample generated from a batch of iCMs (B, D, E, G, and H) or single CMT (J) generated by at least three biological replicates by iPS differentiation batch.
Figure 6
Figure 6
HCM iCMs Exhibit a p53-Dependent Cytotoxicity with Metabolic Stress that Is Related to Increased Oxidative Stress (A) Proportion of iCM death after 1 and 7 days of metabolic stress induced by growth in glucose-free medium. (B) ADP:ATP for iCMs cultured in normal growth medium and after 24 hr in glucose-free medium. (C) Change in iCM cytotoxicity measured by lactate dehydrogenase (LDH) release assay upon p53 genetic knockdown using lentiCRISPR encoding two independent gRNAs that target the TP53 gene. (D) qPCR analysis of CDKN1A normalized to ACTB obtained from cDNA libraries generated from MYH7-R403Q+/– iCMs transduced with lentiCRISPR encoding two independent TP53 or non-targeted gRNAs. (E) Quantification of phosphorylated H2A.X normalized to GAPDH using densitometry analysis of immunoblots from iCM lysates. (F and G) Quantification of fluorescence (arbitrary units) using FACS analysis of iCMs stained with CellROX green (F) or MitoSOX red (G), a mitochondrial-specific probe for reactive oxygen species. (H) Quantification of fluorescence (arbitrary units) using FACS analysis of iCMs stained with MitoTracker green. Significance (p < 0.05 and ∗∗p < 0.001) was assessed by ANOVA (A) or Student's t test (B–H); and data are means ± SEM (error bars) (A–H). Each data point represents results obtained from a sample generated from a batch of iCMs (A–H) generated by at least three biological replicates by iPS differentiation batch.

References

    1. Ashrafian H., McKenna W.J., Watkins H. Disease pathways and novel therapeutic targets in hypertrophic cardiomyopathy. Circ. Res. 2011;109:86–96. - PubMed
    1. Blankenburg R., Hackert K., Wurster S., Deenen R., Seidman J.G., Seidman C.E., Lohse M.J., Schmitt J.P. β-Myosin heavy chain variant Val606Met causes very mild hypertrophic cardiomyopathy in mice, but exacerbates HCM phenotypes in mice carrying other HCM mutations. Circ. Res. 2014;115:227–237. - PMC - PubMed
    1. Boudou T., Legant W.R., Mu A., Borochin M.A., Thavandiran N., Radisic M., Zandstra P.W., Epstein J.A., Margulies K.B., Chen C.S. A microfabricated platform to measure and manipulate the mechanics of engineered cardiac microtissues. Tissue Eng. Part A. 2012;18:910–919. - PMC - PubMed
    1. Bulkley B.H., Weisfeldt M.L., Hutchins G.M. Asymmetric septal hypertrophy and myocardial fiber disarray. Features of normal, developing, and malformed hearts. Circulation. 1977;56:292–298. - PubMed
    1. Chuan P., Sivaramakrishnan S., Ashley E.A., Spudich J.A. Cell-intrinsic functional effects of the alpha-cardiac myosin Arg-403-Gln mutation in familial hypertrophic cardiomyopathy. Biophys. J. 2012;102:2782–2790. - PMC - PubMed

Publication types

MeSH terms