. 2019 Jan 17;73(2):212-223.e7.
doi: 10.1016/j.molcel.2018.11.001. Epub 2018 Dec 13.

Repression of Transcription at DNA Breaks Requires Cohesin throughout Interphase and Prevents Genome Instability

Affiliations

Repression of Transcription at DNA Breaks Requires Cohesin throughout Interphase and Prevents Genome Instability

Cornelia Meisenberg et al. Mol Cell. .

Abstract

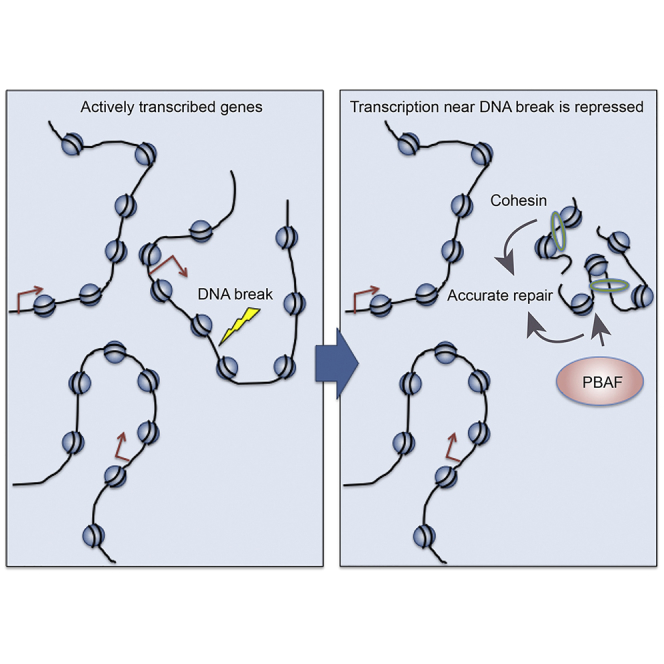
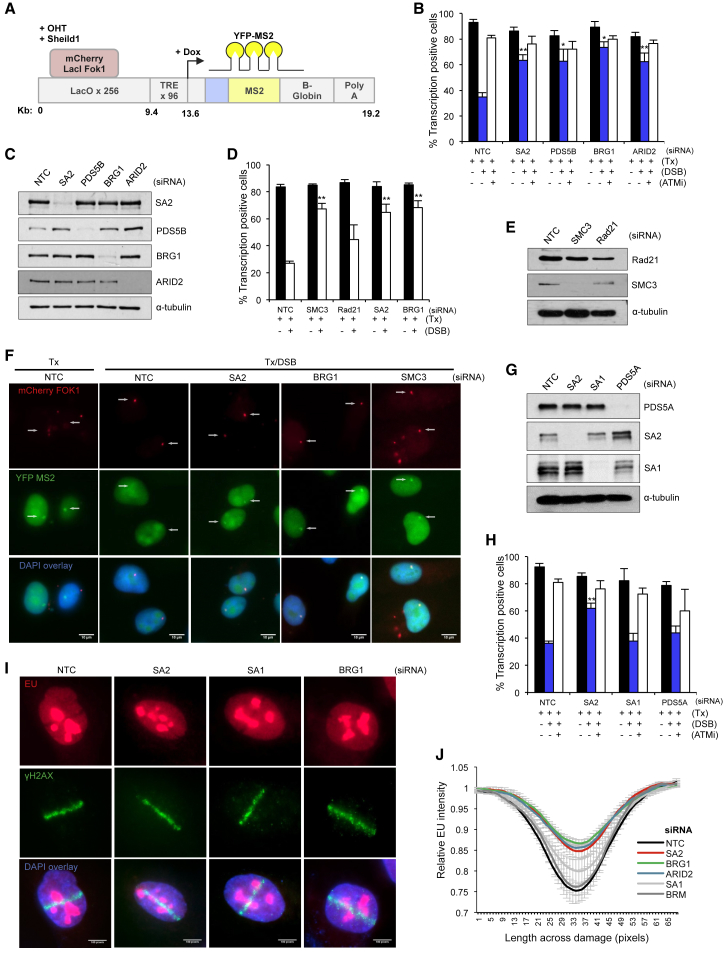
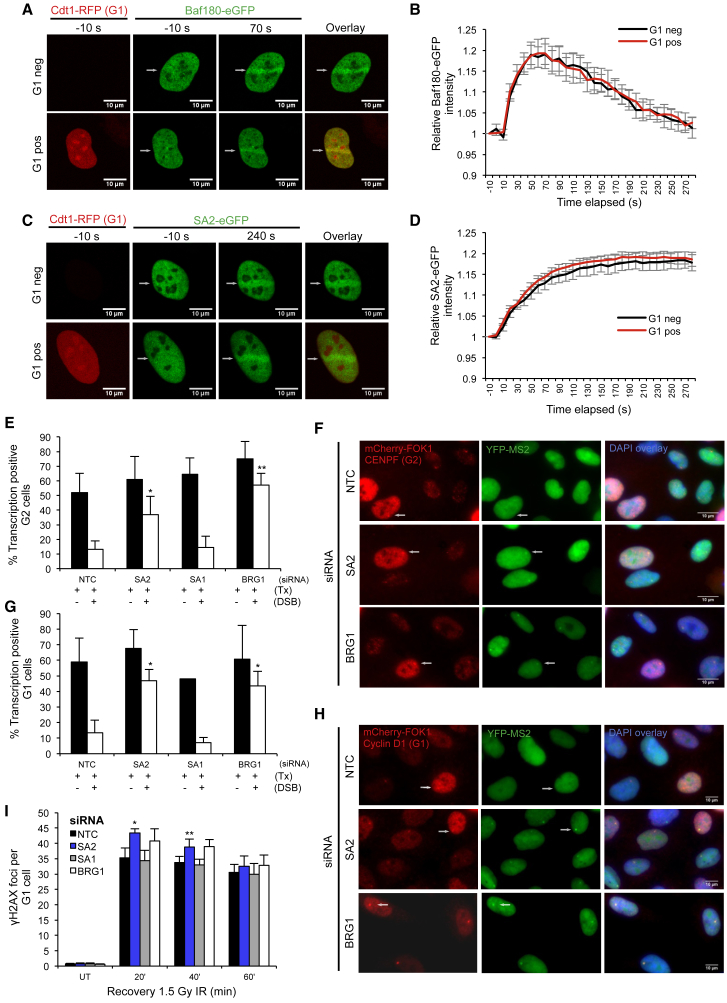
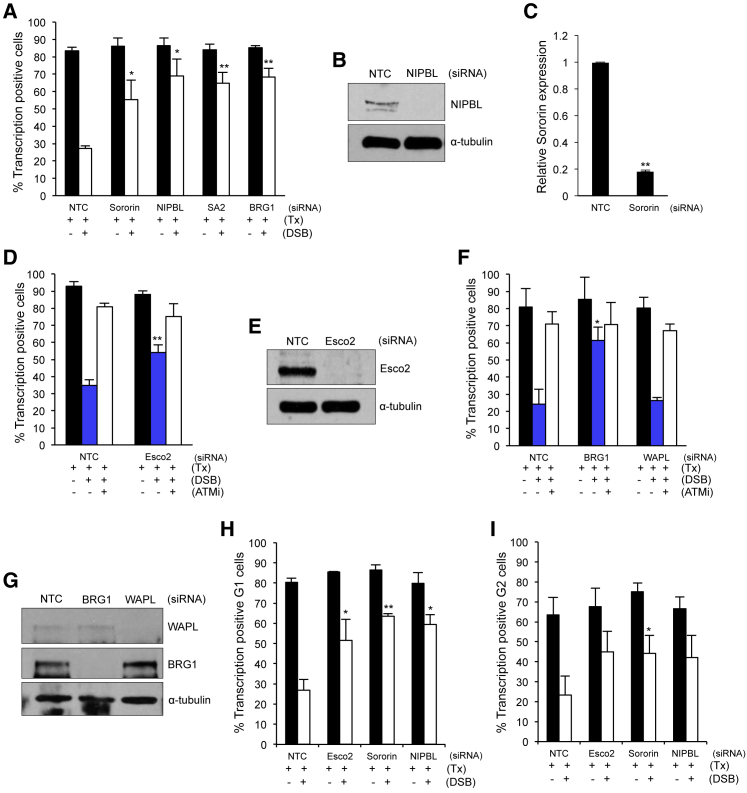
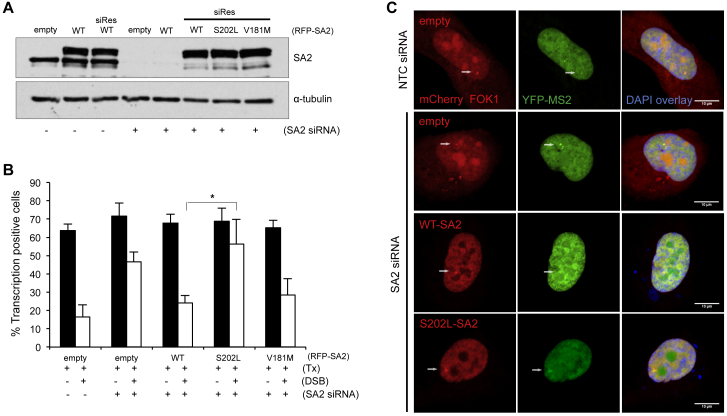
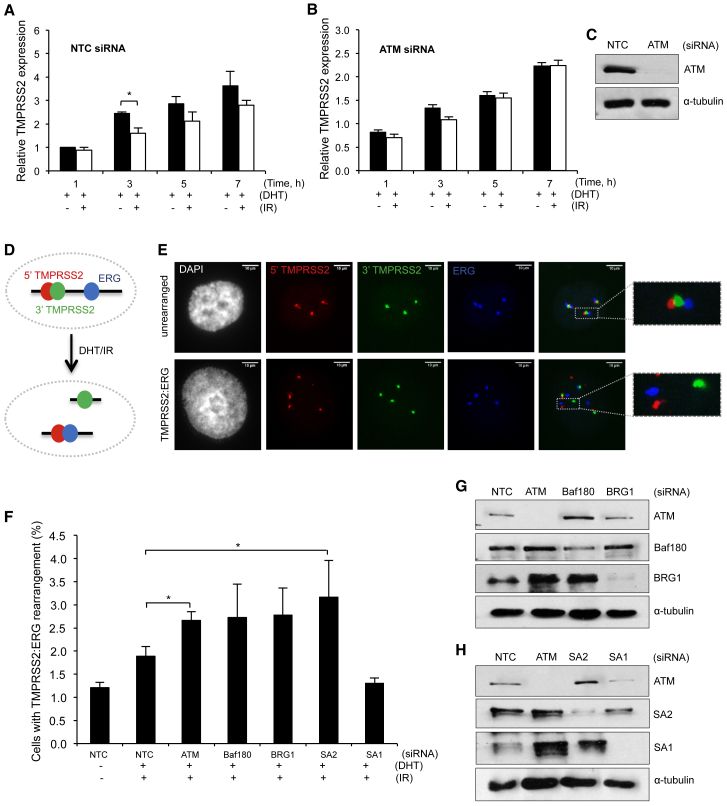
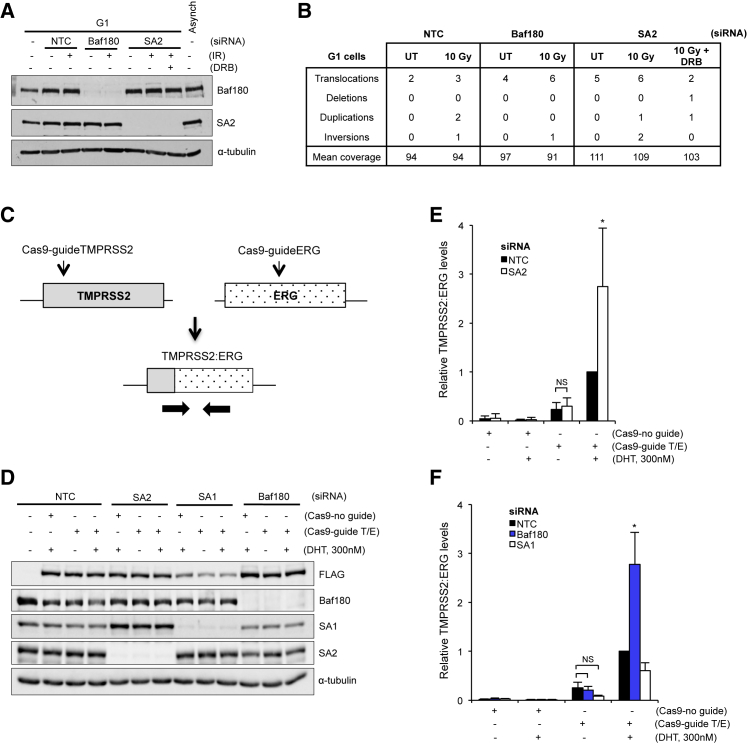
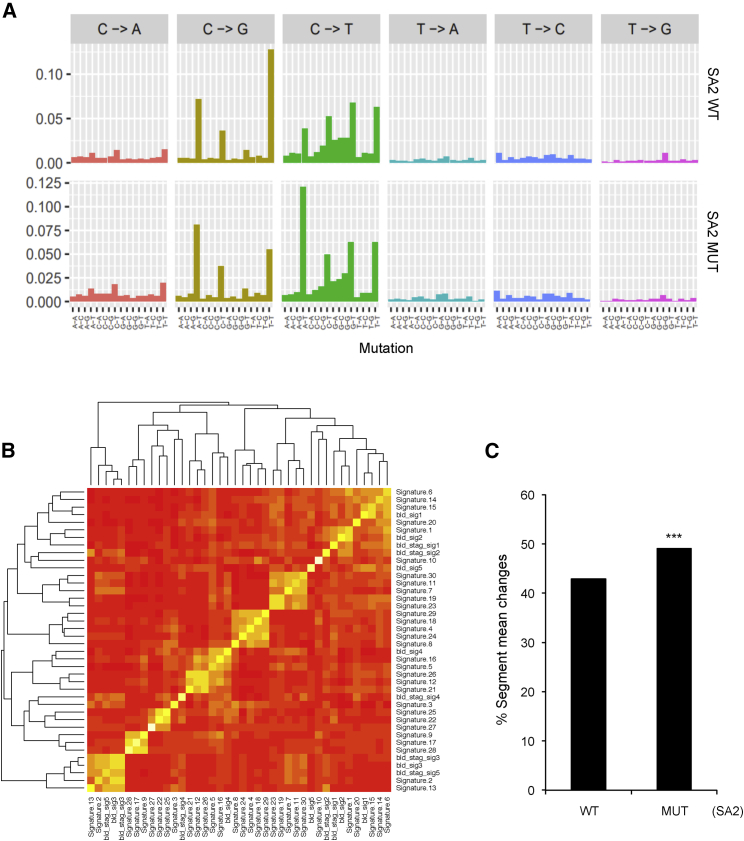
Cohesin subunits are frequently mutated in cancer, but how they function as tumor suppressors is unknown. Cohesin mediates sister chromatid cohesion, but this is not always perturbed in cancer cells. Here, we identify a previously unknown role for cohesin. We find that cohesin is required to repress transcription at DNA double-strand breaks (DSBs). Notably, cohesin represses transcription at DSBs throughout interphase, indicating that this is distinct from its known role in mediating DNA repair through sister chromatid cohesion. We identified a cancer-associated SA2 mutation that supports sister chromatid cohesion but is unable to repress transcription at DSBs. We further show that failure to repress transcription at DSBs leads to large-scale genome rearrangements. Cancer samples lacking SA2 display mutational patterns consistent with loss of this pathway. These findings uncover a new function for cohesin that provides insights into its frequent loss in cancer.

Keywords: DNA repair; PBAF; PBRM1; SA2; SMARCA4; STAG2; SWI/SNF; cancer; transcriptional silencing.


Figures

None
Graphical abstract
Figure 1
Figure 1
Cohesin Contributes to Transcriptional Repression at DNA Double-Strand Breaks (A) Cartoon of reporter construct (Tang et al., 2013) in which induction of the mCherry-tagged FokI endonuclease results in double-strand break (DSB) induction in a region upstream of a doxycycline-inducible reporter gene. Ongoing transcription of the reporter gene can be visualized by the presence of a YFP-MS2 fusion protein that binds stem-loop structures in the nascent transcript. (B, D, and H) Quantification of ongoing transcription in U2OS reporter cells (263 IFII) treated with small interfering RNA (siRNA) targeting SA2, PDS5B, BRG1, or ARID2 (B), SMC3, Rad21, SA2, or BRG1 (D), or SA2, SA1, or PDS5A (H). NTC, non-targeting control. After addition of doxycycline to induce transcription (Tx), transcriptional repression was monitored in cells with or without induction of the FokI endonuclease (DSB) by quantification of YFP-positive cells. Cells treated with 10 μM ATM inhibitor are indicated (ATMi). 150 cells were analyzed per condition per repeat. Data are presented as the mean ± SD; n = 4 (B), n = 3 (D and H). p < 0.05, ∗∗p < 0.01 using Student’s t test. (C, E, and G) Western blot analysis of whole-cell extracts prepared from cells treated with siRNA targeting SA2, PDS5B, BRG1, or ARID2 (C), SMC3 or Rad21 (E), or SA2, SA1, or PDS5A (G). NTC, non-targeting control. α-Tubulin was used as a loading control. (F) Representative images of U2OS reporter cells analyzed in (B). Arrow indicates location of FokI-induced DSB (mCherry) and/or YFP-MS2 transcript. (I) Representative images of cells assayed for transcriptional activity by monitoring EU incorporation after DNA damage induced by laser microirradiation and treatment with the indicated siRNA. (J) Quantification of EU signal (new mRNA synthesis) across the path of laser micro-irradiation in cells treated as in (I). Data are presented as mean ± SEM. A minimum of 30 cells were analyzed per repeat (n = 3–5 biological repeats). See also Figure S1.
Figure 2
Figure 2
Cohesin- and PBAF-Dependent Transcriptional Repression at DNA Double-Strand Breaks Occurs in Both G1 and G2 Phases (A and C) Representative images of cells expressing GFP-BAF180 (A), GFP-SA2 (C), or Cdt1-RFP (to identify G1 phase cells) as indicated following laser microirradiation. (B and D) Quantification of GFP-BAF180 (B) or GFP-SA2 (D) recruitment to laser-microirradiation-induced damage in G1 cells (Cdt1-RFP positive) or cells outside of G1 (Cdt1-RFP negative). Data represent the relative mean signal intensity ± SEM for n = 6 (B) or n = 7 (D) biological repeats. At least 42 cells were analyzed in total for each construct per cell-cycle phase. (E) Quantification of transcription in CENPF-positive (G2 phase) U2OS reporter cells treated with the indicated siRNA (NTC, non-targeting control) with or without induction of the FokI endonuclease. Data are presented as the mean ± SD. More than 40 cells were analyzed per condition per repeat (n = 3 biological repeats). (F) Representative images of U2OS reporter cells analyzed in (E). (G) Quantification of transcription in cyclin-D1-positive (G1 phase) U2OS reporter cells treated with the indicated siRNAs. Data are presented as the mean ± SD. More than 40 cells were analyzed per condition per repeat (n = 3 biological repeats). (H) Representative images of U2OS reporter cells analyzed in (G). (I) Quantification of γH2AX foci clearance following exposure to 1.5 Gy IR in G1 phase (cyclin D1 positive) U2OS cells treated with the indicated siRNA. Data are presented as mean ± SD; n = 3 biological repeats. p < 0.05, ∗∗p < 0.01 using paired Student’s t test. See also Figure S2.
Figure 3
Figure 3
Cohesin Establishment and Loading Factors Are Important for Transcriptional Repression at DNA DSBs in Both G1 and G2 Phase Cells (A, D, and F) Quantification of transcription in asynchronous U2OS reporter cells with or without induction of the FokI endonuclease (DSB) treated with siRNA targeting Sororin, NIPBL, SA2, or BRG1 (A), Esco2 (D), BRG1 or WAPL (F), and/or with 10 μM ATM inhibitor (NTC, non-targeting control). 150 cells were analyzed per condition, per repeat. Data are presented as mean ± SD; n = 3 (A), n = 4 (D), n = 4 (F) biological repeats. (B, E, and G) Western blot analysis of whole-cell extracts prepared from cells treated with siRNA targeting NIPBL (B), Esco2 (E), or BRG1 or WAPL (G). NTC, non-targeting control. α-Tubulin was used as a loading control. (C) qRT-PCR analysis of Sororin mRNA levels following siNTC or siSororin treatment to provide an indication of depletion efficiency. (H) Quantification of transcription in cyclin-D1-positive (G1 phase) U2OS reporter cells treated with the indicated siRNAs. Data are presented as the mean ± SD; n = 3 biological repeats. (I) Quantification of transcription in CENPF-positive (G2 phase) U2OS reporter cells treated with the indicated siRNA with or without induction of the FokI endonuclease (DSB). More than 110 cells were analyzed per condition, per repeat. Data are presented as mean ± SD, n = 3 biological repeats. p < 0.05, ∗∗p < 0.01 using paired Student’s t test. See also Figure S3.
Figure 4
Figure 4
A Sister Chromatid Cohesion-Proficient Cancer-Associated SA2 Mutant Is Not Able to Support Transcriptional Repression at DNA DSBs (A) Western blot analysis of SA2 in whole-cell extracts prepared from cells following siRNA depletion (where indicated) and transfection with siRNA-sensitive or siRNA-resistant (siRes) SA2 constructs. (B) Quantification of transcription in U2OS reporter cells treated with siSA2 and transfected with the indicated siRNA-resistant SA2 construct with or without induction of the FokI endonuclease (DSB). 100 cells were analyzed per condition per repeat. Data represent the mean ± SD; n = 3 biological repeats. p < 0.05, ∗∗p< 0.01 using paired Student’s t test. (C) Representative images of U2OS reporter cells analyzed in (B). See also Figure S4.
Figure 5
Figure 5
Depletion of Cohesin or PBAF Leads to Increased Chromosome Rearrangements in the TMPRSS2 Gene Following Transcriptional Induction and DNA Damage (A and B) qRT-PCR analysis of relative TMPRSS2 transcript levels in LNCaP cells following transcriptional induction with 300 nM DHT (+DHT) and with or without 10 Gy irradiation after siRNA depletion with non-targeting control (NTC; A) or ATM (B). Data are presented as the mean ± SEM; n = 3 biological repeats. (C) Western blot analysis of whole-cell extracts prepared from cells treated with siNTC or siATM. α-Tubulin was used as a loading control. (D) Cartoon of gene organization and location of probes used in FISH assays to monitor TMPRSS2:ERG translocations. Following treatment with DHT and IR, LNCaP cells underwent frequent rearrangements, as illustrated. (E) Representative FISH images showing cells with (bottom) and without (top) TMPRSS2:ERG translocations (see D). (F) Analysis of translocations between TMPRSS2 and ERG in LNCaP cells by FISH following transcription activation and DNA DSB induction in cells treated with the indicated siRNA. 50 cells were analyzed per condition per repeat. Data are presented as the mean ± SEM, and a minimum of 3 (up to 12) biological repeats were performed for each condition. (G and H) Western blot analysis of whole-cell extracts prepared from LNCaP cells treated with siRNA targeting ATM, BAF180, or BRG1 (G) or ATM, SA2, or SA1 (H). NTC, non-targeting control. α-Tubulin was used as a loading control. p < 0.05, ∗∗p < 0.01 using unpaired Student’s t test. See also Figure S5.
Figure 6
Figure 6
PBAF and Cohesin Are Important for Preventing Chromosome Rearrangements at DSBs in G1, Specifically at DSBs near Strong Transcriptional Activity (A) Western blot analysis of cell extracts prepared from G1-arrested U2OS cells. Cells were depleted of the indicated factors (NTC, non-targeting control) and harvested 6 hr after irradiation with 0 or 10 Gy. DRB was used for 1 hr prior to irradiation in the SA2-depleted cells to inhibit transcription. α-Tubulin was used as a loading control. (B) Table of large-scale genome rearrangements identified in BAF180- or SA2-depleted G1 phase cells treated as in (A) using differential exome sequencing. UT, untreated. DRB was used for 1 hr prior to irradiation in the SA2-depleted cells to inhibit transcription. (C) Schematic illustrating the CRISPR-Cas9 system for generating DNA DSBs in the TMPRSS2 and ERG genes. Guide RNA positions are indicated (Cas9-guideTMPRSS2 and Cas9-guideERG). Translocation between these genes is monitored by qRT-PCR using a forward primer that flanks the fusion and a reverse primer that recognizes the ERG gene. (D) Western blot analysis of whole-cell extracts prepared from LNCaP cells transfected with the indicated siRNAs and FLAG-tagged Cas9 with or without the TMPRSS2 and ERG guide RNAs (Cas9-guideT/E or Cas9-no guide) in the presence or absence of 300 nM DHT. (E and F) Relative TMPRSS2:ERG translocation frequency monitored by qRT-PCR as outlined in (C) in cells treated as in (D). Cells were treated with siRNA targeting SA2 (E), or BAF180 or SA1 (F). NTC, non-targeting control. Data are presented as the mean ± SD; n = 6 (E) n = 3 (F) biological repeats. p < 0.05, ∗∗p < 0.01 using unpaired Student’s t test. NS, not significant. See also Figure S6.
Figure 7
Figure 7
SA2-Deficient Bladder Cancer Samples Show Patterns of Genome Instability that Are Consistent with Loss of Cohesin-Mediated Repair Functions (A) Mutational spectra of all base substitutions observed in SA2-wild-type (top) and SA2 mutant (bottom) bladder cancer samples. Five signatures were identified in each group. See Table S1 for details. (B) Heatmap showing the correlation between the mutational signatures identified in the SA2-stratified bladder cancer samples and those published in COSMIC (Alexandrov et al., 2015). The SA2 mutant cancers (but not the wild-type [WT] bladder cancer samples) had a signature matching COSMIC signature 3, which is annotated as a loss of homologous recombination. (C) Copy-number variation measured as a percentage of segment mean changes present in SA2 mutant or wild-type bladder cancer samples. The SA2 mutant samples had an average of 482 genes with a gain or loss due to copy-number changes, whereas the samples without SA2 mutation had an average of 310. The null hypothesis was that the mutation status of SA2 was independent of the number of genes that had a changed segment mean. ∗∗∗p < 0.001 using chi-squared test. See also Table S1.

References

    1. Alexandrov L.B., Jones P.H., Wedge D.C., Sale J.E., Campbell P.J., Nik-Zainal S., Stratton M.R. Clock-like mutational processes in human somatic cells. Nat. Genet. 2015;47:1402–1407. - PMC - PubMed
    1. Aymard F., Bugler B., Schmidt C.K., Guillou E., Caron P., Briois S., Iacovoni J.S., Daburon V., Miller K.M., Jackson S.P., Legube G. Transcriptionally active chromatin recruits homologous recombination at DNA double-strand breaks. Nat. Struct. Mol. Biol. 2014;21:366–374. - PMC - PubMed
    1. Balbás-Martínez C., Sagrera A., Carrillo-de-Santa-Pau E., Earl J., Márquez M., Vazquez M., Lapi E., Castro-Giner F., Beltran S., Bayés M. Recurrent inactivation of STAG2 in bladder cancer is not associated with aneuploidy. Nat. Genet. 2013;45:1464–1469. - PMC - PubMed
    1. Bot C., Pfeiffer A., Giordano F., Manjeera D.E., Dantuma N.P., Ström L. Independent mechanisms recruit the cohesin loader protein NIPBL to sites of DNA damage. J. Cell Sci. 2017;130:1134–1146. - PMC - PubMed
    1. Brough R., Bajrami I., Vatcheva R., Natrajan R., Reis-Filho J.S., Lord C.J., Ashworth A. APRIN is a cell cycle specific BRCA2-interacting protein required for genome integrity and a predictor of outcome after chemotherapy in breast cancer. EMBO J. 2012;31:1160–1176. - PMC - PubMed

Publication types

MeSH terms

Substances