. 2018 Nov 30:9:2825.
doi: 10.3389/fimmu.2018.02825. eCollection 2018.

Dual-Isotope SPECT/CT Imaging of the Tuberculosis Subunit Vaccine H56/CAF01: Induction of Strong Systemic and Mucosal IgA and T-Cell Responses in Mice Upon Subcutaneous Prime and Intrapulmonary Boost Immunization

Affiliations

Dual-Isotope SPECT/CT Imaging of the Tuberculosis Subunit Vaccine H56/CAF01: Induction of Strong Systemic and Mucosal IgA and T-Cell Responses in Mice Upon Subcutaneous Prime and Intrapulmonary Boost Immunization

Aneesh Thakur et al. Front Immunol. .

Abstract

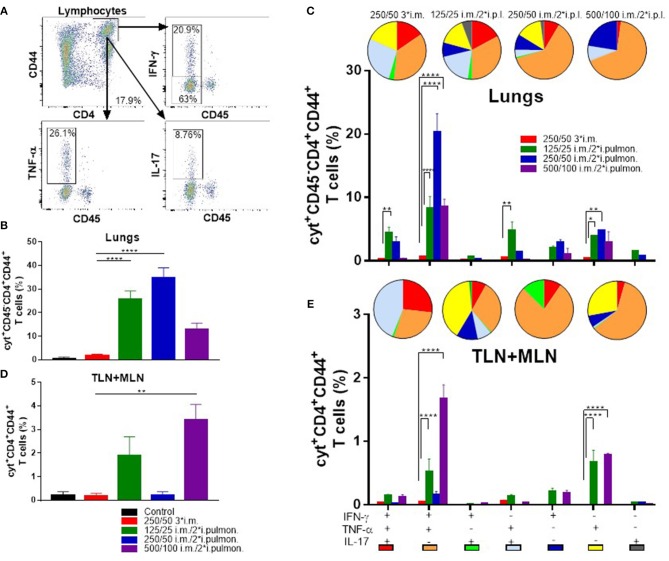
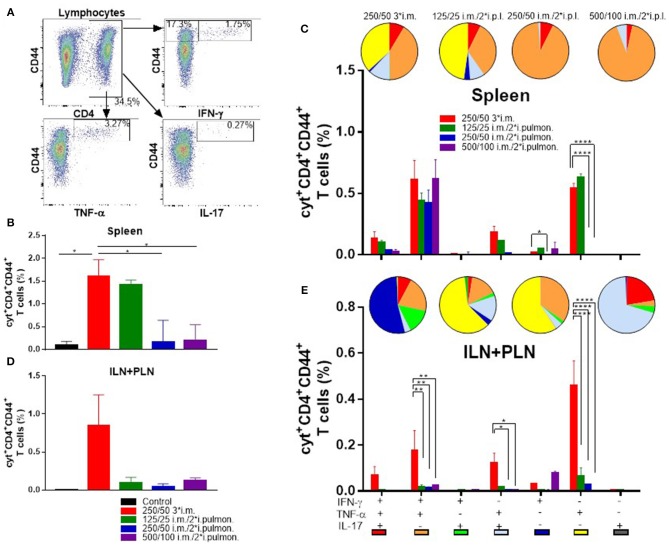
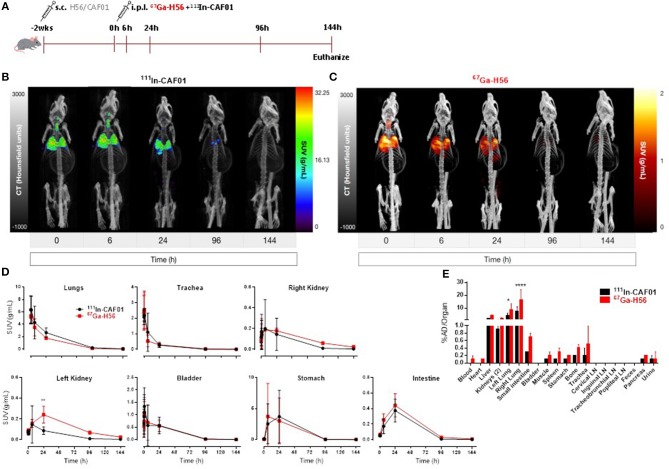
Pulmonary tuberculosis (TB), which is caused by Mycobacterium tuberculosis (Mtb), remains a global pandemic, despite the widespread use of the parenteral live attenuated Bacillus Calmette-Guérin (BCG) vaccine during the past decades. Mucosal administration of next generation TB vaccines has great potential, but developing a safe and efficacious mucosal vaccine is challenging. Hence, understanding the in vivo biodistribution and pharmacokinetics of mucosal vaccines is essential for shaping the desired immune response and for optimal spatiotemporal targeting of the appropriate effector cells in the lungs. A subunit vaccine consisting of the fusion antigen H56 (Ag85B-ESAT-6-Rv2660) and the liposome-based cationic adjuvant formulation (CAF01) confers efficient protection in preclinical animal models. In this study, we devise a novel immunization strategy for the H56/CAF01 vaccine, which comply with the intrapulmonary (i.pulmon.) route of immunization. We also describe a novel dual-isotope (111In/67Ga) radiolabeling approach, which enables simultaneous non-invasive and longitudinal SPECT/CT imaging and quantification of H56 and CAF01 upon parenteral prime and/or i.pulmon. boost immunization. Our results demonstrate that the vaccine is distributed evenly in the lungs, and there are pronounced differences in the pharmacokinetics of H56 and CAF01. We provide convincing evidence that the H56/CAF01 vaccine is not only well-tolerated when administered to the respiratory tract, but it also induces strong lung mucosal and systemic IgA and polyfunctional Th1 and Th17 responses after parenteral prime and i.pulmon. boost immunization. The study furthermore evaluate the application of SPECT/CT imaging for the investigation of vaccine biodistribution after parenteral and i.pulmon. immunization of mice.

Keywords: H56/CAF01 vaccine; SPECT/CT imaging; T cells; drug delivery; dual-isotope 111In/67Ga; mucosal immunity; nanomedicine; pulmonary immunization.


Figures

Figure 1
Figure 1
Physicochemical properties of radiolabeled CAF01 liposomes and H56 protein. (A) Chelation of DTPA and radiolabeling of CAF01 with 111In do not significantly influence the average intensity-weighted hydrodynamic diameter (z-average, circles, left axis) and polydispersity index (PDI) (squares, right axis), respectively. Statistical analysis: two-way ANOVA and Tukey's post-test. Bars represent mean values ± s.d., n = 5 (CAF01), n = 8 (CAF01-DTPA), and n = 3 (111In-DTPA-CAF01). *p < 0.05 and **p < 0.001. (B) Instant thin layer chromatography (ITLC) analysis of 111In-DTPA-CAF01. Free 111In3+ migrates with the solvent front (Rf = 1.0), whereas 111In-DTPA-CAF01 stays at the origin (Rf = 0). Left is 111In-DTPA-CAF01 for s.c. injection and right is 111In-DTPA-CAF01 for i.pulmon. administration. (C) ITLC analysis of 111In-DTPA-H56, where free 111In3+ migrates with the solvent front (Rf = 1.0, left) and 111In-DTPA-H56 stays at the origin (Rf = 0, right). (D) ITLC analysis of 67Ga-NOTA-H56, where 67Ga-NOTA-H56 stays at the origin (Rf = 0). (E) SDS-PAGE analysis of 111In-labeled H56 protein. Lane A represents a protein ladder, lane B is unmodified H56 protein, lane C is 111In-DTPA-H56 protein, and lane D is 111In-DTPA-H56 protein showing the phosphorimager radioactivity signal. (F) SDS-PAGE analysis of 67Ga-labeled H56 protein. Lane 1 represents the protein ladder, lane 2 is NOTA-H56, and lane 3 is 67Ga-NOTA-H56 protein. (G) Phosphorimager radioactivity signal from 67Ga-NOTA-H56 protein.
Figure 2
Figure 2
The H56/CAF01 vaccine remains in the lungs following i.pulmon. administration, whereas H56 drains to the local lymph nodes. (A) Experimental scheme: Mice were exposed i.pulmon. to 10 μg cold H56 adjuvanted with 111In-CAF01 (125/25 μg DDA/TDB) and 10 μg 111In-H56 adjuvanted with cold CAF01 (125/25 μg DDA/TDB), respectively. Animals were imaged by dynamic whole-body SPECT/CT scan for the initial 40 min (10 min/frame) and after that static 40 min scans at 6 and 24 h, 60 min scan at 96 h and 90 min scan at 144 h were conducted. Animals were euthanized on day 6 after immunization for ex vivo quantification of the biodistribution using a gamma counter. Representative SPECT/CT images of a mouse dosed i.pulmon. with cold H56 + 111In-CAF01 (B) or 111In-H56 + cold CAF01 (C) and imaged over 144 h post-immunization. (D) Organ SUVs in g/mL of the cold H56 + 111In-CAF01 or 111In-H56 + cold CAF01 over 144 h post-immunization; calculated from dynamic and static SPECT/CT images. Statistical analysis: two-way ANOVA and Sidak's post-test. Data represent mean values ± s.d., n = 3. *p < 0.05, ***p < 0.001, and ****p < 0.0001. (E) Ex vivo organ biodistribution [% administered dose (AD)/organ] of the cold H56 + 111In-CAF01 or 111In-H56 + cold CAF01 on day 6 (144 h) post-immunization. Statistical analysis: two-way ANOVA and Sidak's post-test. Bars represent mean values ± s.d., n = 3. **p < 0.01.
Figure 3
Figure 3
The H56/CAF01 vaccine forms a depot at the site of injection following s.c. administration. (A) Experimental scheme: S.C. immunization was carried out with 10 μg cold H56 adjuvanted with 111In-CAF01 (125/25 μg DDA/TDB) or 10 μg 111In-H56 adjuvanted with cold CAF01 (125/25 μg DDA/TDB). Dynamic whole-body SPECT/CT scans were carried out for 40 min (10 min/frame) and thereafter static 40 min scans at 6 and 24 h, 60 min scan at 96 h and 90 min scan at 144 h were performed. Animals were euthanized on day 6 after immunization for ex vivo quantification of the biodistribution using a gamma counter. Representative SPECT/CT images of a mouse injected s.c. with cold H56 + 111In-CAF01 (B) and 111In-H56 + cold CAF01 (C), imaged over 144 h post-administration. (D) Organ SUVs in g/mL of the cold H56 + 111In-CAF01 or 111In-H56 + cold CAF01 over 144 h post-immunization; calculated from dynamic and static SPECT/CT images. Statistical analysis: two-way ANOVA and Sidak's post-test. Data represent mean values ± s.d., n = 3. *p < 0.05, **p < 0.01, and ****p < 0.0001. (E) Ex vivo organ biodistribution (% administered dose (AD)/organ] of the cold H56 + 111In-CAF01 or 111In-H56 + cold CAF01 on day 6 (144 h) post-immunization. Statistical analysis: two-way ANOVA and Sidak's post-test. Bars represent mean values ± s.d., n = 3. **p < 0.01.
Figure 4
Figure 4
Strong antibody and cytokine responses in the lungs and serum after parenteral (i.m.) prime and airway (intrapulmonary, i.pulmon.) mucosal boost immunization with H56/CAF01. Mice were primed i.m. and boosted twice i.m. (5/250/50 μg H56/DDA/TDB) or primed i.m. (5/250/50 μg H56/DDA/TDB) and boosted twice i.pulmon. (10/125/25 or 10/250/50 or 10/500/100 μg H56/DDA/TDB) at 2 weeks interval with H56 adjuvanted with different doses of CAF01 (DDA/TDB). IgA (A,B), IgG1 (C,D), IgG2a (E,F), IgG2b (G,H), and IgG2c (I,J) mid-point titers (log EC50 values) were determined in homogenized lung supernatants and serum at 2 weeks after the last boost immunization. Lung cells (K,L) and splenocytes (M,N) were isolated 2 weeks after the last boost immunization and in vitro stimulated with H56 for 72 h and IFN-γ and IL-17 levels were determined by ELISA. Statistical analysis: one-way ANOVA and Tukey's post-test. Bars represent mean values ± s.e.m., n = 6. *p < 0.05, **p < 0.01, ***p < 0.001, and ****p < 0.0001.
Figure 5
Figure 5
Robust T-cell responses in the lungs and the lung-draining tracheobronchial and mediastinal lymph nodes (TLN + MLN) by parenteral (i.m.) priming and airway (intrapulmonary, i.pulmon.) mucosal H56/CAF01 immunization. Mice were primed i.m. and boosted twice i.m. (5/250/50 μg H56/DDA/TDB) or primed i.m. (5/250/50 μg H56/DDA/TDB) and boosted twice i.pulmon. (10/125/25 or 10/250/50 or 10/500/100 μg H56/DDA/TDB) at 2 weeks interval with H56 adjuvanted with different concentrations of CAF01 (DDA/TDB). Lung cells and the lung draining LNs (TLN + MLN) were examined for CD4+CD44+ T cells and IFN-γ, TNF-α, and IL-17 cytokines by intracellular flow cytometry analysis after stimulation with H56, 2 weeks after the last booster immunization. (A) Gating strategy for quantification and localization of lung-associated CD44+ T cells in immunized mice (exemplified by lung cells from an immunized mouse from the vaccine group 125/25 i.m./2*i.pulmon.). Lung cells were examined for labeling with i.v. injected FITC-conjugated anti-CD45.2 mAb 2 weeks after the last booster immunization by intracellular flow cytometry analysis after stimulation with H56. Dot plot shows IFN-γ, TNF-α, or IL-17 expression in i.v.CD45+ (intravascular) and i.v.CD45 (parenchymal) cells. (B) Number of cyt+CD4+CD44+ T cells (any cytokine IFN-γ, TNF-α, and IL-17), which are located in lung parenchyma (CD45). Statistical analysis: one-way ANOVA and Tukey's post-test. Bars represent mean values ± s.e.m., n = 6. ****p < 0.0001. (C) After Boolean gating analysis, the frequencies of the seven possible CD4+CD44+ T cell subpopulations expressing any combination of the IFN-γ, TNF-α, and IL-17 cytokines are shown for all immunization groups. The background from the control group was subtracted. Pie charts represent the fraction of CD4+CD44+ T cells expressing different cytokine combinations. Pie chart color-coding and the subpopulation association for each color is shown below the bar graph (E). Statistical analysis: two-way ANOVA and Tukey's post-test. Bars represent mean values ± s.e.m., n = 6. *p < 0.05, **p < 0.01, and ****p < 0.0001. (D) Number of cyt+CD4+CD44+ T cells (any cytokine IFN-γ, TNF-α, and IL-17) in the lung draining LNs (TLN+MLN). Statistical analysis: one-way ANOVA and Tukey's post-test. Bars represent mean values ± s.e.m., n = 6. **p < 0.01. (E) Boolean gating analysis and pie charts of CD4+CD44+ T cells expressing different cytokine combinations in the lung-draining LNs (TLN+MLN), 2 weeks after the last booster immunization. Statistical analysis: two-way ANOVA and Tukey's post-test. Bars represent mean values ± s.e.m., n = 6. ****p < 0.0001.
Figure 6
Figure 6
Parenteral (i.m.) prime and airway (i.pulmon.) mucosal boost immunization with H56/CAF01 induce equivalent T-cell responses in the spleen as parenteral (i.m.) prime-boost immunization. Mice were primed i.m. and boosted twice i.m. (5/250/50 μg H56/DDA/TDB) or primed i.m. (5/250/50 μg H56/DDA/TDB) and boosted twice i.pulmon. (10/125/25 or 10/250/50 or 10/500/100 μg H56/DDA/TDB) at 2 weeks interval with H56 adjuvanted with different concentrations of CAF01 (DDA/TDB). Spleen cells and the inguinal and popliteal lymph nodes (ILN+PLN) draining the site of i.m. injection were harvested 2 weeks after the last booster immunization, surface-stained for the CD4 and CD44 receptors and intracellular localized IFN-γ, TNF-α, and IL-17 cytokines by intracellular flow cytometry analysis after stimulation with H56. (A) Gating strategy for the evaluation of antigen-specific, cytokine-producing CD44+ T cells in spleen and lymph nodes of immunized mice (exemplified by TLN + MLN cells from an immunized mouse from the vaccine group 125/25 i.m./2*i.pulmon.). Dot plot shows IFN-γ, TNF-α, or IL-17 expression in CD44+ T cells. (B) Number of cyt+CD4+CD44+ T cells (any cytokine IFN-γ, TNF-α, and IL-17) in the spleen. Statistical analysis: one-way ANOVA and Tukey's post-test. Bars represent mean values ± s.e.m., n = 6. *p < 0.05. (C) After a Boolean gating analysis, the frequencies of the seven possible CD4+CD44+ T cell subpopulations expressing any combination of the IFN-γ, TNF-α, and IL-17 cytokines are shown for all immunization groups. Background from the control group was subtracted. Pie charts represent the fraction of CD4+CD44+ T cells expressing different cytokine combinations. Pie chart color-coding and the subpopulation association for each color is shown below the bar graph (E). Statistical analysis: two-way ANOVA and Tukey's post-test. Bars represent mean values ± s.e.m., n = 6. *p < 0.05 and ****p < 0.0001. (D) Number of cyt+CD4+CD44+ T cells (any cytokine IFN-γ, TNF-α and IL-17) in LNs draining the site of injection (ILN + PLN). Bars represent mean values ± s.e.m., n = 6. (E) Boolean gating analysis and pie charts of CD4+CD44+ T cells expressing different cytokine combinations in the LNs draining the site of injection (ILN+PLN) 2 weeks after the last booster immunization. Statistical analysis: two-way ANOVA and Tukey's post-test. Bars represent mean values ± s.e.m., n = 6. *p < 0.05, **p < 0.01 and ****p < 0.0001.
Figure 7
Figure 7
H56/CAF01 vaccine biodistribution upon parenteral (s.c.) priming and airway (i.pulmon.) mucosal boosting follow a similar trend as the biodistribution following airway (i.pulmon.) mucosal prime immunization. (A) Experimental scheme: Mice were prime-immunized s.c. with 5 μg cold H56 adjuvanted with cold CAF01 (250/50 μg DDA/TDB). At week 2, animals were boost-immunized via intrapulmonary (i.pulmon.) route with 10 μg 67Ga-H56 adjuvanted with 111In-CAF01 (125/25 μg DDA/TDB). Animals were imaged by dynamic whole-body SPECT/CT scan for the initial 40 min (10 min/frame) and after that static 40 min scans at 6 and 24 h, 60 min scan at 96 h and 90 min scan at 144 h were conducted. Animals were euthanized on day 6 after immunization for ex vivo biodistribution using a gamma counter. Representative SPECT/CT images showing biodistribution of 111In-CAF01 (B) and 67Ga-H56 (C) of a mouse prime-immunized s.c. with H56/CAF01 and boost-immunized i.pulmon. with 67Ga-H56 + 111In-CAF01. (D) Organ SUVs (g/mL) were calculated from dynamic and static SPECT/CT images of the cold s.c. prime-immunized and hot (67Ga-H56 + 111In-CAF01) i.pulmon. boost-immunized animals over 144 h post-immunization. Statistical analysis: two-way ANOVA and Sidak's post-test. Data represent mean values ± s.d., n = 3. **p < 0.01. (E) Ex vivo organ biodistribution [% administered dose (AD)/organ] of the cold s.c. prime-immunized and hot (67Ga-H56 + 111In-CAF01) i.pulmon. boost-immunized animals on day 6 (144 h) post-immunization. Statistical analysis: two-way ANOVA and Sidak's post-test. Bars represent mean values ± s.d., n = 3. *p < 0.05 and ****p < 0.0001.

Similar articles

Cited by

References

    1. WHO Global Tuberculosis Report 2017. Geneva: World Health Organization; (2017).
    1. Cooper AM. Cell-mediated immune responses in tuberculosis. Annu Rev Immunol. (2009) 27:393–422. 10.1146/annurev.immunol.021908.132703 - DOI - PMC - PubMed
    1. Kaufmann SH. Tuberculosis vaccine development: strength lies in tenacity. Trends Immunol. (2012) 33:373–9. 10.1016/j.it.2012.03.004 - DOI - PubMed
    1. McShane H, Jacobs WR, Fine PE, Reed SG, McMurray DN, Behr M, et al. . BCG: myths, realities, and the need for alternative vaccine strategies. Tuberculosis (2012) 92:283–8. 10.1016/j.tube.2011.12.003 - DOI - PMC - PubMed
    1. Behr MA. BCG–different strains, different vaccines? Lancet Infect Dis. (2002) 2:86–92. 10.1016/S1473-3099(02)00182-2 - DOI - PubMed

Publication types

MeSH terms