. 2018 Nov 10;8(20):5690-5702.
doi: 10.7150/thno.28742. eCollection 2018.

Clinical significance of PD-1/PD-Ls gene amplification and overexpression in patients with hepatocellular carcinoma

Affiliations

Clinical significance of PD-1/PD-Ls gene amplification and overexpression in patients with hepatocellular carcinoma

Li-Jie Ma et al. Theranostics. .

Abstract

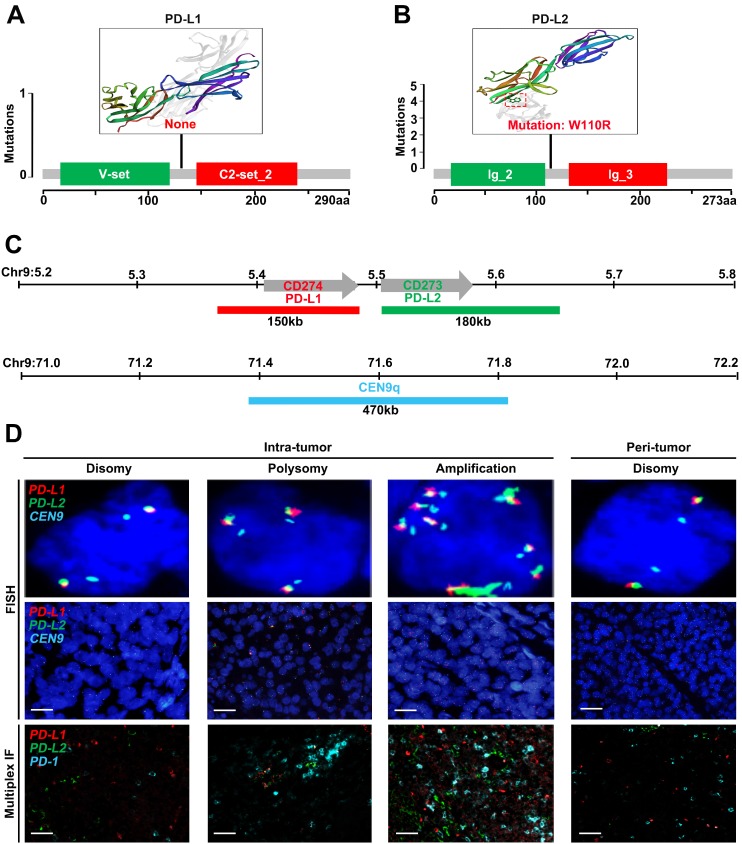
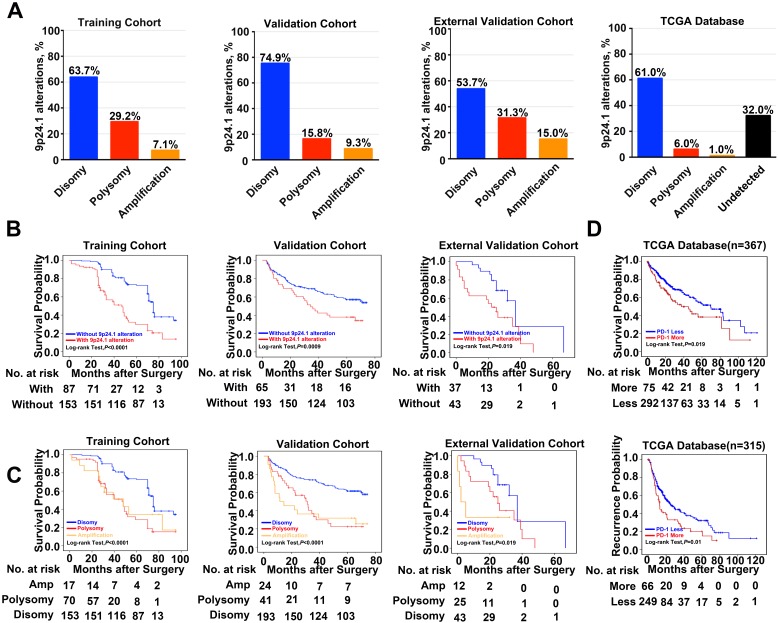
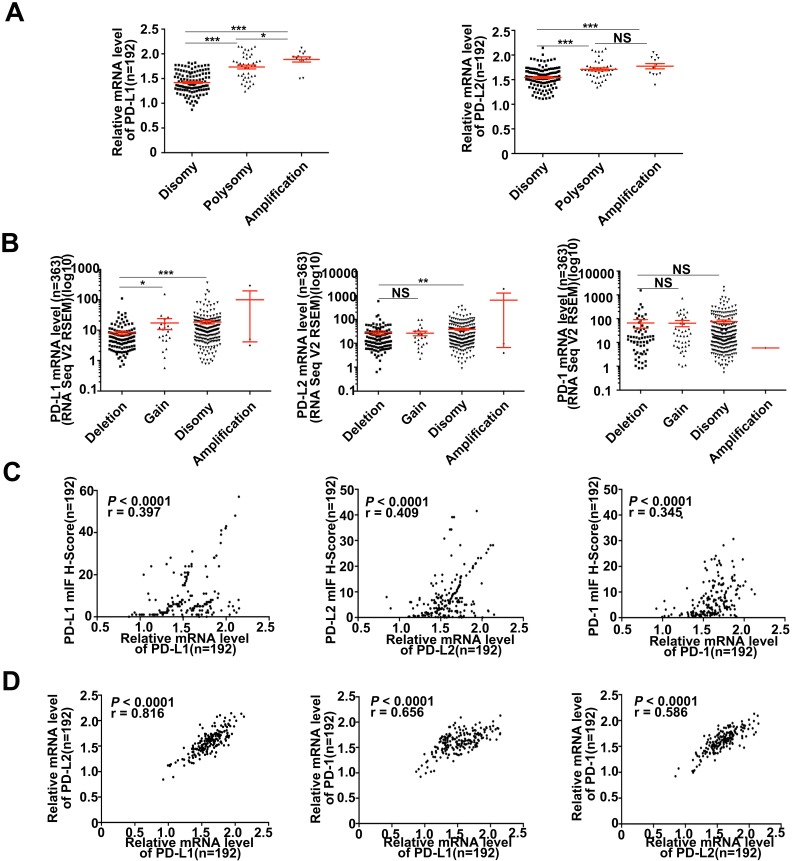
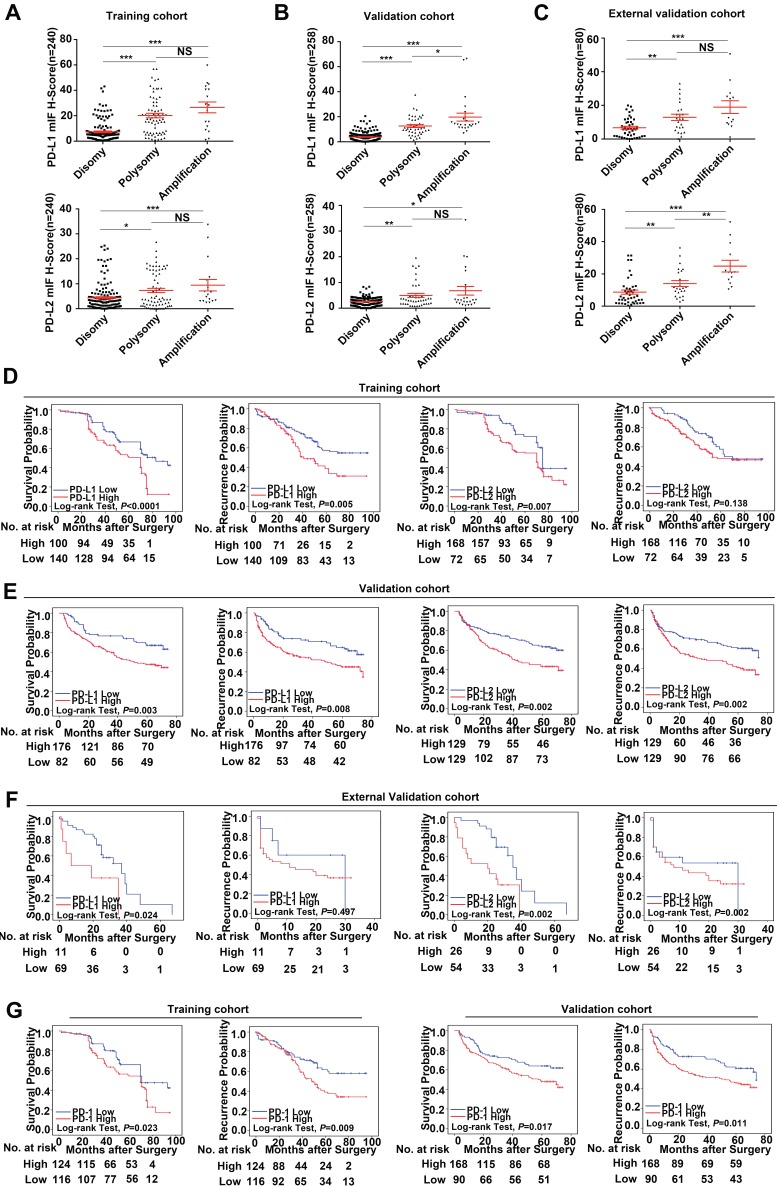
Background: The remarkable clinical activity of PD-1 antibody in advanced hepatocellular carcinoma (HCC) highlights the importance of PD-1/PD-L1-mediated immune escape as therapeutic target in HCC. However, the frequency and prognostic significance of PD-Ls genetic alterations in HCC remain unknown. Methods: Fluorescence in situ hybridization were used to determine PD-Ls genetic alterations, and qPCR data coupled with immunofluorescence were used to measure the mRNA and protein levels of PD-Ls. Clinical relevance and prognostic value of 9p24.1 genetic alterations were investigated on tissue microarray containing three independent cohorts of 578 HCC patients. The results were further validated in an independent cohort of 442 HCC patients from The Cancer Genome Atlas (TCGA) database. Results: In total, 7.1%-15.0% for amplification and 15.8%-31.3% for polysomy of 9p24.1 were revealed in three cohorts of HCC patients, similar to the objective response rate of PD-1 antibody in HCC. Patients with 9p24.1 genetic alterations significantly and independently correlated with unfavorable outcomes than those without. FISH and qPCR data coupled with immunofluorescence revealed that genetic alterations of 9p24.1 robustly contributed to PD-L1 and PD-L2 upregulation. In addition, increased expression of PD-L1 instead of PD-L2 also predicted poor survival by multivariate analyses. Meanwhile, high infiltration of PD-1+ immune cells also indicated dismal survival in HCC. Conclusions: Amplification or higher expression of PD-L1 significantly and independently correlated with unfavorable survival in HCC patients, authenticating the PD-1/PD-L1 axis as rational immunotherapeutic targets for HCC.

Keywords: FISH; PD-Ls; genetic alteration; hepatocellular carcinoma; prognosis.


Conflict of interest statement

Competing Interests: The authors have declared that no competing interest exists.

Figures

Figure 1
Figure 1
Genetic and immunofluorescence analyses of the PD-L1 and PD-L2 loci and PD-1 ligand expression in HCC. (A-B) Distribution of mutation identified in three-dimensional structures on the protein sequence and domain structure of PD-L1 and PD-L2, is detected and depicted from 442 HCC tumor tissues in TCGA database. Hotspot mutation of W110R in PD-L2 is shown in red. (C) Location and color labeling of the CD274/CD273/CEN9q probe on 9p24.1 used for fluorescent in situ hybridization (FISH). The red-labeled CD274/PD-L1, green-labeled CD273/PD-L2 and aqua-labeled CEN9q, a control centromeric probe that maps to 9q21. (D) The top panel shows representative images of FISH results for the various categories, scored as disomy, polysomy, amplification in tumor tissue and disomy in peritumor tissue. PD-L1 in red, PD-L2 in green, fused signals in yellow, and centromeric probe (CEP9q) in aqua. The bottom panel shows corresponding multispectral immunofluorescence (mIF) of PD-L1 (red)/PD-L2 (green)/PD-1(aqua) in the HCC cases with 9p24.1 disomy, polysomy and amplification from top panel. Scale bar=100 μm.
Figure 2
Figure 2
Frequency and prognostic significance of the 9p24.1 alterations in HCC. (A) 9p24.1 alterations evaluated in training, validation, external validation cohorts and TCGA database. HCC are classified by the highest observed level of 9p24.1 alteration in tumor cells: disomy (blue), polysomy (red), amplification (gold) and undetected (black). Percentages of patients with 9p24.1 disomy, polysomy, amplification were summarized. (B) Kaplan-Meier curves showing dismal survival in patients with (red) 9p24.1 alterations than those without (blue) in three independent cohorts. (C) Kaplan-Meier curves showing poorest survival in patients with 9p24.1 amplification (gold) than those with polysomy (red) or disomy (blue) in three independent cohorts. (D) Kaplan-Meier curves showing significant unfavorable survival (n = 367) and increased recurrence (n = 315) in patients with more PD-1 copy number (red) than those with less PD-1 copy number (blue) in TCGA database.
Figure 3
Figure 3
Descriptive and correlational analyses of transcriptional/translational level of PD-L1/PD-L2 and 9p24.1 copy number alterations in HCC patients. (A) The distribution of transcriptional level in each group of the 9p24.1 copy number alterations (n = 192). The y-axis shows relative mRNA level of PD-Ls; the x-axis indicates status of 9p24.1 alterations. A statistically significant increase in relative mRNA level was found in the 9p24.1 amplification subgroups than those in polysomy or disomy. (B) The distribution features of transcriptional level in each group of the PD-L1/PD-L2/PD-1 copy number alterations are validated by RNA seq data from TCGA database (n = 363). The y-axis shows mIF H-score; the x-axis indicates status of 9p24.1 alterations. Data were presented as means ± SEM. *P < 0.05, **P < 0.01, and ***P < 0.001; two-tailed Student's t test. (C) Correlation analysis of PD-L1/PD-L2/PD-1 translational levels and corresponding transcriptional levels in training cohort (n = 192). Significant positive correlations are found between the mIF H-score and relative mRNA level in PD-L1/PD-L2/PD-1. (D) Significant positive correlations are uncovered between PD-Ls and PD-1 in mRNA levels in training cohort (n = 192). Pearson correlation analysis.
Figure 4
Figure 4
Prognostic value and relationship with genetic alterations of PD-Ls/PD-1' protein expression. (A-C) The distribution of PD-Ls' translational level in each group of the 9p24.1 copy number alterations evaluated in training, validation and external validation cohorts. Data were presented as means ± SEM. *P < 0.05, **P < 0.01, and ***P < 0.001; two-tailed Student's t test. (D-F) Kaplan-Meier curves showing dismal survival and increased recurrence in patients with high PD-Ls expression (red) than those with low (blue) in three independent cohorts. (G) Kaplan-Meier curves showing poorer survival and increased recurrence in patients with high-dense PD-1+ immunocytes infiltration (red) than those with low-dense (blue) in training and validation cohorts. P values were determined by the log-rank test.

References

    1. Ferlay J, Soerjomataram I, Dikshit R. et al. Cancer incidence and mortality worldwide: sources, methods and major patterns in GLOBOCAN 2012. Int J Cancer. 2015;136:E359–E386. - PubMed
    1. Knox JJ, Cleary SP, Dawson LA. Localized and systemic approaches to treating hepatocellular carcinoma. J Clin Oncol. 2015;33:1835–1844. - PubMed
    1. Greten TF, Wang XW, Korangy F. Current concepts of immune based treatments for patients with HCC: from basic science to novel treatment approaches. Gut. 2015;64:842–848. - PMC - PubMed
    1. Chen J, Jiang CC, Jin L, Zhang XD. Regulation of PD-L1: a novel role of pro-survival signalling in cancer. Ann Oncol. 2016;27:409–416. - PubMed
    1. Hui R, Garon EB, Goldman JW. et al. Pembrolizumab as first-line therapy for patients with PD-L1-positive advanced non-small cell lung cancer: a phase 1 trial. Ann Oncol. 2017;28:874–881. - PMC - PubMed

Publication types

MeSH terms

Substances