. 2018 Nov 10;8(20):5744-5757.
doi: 10.7150/thno.28898. eCollection 2018.

A Positive Feedback Loop of SLP2 Activates MAPK Signaling Pathway to Promote Gastric Cancer Progression

Affiliations

A Positive Feedback Loop of SLP2 Activates MAPK Signaling Pathway to Promote Gastric Cancer Progression

Wenhui Ma et al. Theranostics. .

Abstract

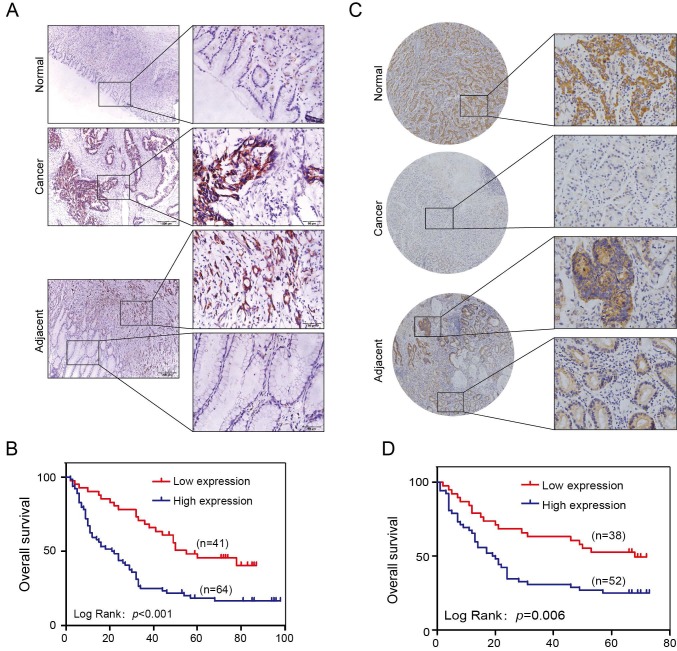
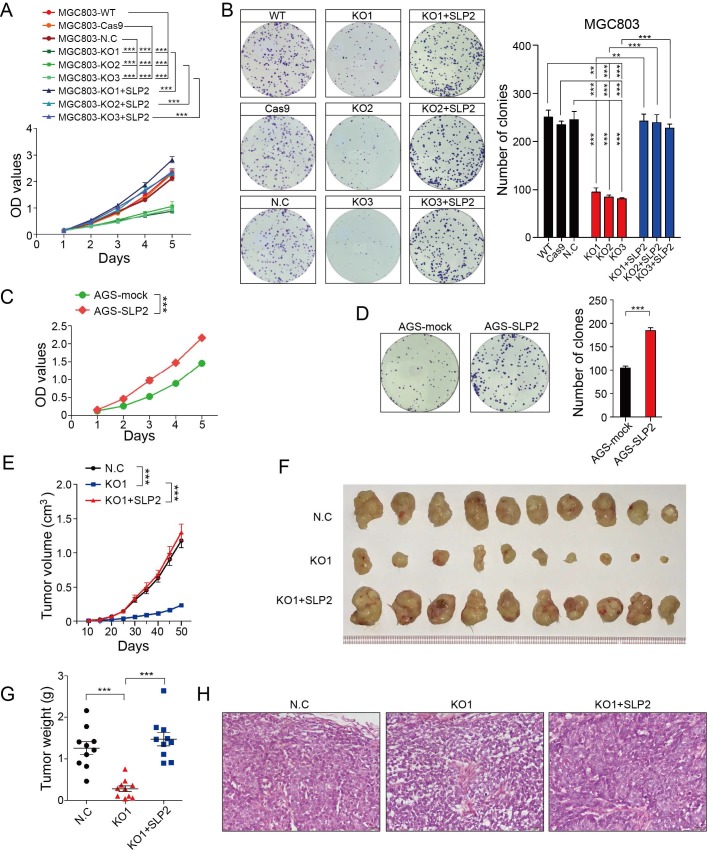
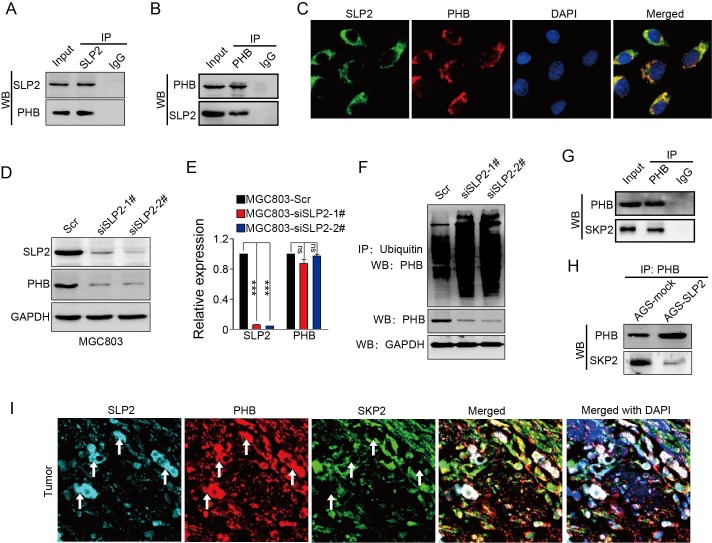
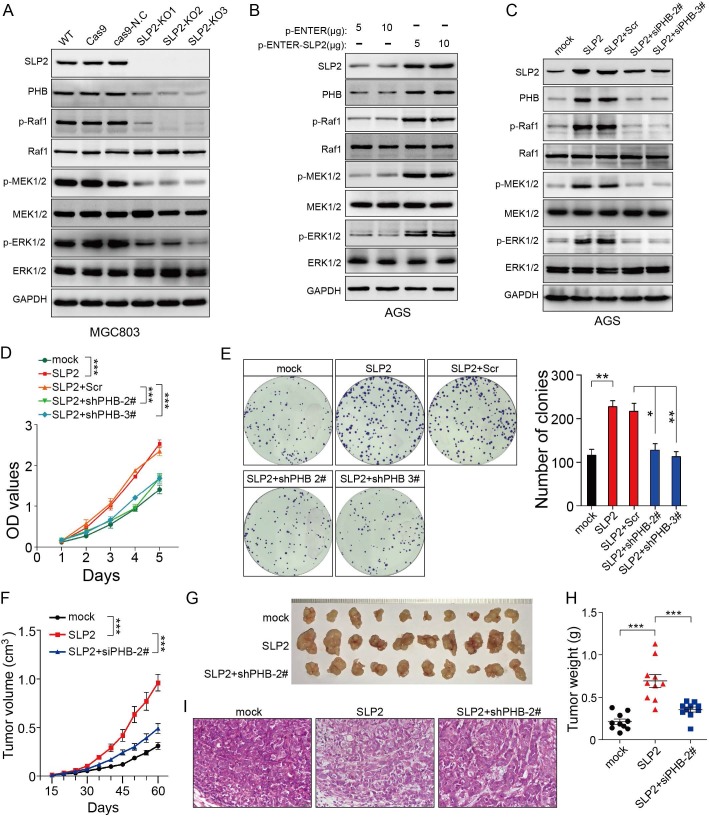
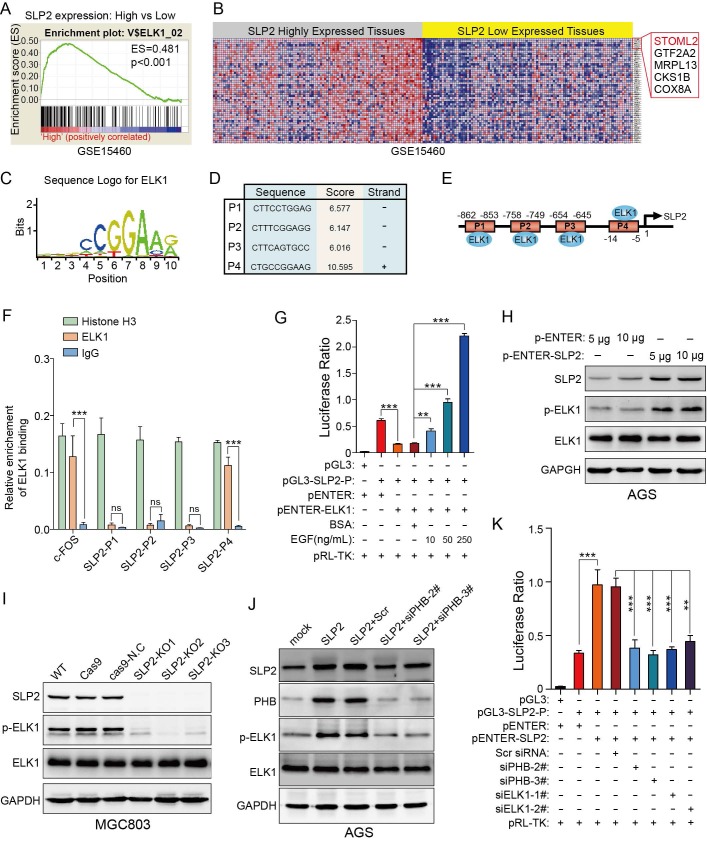
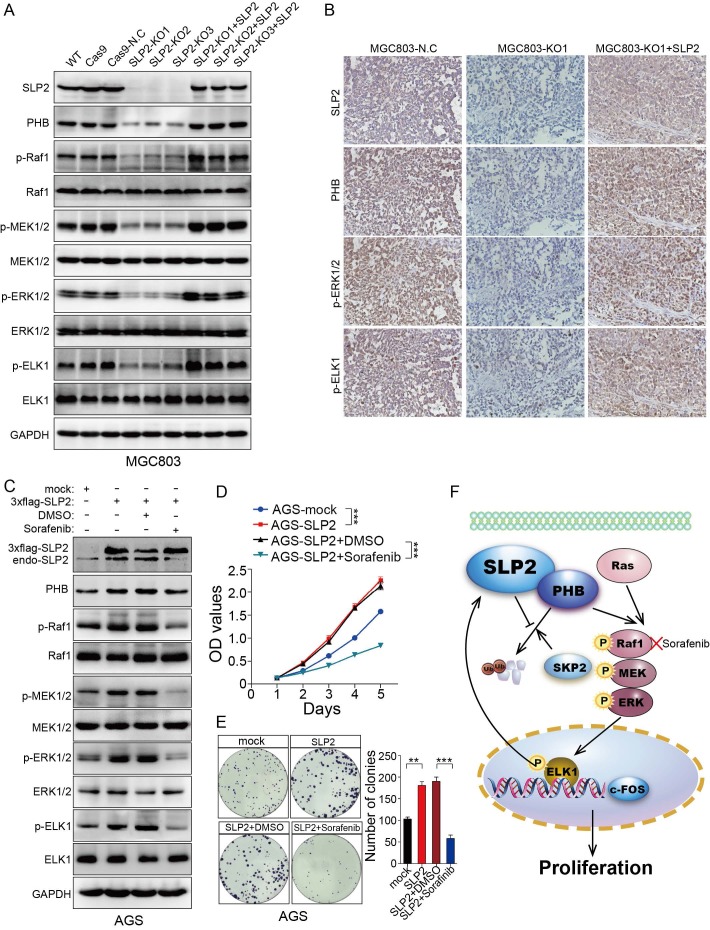
Rationale: This study is to validate the clinicopathologic significance and potential prognostic value of SLP2 in gastric cancer (GC), to investigate the biological function and regulation mechanism of SLP2, and to explore potential therapeutic strategies for GC. Methods: The expression of SLP2 in GC tissues from two cohorts was examined by IHC. The biological function and regulation mechanism of SLP2 and PHB was validated via loss-of-function or gain-of-function experiments. In vitro proliferation detection was used to evaluate the therapeutic effects of Sorafenib. Results: We validated that SLP2 was significantly elevated in GC tissues and its elevation was associated with poor prognosis of patients. Loss of SLP2 drastically suppressed the proliferation of GC cells and inhibited the tumor growth, while SLP2 overexpression promoted the progression of GC. Mechanistically, SLP2 competed against E3 ubiquitin ligase SKP2 to bind with PHB and stabilized its expression. Loss of SLP2 significantly suppressed phosphorylation of Raf1, MEK1/2, ERK1/2 and ELK1. Furthermore, phosphorylated ELK1 could in turn activate transcription of SLP2. Finally, we demonstrated that a Raf1 inhibitor, Sorafenib, was sufficient to inhibit the proliferation of GC cells. Conclusion: Our findings demonstrated a positive feedback loop of SLP2 which leads to acceleration of tumor progression and poor survival of GC patients. This finding also provided evidence for the reason of SLP2 elevation. Moreover, we found that sorafenib might be a potential therapeutic drug for GC and disrupting the interaction between SLP2 and PHB might also serve as a potential therapeutic target in GC.

Keywords: ELK1; PHB; SLP2; gastric cancer; positive feedback loop..


Conflict of interest statement

Competing Interests: The authors have declared that no competing interest exists.

Figures

Figure 1
Figure 1
SLP2 is upregulated in human GC tissues and associated with poor prognosis of patients. A, representative images of SLP2 staining in GC, paired normal and adjacent tissues of internal cohort. B, Kaplan-Meier tumor-free survival curves for GC patients with different SLP2 expression levels in internal cohort. The p value was determined using a log-rank test C, representative images of SLP2 staining in GC, paired normal and adjacent tissues of external cohort. D, Kaplan-Meier tumor-free survival curves GC patients with different SLP2 expression in external cohort. The p value was determined using a log-rank test.
Figure 2
Figure 2
SLP2 promotes proliferation and colony formation rate of GC cell in vitro and tumor growth in vivo. A, proliferation rates of SLP2 knocked-out and restored MGC803 cells measured by CCK8 assay, 5000 indicated cells were plated in 96 culture-plates. MGC803-N.C group were transfected with Cas9 lentivirus and then non-target sgRNA lentivirus. Data are presented as means ± SEM from five independent experiments. The p values were determined using a two-way ANOVA test. ***p < 0.001, B, 500 indicated cells were plated in 6 well culture-plates and the colonies were stained with Giemsa for quantification. Data presented as means ± SEM from three independent experiments. ** p < 0.01, ***p < 0.001, one-way ANOVA test. C, optical density (OD) value of SLP2 overexpressed and mock lentivirus transfected AGS cells measured. 5000 indicated cells were plated in 96 culture-plates. Data presented as means ± SEM from five independent experiments. ***p < 0.001, two-way ANOVA test. D, 500 indicated cells were plated in 6 well culture-plates for colony formation. Data presented as means ± SEM from three independent experiments. ***p < 0.001, unpaired t test. E, 1×10⁶ cell were transplanted into NCG mice (N.C: non-target sgRNA transfected), and tumor growth was monitored after the indicated times. Data are presented as means ± SEM; n = 10 tumors for each group. ***p < 0.001, two-way ANOVA test. F, tumors derived from hind limbs of NCG mice 50 days after subcutaneous injection of indicated cells. G, tumor weight was determined 50 days after transplantation. Data are presented as means ± SEM; n = 10 for each group. p < 0.001, one-way ANOVA test. H, representative H&E staining of primary tumors.
Figure 3
Figure 3
SLP2 competes against SKP2 to bind with PHB and stabilizes its expression. A and B, total cell lysates from MGC803 cell were immunoprecipitated (IP) with anti-SLP2 or anti-PHB and subjected to immunoblot anti-indicated antibody. C, immunofluorescence staining of SLP2 and PHB in MGC803 cells. D, immunoblot analysis of indicated protein in SLP2 KD MGC803 cells. E, mRNA levels of SLP2 and PHB measured by RT-Q-PCR in indicated cells. Data presented as means ± SEM from three independent experiments. ***p < 0.001, ns = not significance, one-way ANOVA test. F, expression vector for HA-ubiquitin combined with Scr or siRNAs were transfected into MGC803 cells. Total cell lysates prepared from the transfected cells stimulated with MG132 (20 μM) for 8h, were precipitated with anti-ubiquitin and subjected to immunoblot with anti-PHB. G, total cell lysates from AGS cell were precipitated with anti-PHB and subjected to immunoblot with anti-PHB and anti-SKP2 antibody. H, concentration of total cell lysates from AGS-mock and AGS-SLP2 cells were measured. Same mass of protein in each group was precipitated with anti-PHB and subjected to immunoblot with anti-PHB and anti-SKP2 antibody. I, Immunofluorescence staining of SLP2, PHB and SKP2 in GC tissue.
Figure 4
Figure 4
PHB is essential for the MAPK signaling pathway activation and tumor growth induced by SLP2. A, B and C, Total cell lysates prepared from the indicated cells were subjected to immunoblot with different antibodies. D, 5000 indicated cells were plated in 96 culture-plates and OD values were measured. Data presented as means ± SEM from five independent experiments. ***p < 0.001, two-way ANOVA test. E, 500 indicated cells were plated in 6 well culture-plates for colony formation. Data presented as means ± SEM from three independent experiments. * p < 0.05, ** p < 0.01, ***p < 0.001, one-way ANOVA test. F, indicated cells (1×10⁶) were transplanted into NCG mice, and tumor growth was monitored. Data are presented as means ± SEM; n = 10 tumors for each group. ***p < 0.001, two-way ANOVA test. G and H, image and weights of tumors derived from hind limbs of NCG mice 60 days after subcutaneous injection of indicated cells (1×10⁶). Data are presented as the means ± SEM (n = 10). ***p < 0.001, Mann-Whitney test. I, representative H&E staining of primary tumors.
Figure 5
Figure 5
ELK1 binds to the promoter region of SLP2 and phosphorylation of ELK1 promotes transcription of SLP2. A and B, gene set enrichment analysis showed enrichment of potential genes regulated by ELK1 in SLP2 highly expressed tissues. C, sequence logo for ELK1 binding derived from Consite database. D and E, prediction of potential ELK1 binding sites in SLP2 promoter region. F, total cell lysates from MGC803 cell were immunoprecipitated (IP) with anti-Histone H3 (positive control), anti-IgG (negative control) and ELK1 and subjected to RT-Q-PCR. Enrichment of c-fos promoter was set as a positive control for ELK1 binding. Data are presented as the means ± SEM from three independent experiments. ***p < 0.001, unpaired t test. G, indicated vectors were co-transfected into 293T cells and cells were stimulated with or without EGF for 48 hr and cell lysates were subjected to luciferase assay. Data are presented as the means ± SEM from three independent experiments. **p < 0.01, ***p < 0.001, one-way ANOVA. H-J, western blot to detect total ELK1 and phosphorylated ELK1 in indicated cells. K, indicated vectors and siRNAs were co-transfected into 293T cells and cell lysates were subjected to luciferase assay. Data are presented as the means ± SEM from three independent experiments. **p < 0.01, ***p < 0.001, one-way ANOVA.
Figure 6
Figure 6
Sorafenib abrogates the accelerated cell proliferation induced by SLP2 elevation through inhibiting activation of MAPK signaling pathway. A, indicated proteins detected by immunoblot in SLP2 knocked-out and restored MGC803 cells. B, IHC analysis of indicated proteins in tumor tissues derived from NCG mice xenograft model. C, indicated proteins of AGS/Vector and AGS/SLP2 combined with treatment of Sorafenib analyzed by western blot. D, 5000 indicated cells were plated in 96 culture-plates and OD values were measured. Data presented as means ± SEM from five independent experiments. ***p < 0.001, two-way ANOVA test. E, 500 indicated cells were plated in 6 well culture-plates for colony formation. DMSO or sorafenib (10 μM) were added to the culture medium. Data presented as means ± SEM from three independent experiments. **p < 0.01, ***p < 0.001, one-way ANOVA test. F, diagrammatic sketch of the downstream and role of SLP2 in GC.

References

    1. Torre LA, Bray F, Siegel RL, Ferlay J, Lortet-Tieulent J, Jemal A. Global cancer statistics, 2012. CA Cancer J Clin. 2015;65:87–108. - PubMed
    1. Hu Y, Huang C, Sun Y, Su X, Cao H, Hu J. et al. Morbidity and Mortality of Laparoscopic Versus Open D2 Distal Gastrectomy for Advanced Gastric Cancer: A Randomized Controlled Trial. J Clin Oncol. 2016;34:1350–7. - PubMed
    1. Chen W, Zheng R, Baade PD, Zhang S, Zeng H, Bray F. et al. Cancer statistics in China, 2015. CA Cancer J Clin. 2016;66:115–32. - PubMed
    1. Cancer Genome Atlas Research N. Comprehensive molecular characterization of gastric adenocarcinoma. Nature. 2014;513:202–9. - PMC - PubMed
    1. Liu D, Zhang L, Shen Z, Tan F, Hu Y, Yu J. et al. Increased levels of SLP-2 correlate with poor prognosis in gastric cancer. Gastric Cancer. 2013;16:498–504. - PubMed

Publication types