

A comparative analysis of socioeconomic inequities in stunting: a case of three middle-income African countries
- PMID: 30555694
- PMCID: PMC6287352
- DOI: 10.1186/s13690-018-0320-2
A comparative analysis of socioeconomic inequities in stunting: a case of three middle-income African countries
Abstract
Background: Despite increased economic growth and development, and existence of various policies and interventions aimed at improving food security and nutrition, majority of countries in sub-Saharan Africa have very high levels of child malnutrition. The prevalence of stunting, an indicator of chronic malnutrition, is especially high.
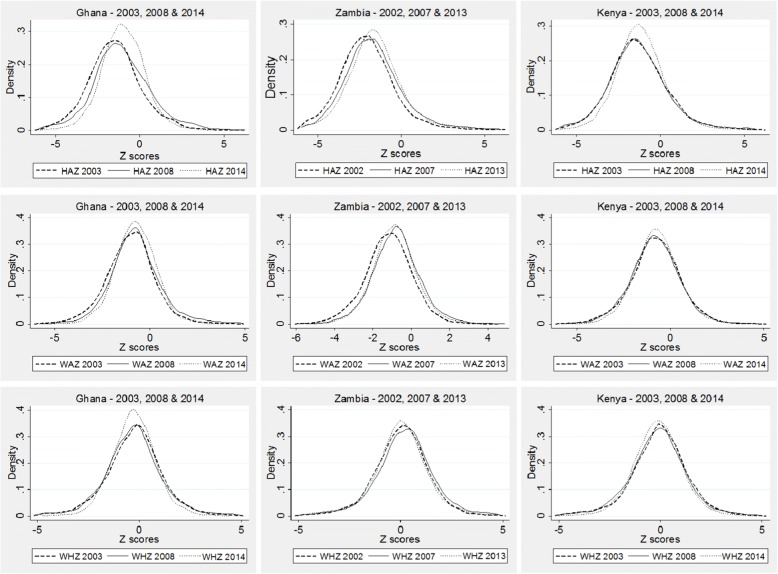
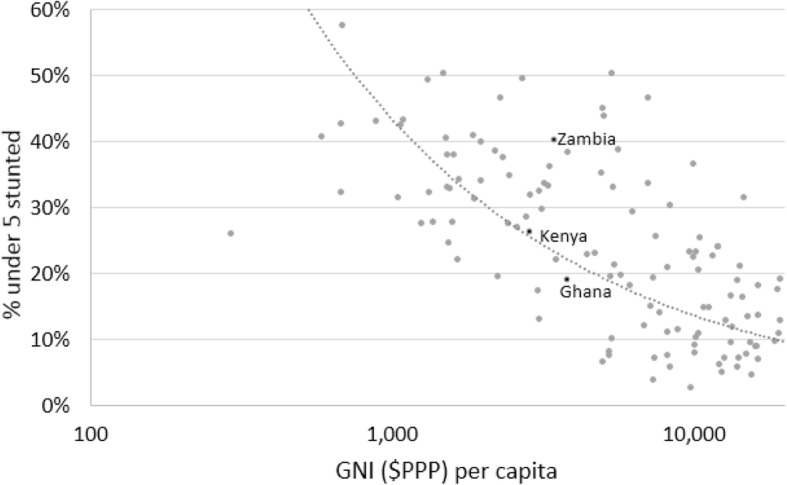
Methods: In this paper, we use Demographic and Health Survey datasets from three countries in the region that obtained middle-income status over the last decade (Ghana, Kenya and Zambia), to provide a comparative quantitative assessment of stunting levels, and examine patterns in stunting inequalities between 2007 and 2014.
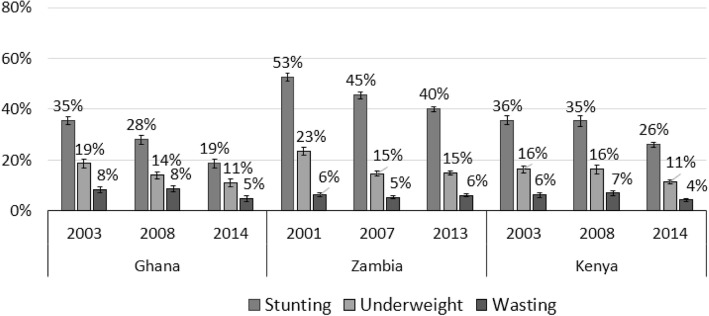
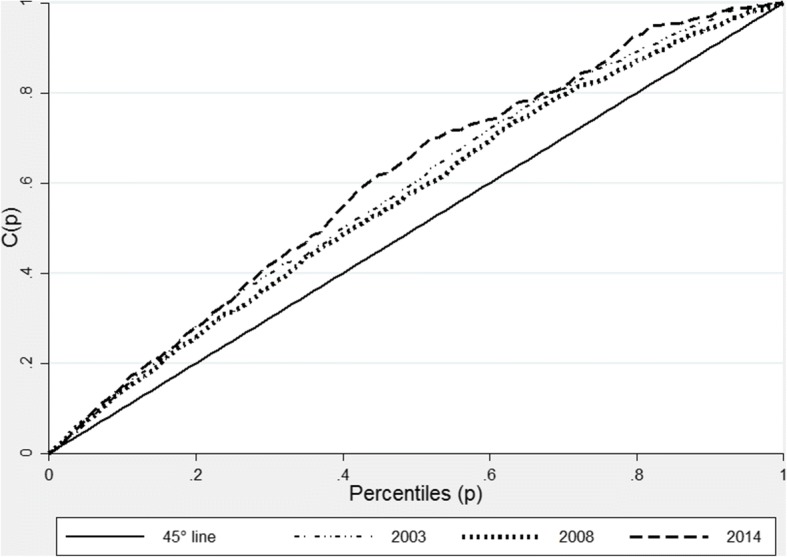
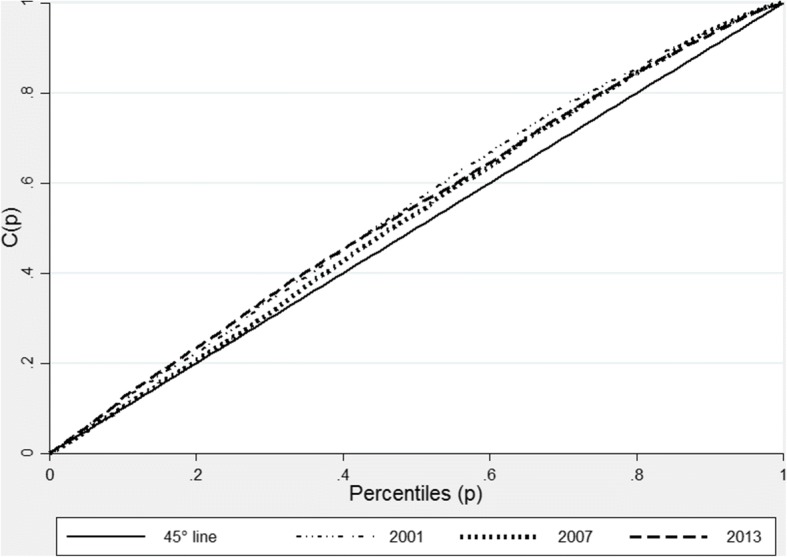
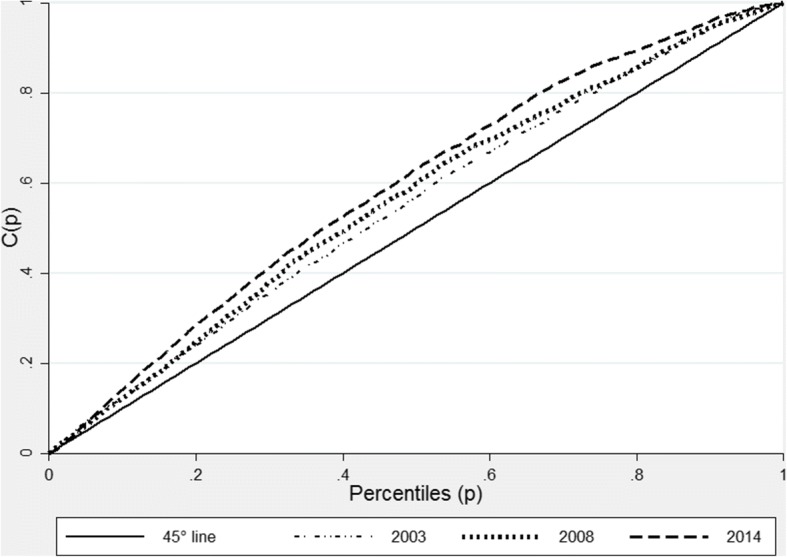
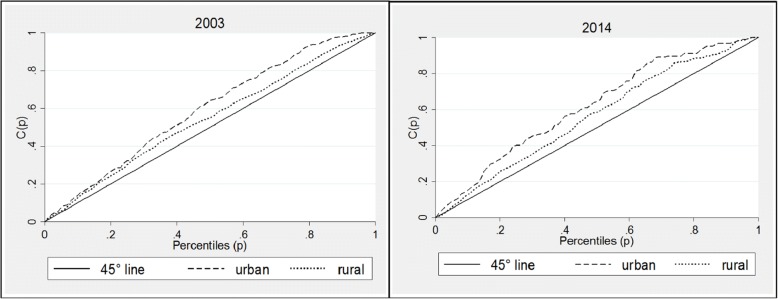
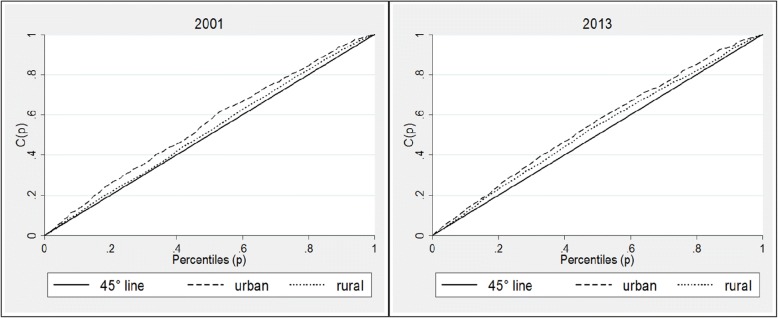
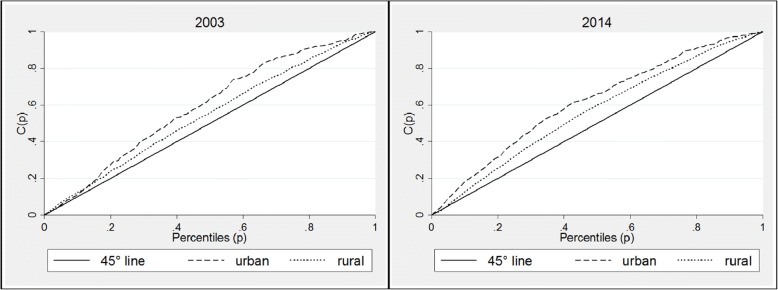
Results: Our analyses reveal that stunting rates decreased in all three countries over the study period, but are still high. In Zambia, 40% of under 5-year olds are stunted, compared to 26% in Kenya and 19% in Ghana. In all three countries, male children and those living in the poorest households have significantly higher levels of stunting. We also observe stark inequalities across socio-economic status, and show that these inequalities have increased over time.
Conclusions: Our results reveal that even with economic gains at the national level, there is need for continued focus on improving the socio-economic levels of the poorest households, if child nutritional outcomes are to improve.
Keywords: Children; Concentration curves; Concentration indices; Ghana; Inequality; Kenya; Malnutrition; Middle-income; Stunting; Sub-Saharan Africa; Zambia.
Conflict of interest statement
Our study is based on Demographic and Health Survey data, which is routinely collected. Procedures and questionnaires for standard DHS have been reviewed and approved by ICF Institutional Review Board (IRB). Additionally, country-specific DHS protocols are reviewed by the ICF IRB and IRBs in Ghana, Kenya and Zambia.Not applicable.The authors declare that they have no competing interests.Springer Nature remains neutral with regard to jurisdictional claims in published maps and institutional affiliations.
Figures
References
-
- Fantom N, Serajuddin U. The World Bank’s Classification of Countries by Income [Internet]. 2016. (Policy Research Working Paper). Report No.: 7528. Available from: https://openknowledge.worldbank.org/bitstream/handle/10986/23628/The0Wor.... Accessed 8 May 2018.
-
- Ranis G, Stewart F, Ramirez A. Economic growth and human development. World Dev. 2000;28(2):197–219. doi: 10.1016/S0305-750X(99)00131-X. - DOI
-
- Bloom DE, Canning D, Sevilla J. The effect of health on economic growth: a production function approach. World Dev. 2004;32(1):1–13. doi: 10.1016/j.worlddev.2003.07.002. - DOI
-
- Kanbur R, Sumner A. Poor countries or poor people? Development assistance and the new geography of global poverty. J Int Dev. 2012;24:686–695. doi: 10.1002/jid.2861. - DOI
LinkOut - more resources
Full Text Sources
