

Changes in northern hemisphere male international rugby union players' body mass and height between 1955 and 2015
- PMID: 30555718
- PMCID: PMC6267308
- DOI: 10.1136/bmjsem-2018-000459
Changes in northern hemisphere male international rugby union players' body mass and height between 1955 and 2015
Abstract
Objectives: We sought to establish the effects of professionalism, which officially began in 1995, on the body mass and height of northern hemisphere male international rugby union (RU) players. We hypothesised that mass would significantly increase following professionalism. We also investigated the changes in size of players according to their playing position, and we compared changes to rugby league (RL) players and the public.
Methods: The body mass and height of players representing their international team for that country's first game of the Five Nations in 1955, 1965, 1975, 1985 and 1995 and, for 2005 and 2015, the Six Nations, were collected from matchday programmes. RL players' data were collected from the Challenge Cup final games played in the same years.
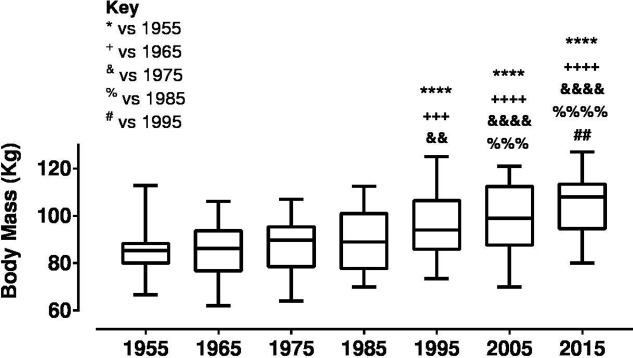
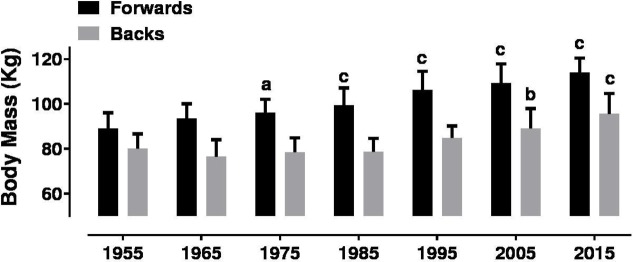
Results: International RU player body mass has significantly increased since 1995. In 1955 mean (±SD) player body mass was 84.8 kg (±8.2); in 2015, it was 105.4 kg (±12.1), an increase of 24.3%. Between 1955 and 2015, the body mass of forwards increased steadily, whereas that of backs has mostly gone up since 1995. RU player body mass gain has exceeded that of RL, but the age-matched difference between RU players and the public has remained relatively constant.
Conclusions: The factors influencing the gain in body mass of rugby players are legion; however, we believe that the interpretation of the law relating to the scrum put-in and changes allowing substitutions have, at least in part, contributed to the observed changes. Injury severity is increasing, and this may be linked to greater forces (caused by greater body mass) occurring in contact. RU law makers should adjust the rules to encourage speed and skill at the expense of mass.
Keywords: body mass; professionalism; rugby union; weight.
Conflict of interest statement
Competing interests: None declared.
Figures


References
-
- Stephens D, Fourie J. Morphological evolution of Springbok rugby players: Implications for racial transformation in South African rugby. South African Journal for Research in Sport, Physical Education and Recreation 2017;39:145–61.
-
- Technology in rugby: GPS systems continue to grow in importance. 2018. Available from: http://www.the42.ie/gps-technology-rugby-1113025-Oct2013/ [Accessed 15 Apr 2018].
-
- Allan Massie: Rugby must ban the big hitters. 2018. Available from: https://www.scotsman.com/sport/rugby-union/allan-massie-rugby-must-ban-t... [Accessed 15 Apr 2018].