. 2018 Mar 12;4(3):900-918.
doi: 10.1021/acsbiomaterials.7b00831. Epub 2018 Feb 3.

Latent, Immunosuppressive Nature of Poly(lactic- co-glycolic acid) Microparticles

Affiliations

Latent, Immunosuppressive Nature of Poly(lactic- co-glycolic acid) Microparticles

Riley P Allen et al. ACS Biomater Sci Eng. .

Erratum in

Abstract

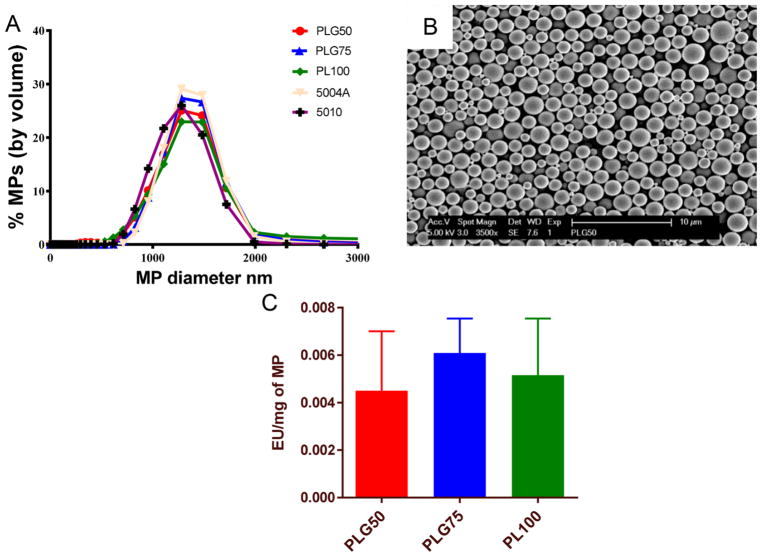
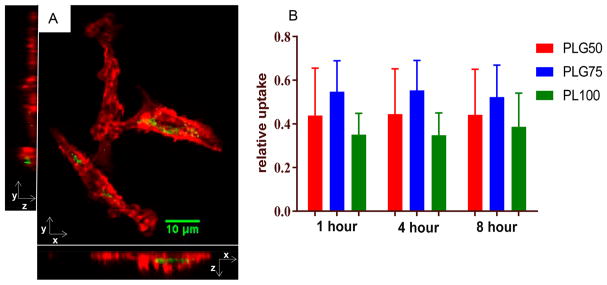
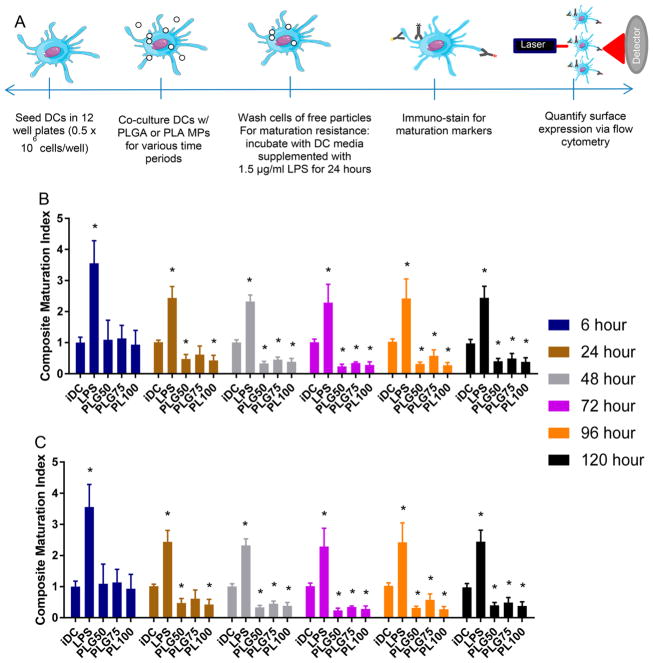
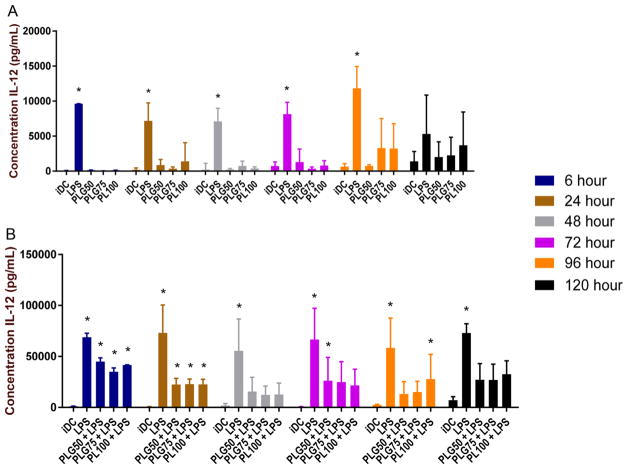
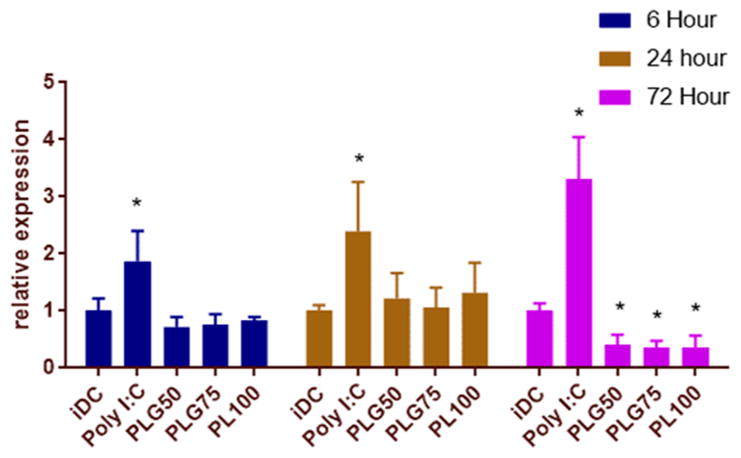
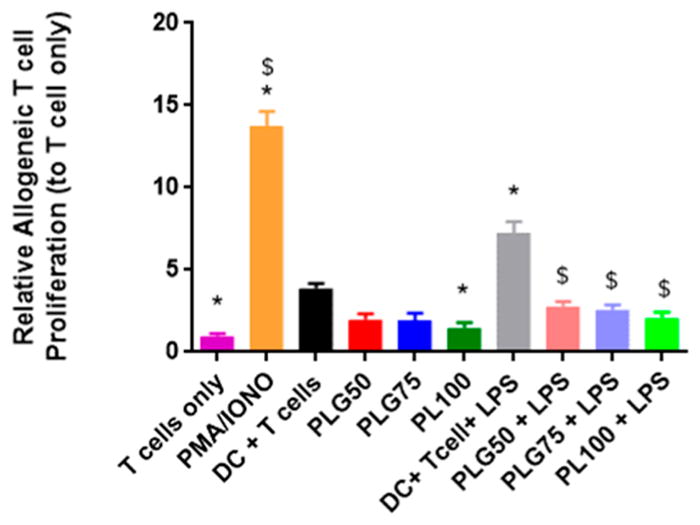
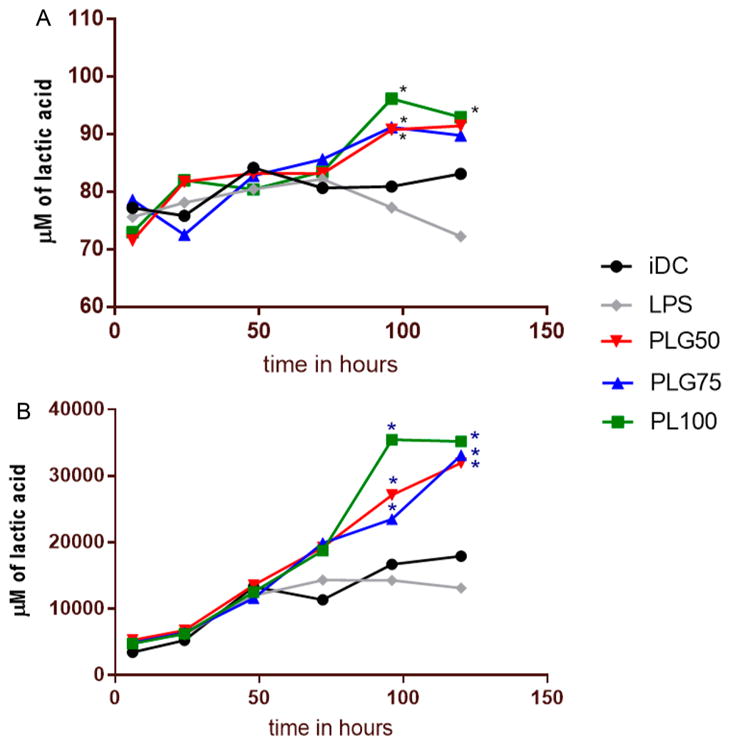
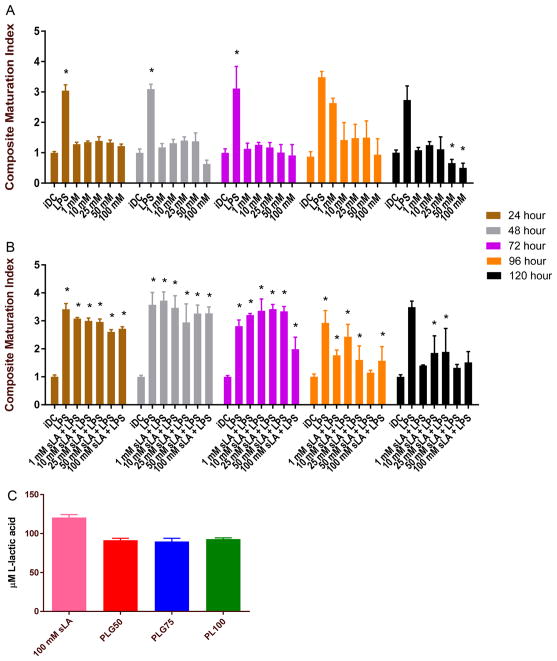
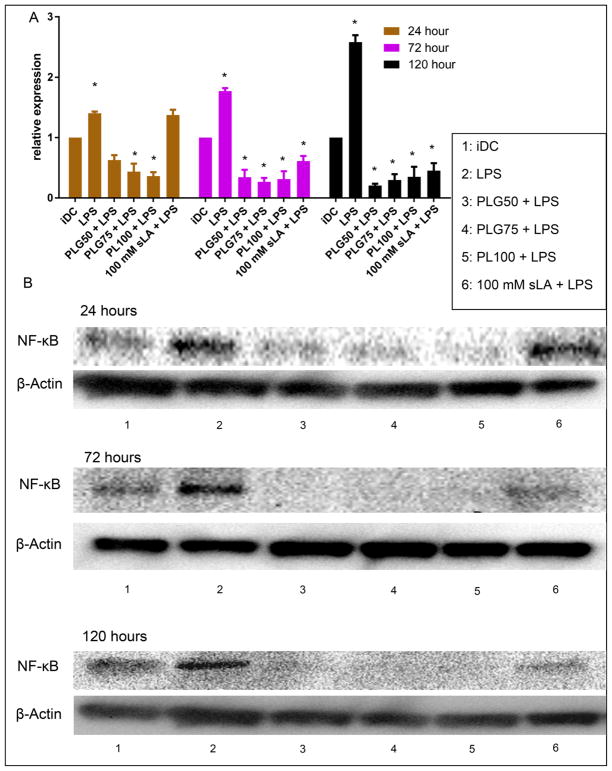
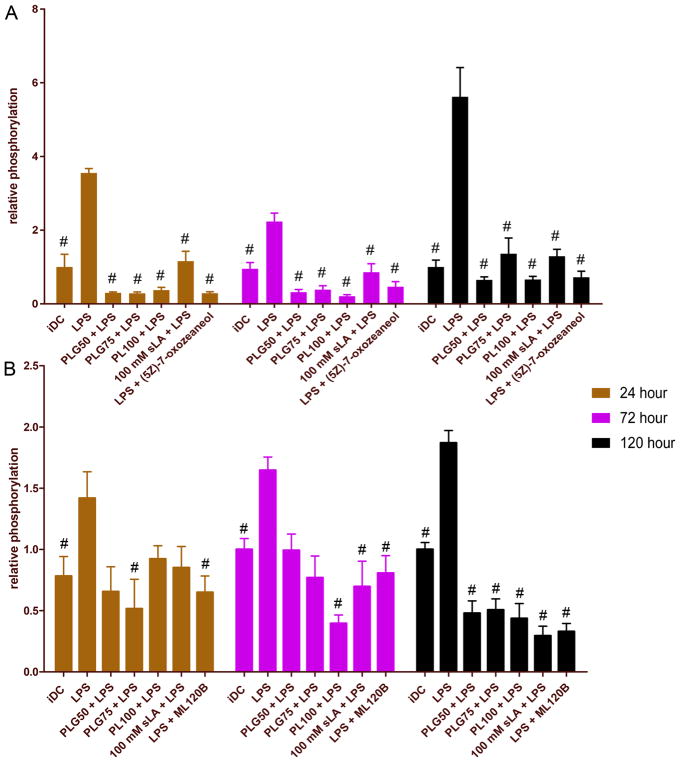
Use of biomaterials to spatiotemporally control the activation of immune cells is at the forefront of biomedical engineering research. As more biomaterial strategies are employed for immunomodulation, understanding the immunogenicity of biodegradable materials and their byproducts is paramount in tailoring systems for immune activation or suppression. Poly(D,L-lactic-co-glycolic acid) (PLGA), one of the most commonly studied polymers in tissue engineering and drug delivery, has been previously described on one hand as an immune adjuvant, and on the other as a nonactivating material. In this study, the effect of PLGA microparticles (MPs) on the maturation status of murine bone marrow-derived dendritic cells (DCs), the primary initiators of adaptive immunity, was investigated to decipher the immunomodulatory properties of this biomaterial. Treatment of bone marrow-derived DCs from C57BL/6 mice with PLGA MPs led to a time dependent decrease in the maturation level of these cells, as quantified by decreased expression of the positive stimulatory molecules MHCII, CD80, and CD86 as well as the ability to resist maturation following challenge with lipopolysaccharide (LPS). Moreover, this immunosuppression was dependent on the molecular weight of the PLGA used to fabricate the MPs, as higher molecular weight polymers required longer incubation to produce comparable dampening of maturation molecules. These phenomena were correlated to an increase in lactic acid both intracellularly and extracellularly during DC/PLGA MP coculture, which is postulated to be the primary agent behind the observed immune inhibition. This hypothesis is supported by our results demonstrating that resistance to LPS stimulation may be due to the ability of PLGA MP-derived lactic acid to inhibit the phosphorylation of TAK1 and therefore prevent NF-κB activation. This work is significant as it begins to elucidate how PLGA, a prominent biomaterial with broad applications ranging from tissue engineering to pharmaceutics, could modulate the local immune environment and offers insight on engineering PLGA to exploit its evolving immunogenicity.

Keywords: dendritic cells; immunogenicity; lactic acid; microparticles; poly(lactic-co-glycolic) acid.


Conflict of interest statement

Notes The authors declare no competing financial interest.

Figures

Figure 1
Figure 1
Poly(D,L-lactic-co-glycolic) MP characterization. (A) Size distribution by volume of fabricated MPs using DLS. (B) Scanning electron microscopy image of the PLG50 formulation showing spherical nature and average size of about 1 μm. (C) Endotoxin levels per milligram of MP as assessed via the ChromoLAL assay; histogram bars represent mean and standard error.
Figure 2
Figure 2
Uptake of 1 μm PLGA MPs. (A) Internalization of MPs by DCs is demonstrated using confocal microscopy. Adherent DCs were incubated with fluorescein (green)-loaded MPs for 1 h and subsequently washed with PBS to remove unphagocytosed MP. DCs were then fixed, permeabilized, and stained for actin cytoskeletal elements (red). The image shows the XY, YZ, and XZ optical sections, confirming engulfment of the MPs. (B) DiD-stained DCs were incubated with rhodamine 6G-loaded MPs and assessed for uptake between 1 and 8 h. The relative uptake was calculated as the number of events double positive for DiD and rhodamine 6G divided by the total number of DiD-stained cells. No significant differences in uptake were observed between the different MP formulations at any time point (n = 3 biological replicates).
Figure 3
Figure 3
Low molecular weight PLGA MPs are immunosuppressive in coculture with DCs. (A) Schematic of the experimental setup used for the maturation and maturation resistance experiments. (B) Dendritic cells were incubated with 2 different formulations of PLGA (50:50 and 75:25) and PLA MPs at time points ranging from 6 to 120 h, washed, and then subsequently immunostained for MHCII, CD80, and CD86. Immature DCs and LPS treated (1.5 μg/mL) DCs served as controls for nonactivated and activated groups, respectively. The composite maturation indices (unweighted average of the expression of CD80, CD86, and MHCII) of DCs at each time point are shown, normalized to the iDC population. (C) Dendritic cells treated with PLGA MPs and subsequently challenged with LPS show resistance to LPS maturation. DCs were incubated with 2 different formulations of PLGA (50:50 and 75:25) and PLA at time points ranging from 6 to 120 h, washed, and then subsequently challenged with LPS (1.5 μg/mL) for 24 h. Pair-wise significant differences from the iDC population are denoted by the * symbol (p ≤ 0.05; n=3 biological replicates).
Figure 4
Figure 4
Secretion of IL-12 is stymied when DCs are cocultured with low molecular weight PLGA/PLA MPs, particularly after LPS stimulation. (A) Supernatants were collected from DCs cocultured with PLGA or PLA, and IL-12 was quantified using an absorbance-based sandwich ELISA. The * symbol represents a pairwise comparison to the immature DC population (p ≤ 0.05). (B) Supernatants were collected from DCs cocultured with PLGA or PLA and then challenged with 1.5 μg/mL LPS. IL-12 was quantified using a sandwich ELISA. The * symbol represents a pairwise comparison to the immature DC population (p ≤ 0.05). Data shown represent mean cytokine concentration ± standard error (n ≥ 3 biological replicates).
Figure 5
Figure 5
Low molecular weight PLGA MPs downregulate the expression of CCR7 after 72 h of MP incubation. After coculture with PLGA MPs for 6, 24, and 72 h, DCs were lifted and immunostained for CCR7. At 72 h of incubation, PLGA-treated DCs had significantly lowered expression of CCR7. The * symbol represents a pairwise comparison to the immature DC population (p ≤ 0.05; n = 3 biological replicates for each group).
Figure 6
Figure 6
PLGA MP uptake induces suppressive DCs, resulting in decreased allogeneic T cell proliferation downstream. Dendritic cells were pretreated with PLGA MPs for 48 h and then cocultured with allogenic CD4+ T cells for 72 h or challenged with LPS for 24 h then cocultured with allogenic CD4+ T cells for 72 h. Allogenic T cell proliferation was measured via CFSE dye dilution. Controls in this experiment included a population of T cells only and T cells exposed to a stimulatory cocktail of PMA and IONO. The * symbol represents a pairwise comparison to the DC + T cell group (p ≤ 0.05). The $ symbol represents a pairwise comparison to the DC+ T cell+ LPS group (p ≤ 0.05). Data shown represent the mean ± standard error (n = 3 biological replicates).
Figure 7
Figure 7
Intracellular and extracellular concentrations of L-lactic acid increase with DC exposure to PLGA MPs. (A) The intracellular concentration of L-lactic acid in DCs after coculture with PLGA/PLA MPs was measured using an enzyme-based, colorimetric assay. The * symbol represents a pairwise significant difference in lactic acid concentration compared to that of iDCs (p < 0.05; n = 3 biological replicates per formulation per time point). Significance was determined using a repeated measure two-way ANOVA followed by pairwise comparisons (posthoc Tukey test) between the mean of every treatment group. Error bars were omitted to aid in visual distinction between formulations. (B) The extracellular L-lactic acid in the supernatant of DCs cocultured with PLGA and PLA MPs was measured using an enzyme-based colorimetric assay by collecting the supernatants at 6, 24, 48, 72, 96, and 120 h, pelleting any free particles by centrifugation at ~10 000 g, and then using a lactic acid detection kit from Cayman Chemical. The * symbol represents a pairwise significance difference as compared to iDC (p < 0.05; n = 3 biological replicates per formulation per time point). Significance was determined using two-way ANOVA of the entire data set followed by comparisons of the means of each treatment group at each time point using a posthoc Tukey test. Error bars were omitted to aid in visual distinction between formulations.
Figure 8
Figure 8
Culturing DCs with sodium-L-lactate at high concentrations produces similar immunosuppressive effects to those observed when DCs are cocultured with low molecular weight PLGA/PLA MPs. (A) DCs were cultured with sLA at concentrations ranging from 1 to 100 mM. The composite maturation indexes (unweighted average of the expression of CD80, CD86, and MHCII) of DCs at each time point are shown, normalized to the iDC population. At higher concentrations of lactic acid, specifically 100 mM, the composite maturation index for DCs is significantly lower than that of the immature DC population, particularly at later time points. The * symbol represents a pairwise comparison to the immature DC population (p ≤ 0.05). (B) DCs were cultured with sodium-L-lactate at concentrations ranging from 1 to 100 mM at the designated time points and then challenged with LPS for 24 h. Similar to PLGA/PLA MPs, sLA provides resistance to maturation at higher concentrations. The * symbol represents a pairwise comparison to the iDC population (p ≤ 0.05) (C) The intracellular L-lactic acid concentration was measured after 120 h of incubation with 100 mM lactic acid in the culture media. Interestingly, the concentration of intracellular L-lactic acid is similar to the concentration that accumulates after incubation with PLA and PLGA MPs after 120 h. Data shown represent the mean ± standard error (n ≥ 3 biological replicates).
Figure 9
Figure 9
Coculture with PLGA MPs drives downregulation of the inflammatory transcription factor NF-κB in LPS-stimulated DCs. (A) Dendritic cells (1 × 10⁶) were incubated with 2 different formulations of PLGA MPs (50:50 and 75:25), PLA MPs, or 100 mM sLA for 24,72, and 120 h, washed, and then subsequently challenged with LPS (1.5 μg/mL) for 24 h. Cell lysate was then extracted and separated via SDS PAGE. Protein was then transferred and subsequently stained for NF-κB. Relative expression represents the optical density (OD; determined using ImageJ) of the band at 65 kDa for each treatment normalized to that for the iDC group. Pair-wise significant differences from the iDC population is denoted by the * symbol (p ≤ 0.05; n ≥ 3 biological replicates). Data shown represent the mean and standard error. (B) Representative Western blotting bands as measured using chemiluminescence. The top band from each time point is the representative band at 65 kDa correlating with the NF-κB expression. The bottom band from each time point represents the loading control at 42 kDa correlating with the expression of endogenous β-actin.
Figure 10
Figure 10
Dendritic cell coculture with PLGA MPs decreases the phosphorylation of (A) TAK1 and (B) IKKβ, two important intermediates in the canonical activation of NF-κB. Dendritic cells (0.5 × 10⁶) were incubated with 2 different formulations of PLGA MPs (50:50, 75:25), PLA MPs, or 100 mM sLA for 24,72, and 120 h, washed, and then subsequently challenged with LPS (1.5 μg/mL) for 24 h. Cell were then fixed, permeabilized, and stained with antiphosphoTAK1 or anti-phosphoIKKβ antibodies and subsequently analyzed by flow cytometry. Relative phosphorylation represents the mean fluorescence intensity normalized to the iDC population. A pairwise significant difference from LPS-treated population is denoted by the # symbol (p ≤ 0.05; n ≥ 3 biological replicates). Data shown represent the mean and standard error.
Figure 11
Figure 11
Immunophenotypic changes in MP-treated DCs vary with the molecular weight of PLGA molecular weight. Briefly, DCs were cocultured with PLGA MPs of higher molecular weight (5004A and 5010) for time points ranging from 6 to 120 h. The composite maturation indexes (unweighted average of the expression of CD80, CD86, and MHCII) of DCs at each time point are shown, normalized to the iDC population. The larger molecular weight polymers 5004A and 5010 do not provide immunosuppressive effects but rather maintain a CMI similar to that of immature dendritic cells. Immature DCs and LPS-stimulated DCs (1.5 μg/mL) serve as negative and positive controls, respectively. PLG50-treated cells serve as a reference to prior experiments. Pair-wise significant differences from the iDC population are denoted by the * symbol (p ≤ 0.05; n = 3 biological replicates). Data shown represent the mean ± standard error.

References

    1. Savina A, Amigorena S. Phagocytosis and antigen presentation in dendritic cells. Immunol Rev. 2007;219:143–56. - PubMed
    1. Slawek A, Maj T, Chelmonska-Soyta A. CD40, CD80, and CD86 costimulatory molecules are differentially expressed on murine splenic antigen-presenting cells during the pre-implantation period of pregnancy, and they modulate regulatory T cell abundance, peripheral cytokine response, and pregnancy outcome. Am J Reprod Immunol. 2013;70(2):116–26. - PubMed
    1. Villadangos JA, Schnorrer P, Wilson NS. Control of MHC class II antigen presentation in dendritic cells: a balance between creative and destructive forces. Immunol Rev. 2005;207:191–205. - PubMed
    1. Sallusto F, Schaerli P, Loetscher P, Schaniel C, Lenig D, Mackay CR, Qin S, Lanzavecchia A. Rapid and coordinated switch in chemokine receptor expression during dendritic cell maturation. Eur J Immunol. 1998;28(9):2760–9. - PubMed
    1. Forster R, Davalos-Misslitz AC, Rot A. CCR7 and its ligands: balancing immunity and tolerance. Nat Rev Immunol. 2008;8(5):362–71. - PubMed