. 2018 Oct 10;2(12):1533-1549.
doi: 10.1002/hep4.1266. eCollection 2018 Dec.

Diet-Induced Dysbiosis and Genetic Background Synergize With Cystic Fibrosis Transmembrane Conductance Regulator Deficiency to Promote Cholangiopathy in Mice

Affiliations

Diet-Induced Dysbiosis and Genetic Background Synergize With Cystic Fibrosis Transmembrane Conductance Regulator Deficiency to Promote Cholangiopathy in Mice

Dominique Debray et al. Hepatol Commun. .

Abstract

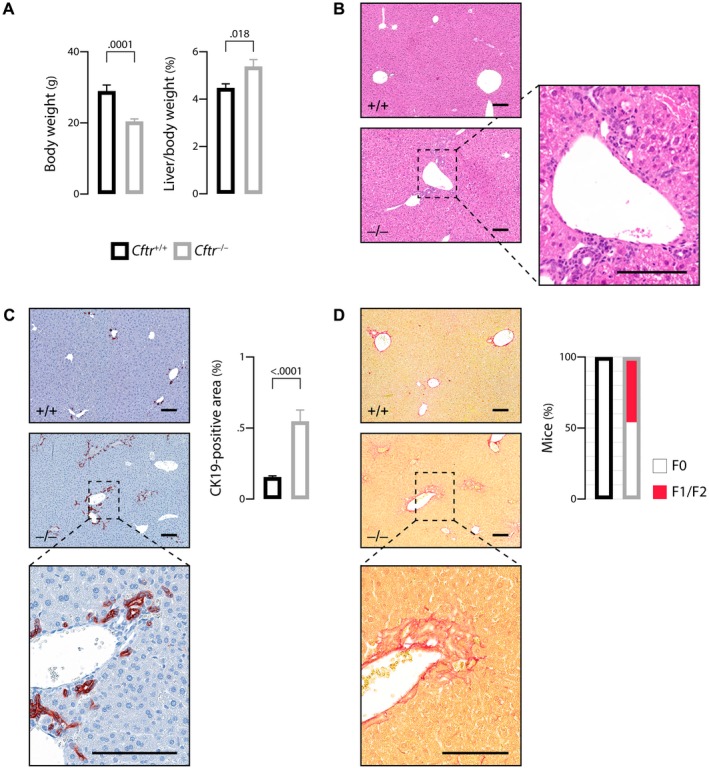
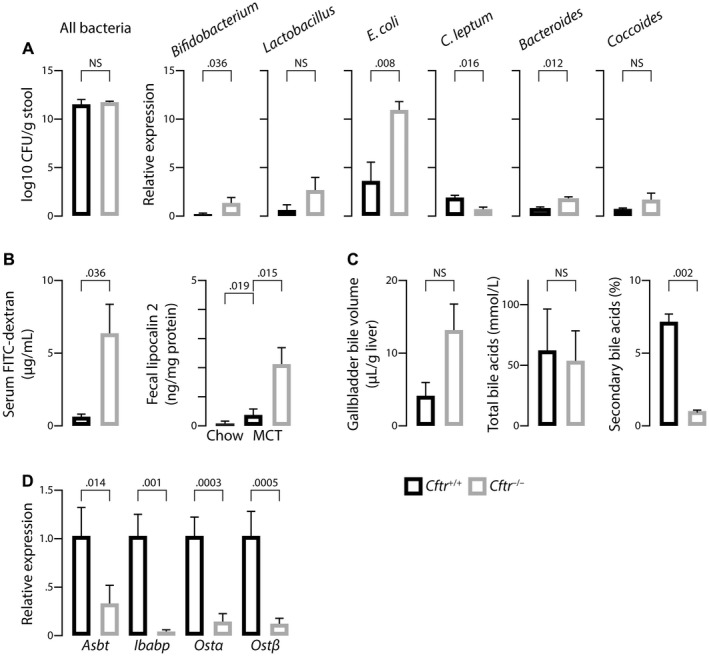
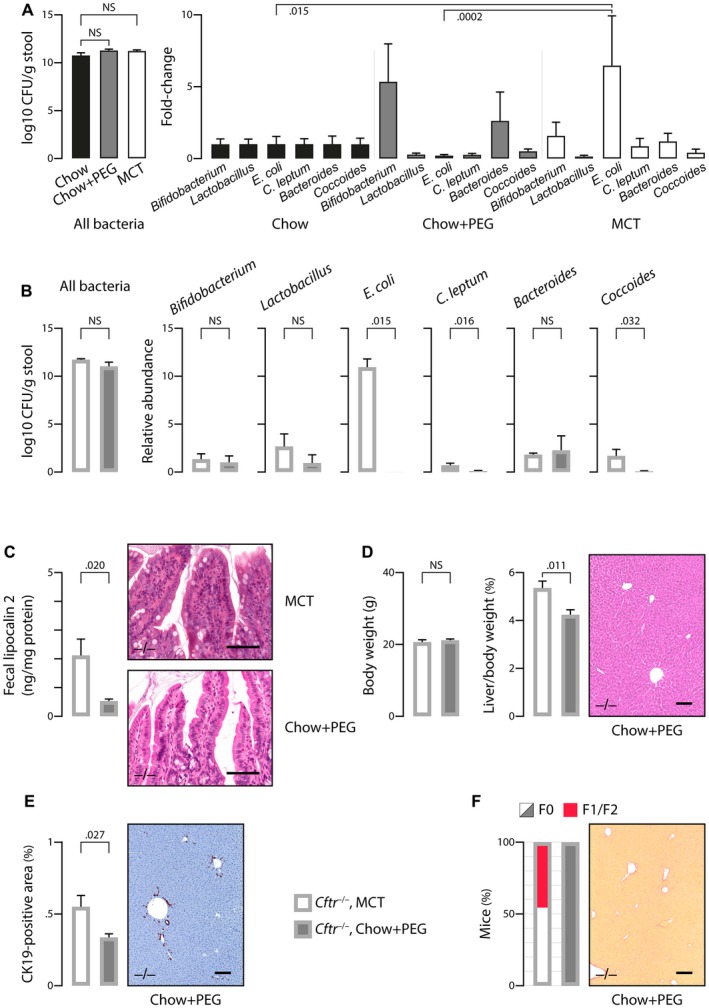
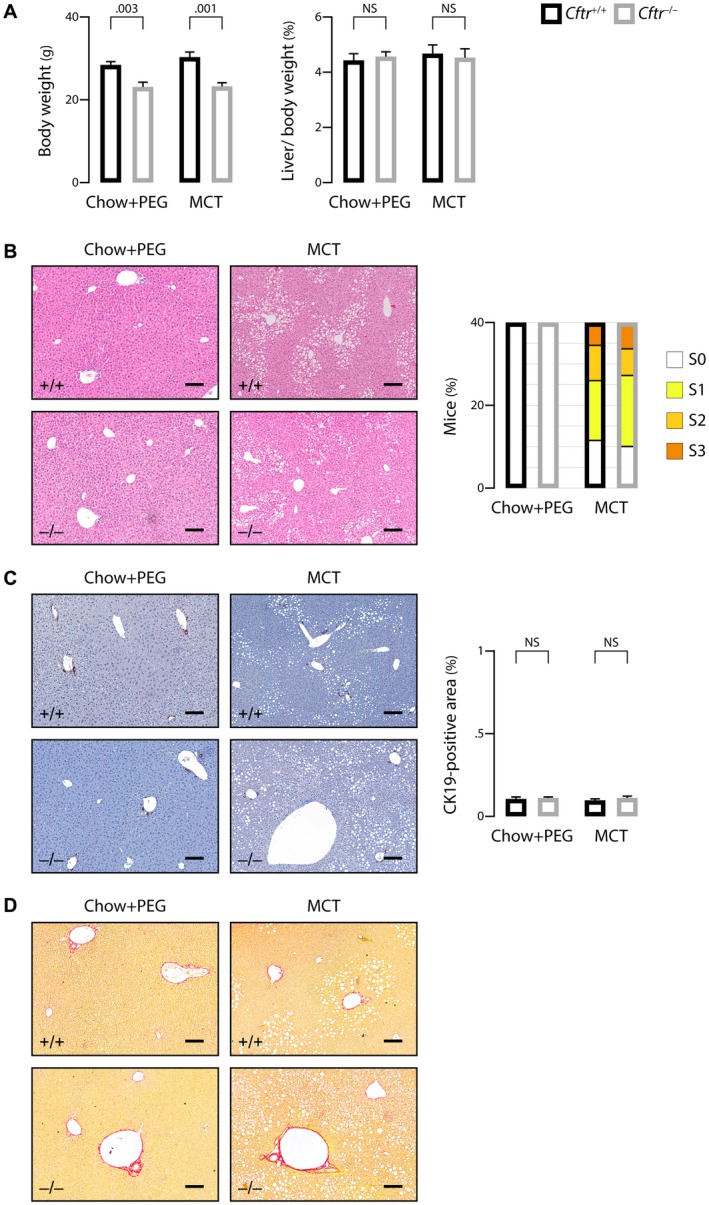
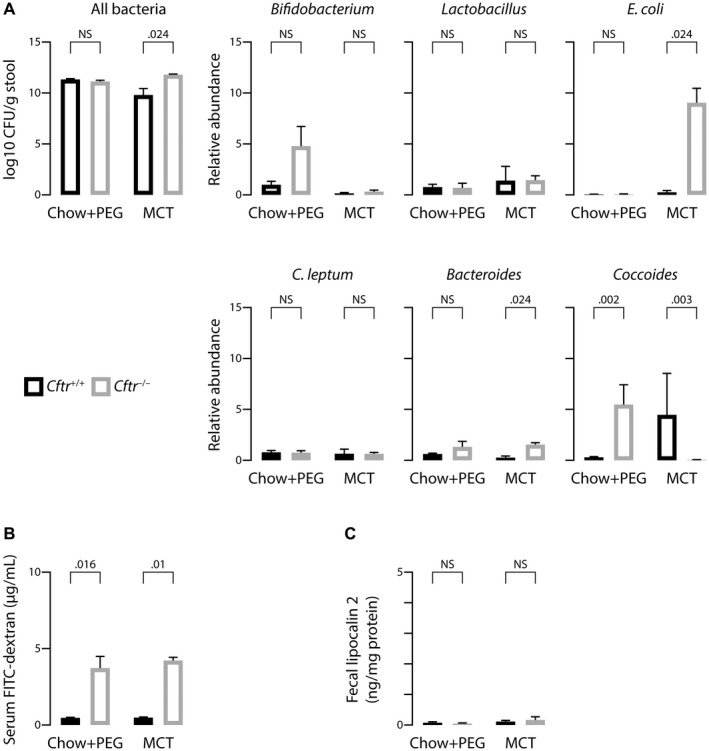
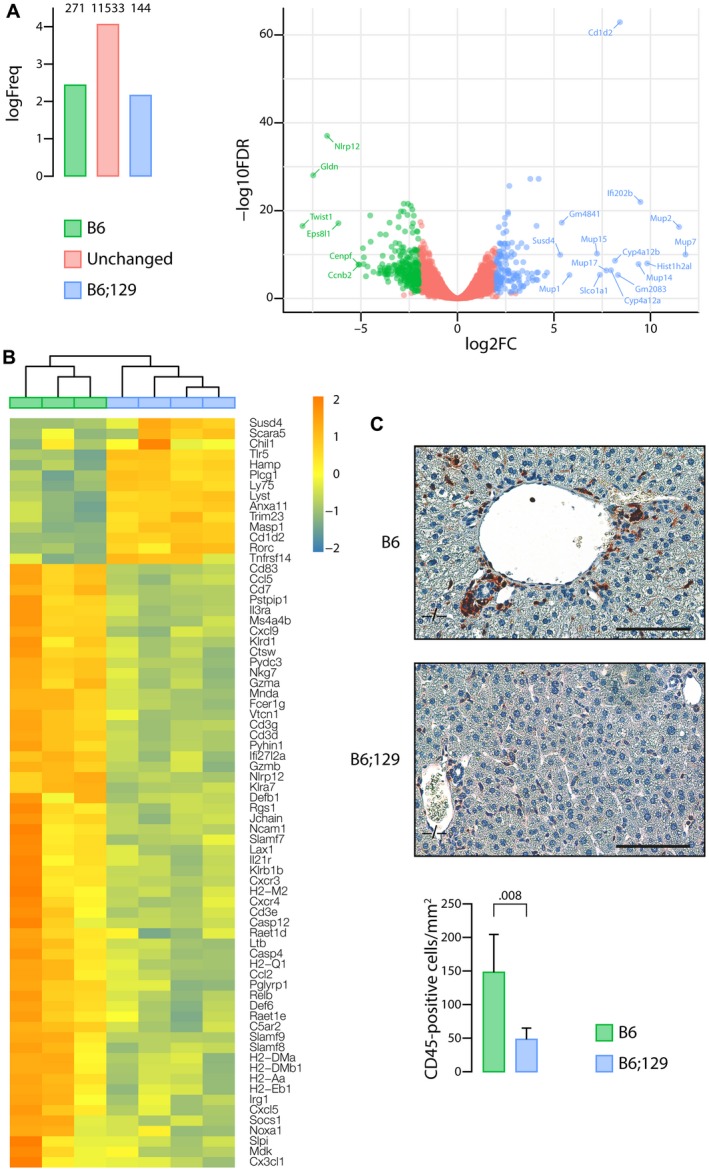
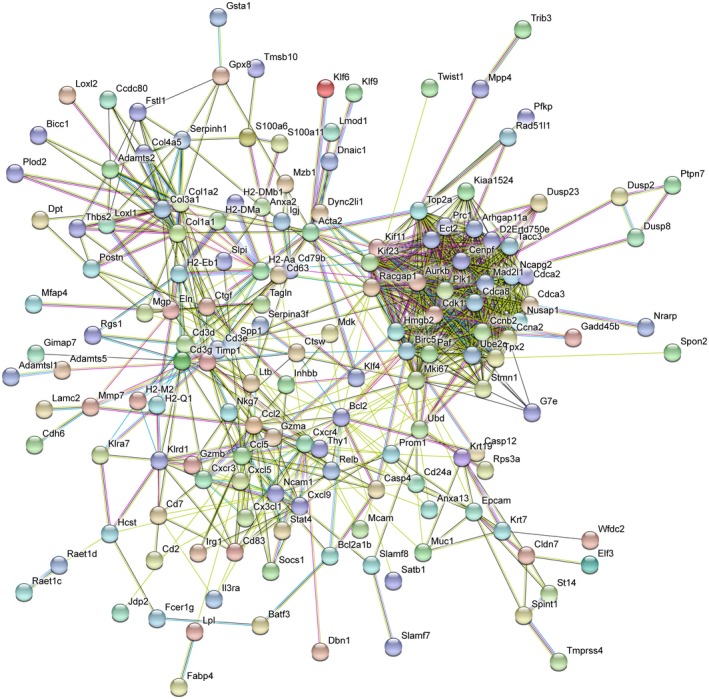
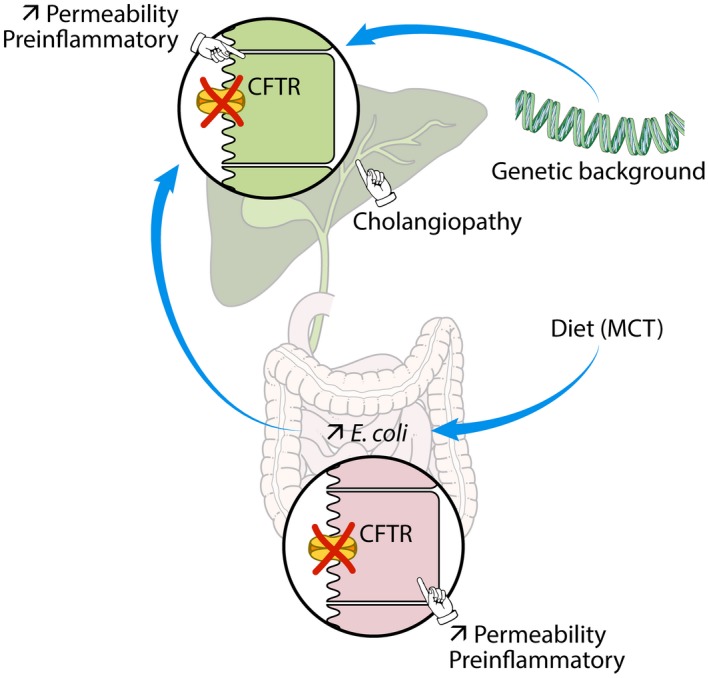
The most typical expression of cystic fibrosis (CF)-related liver disease is a cholangiopathy that can progress to cirrhosis. We aimed to determine the potential impact of environmental and genetic factors on the development of CF-related cholangiopathy in mice. Cystic fibrosis transmembrane conductance regulator (Cftr)-/- mice and Cftr +/+ littermates in a congenic C57BL/6J background were fed a high medium-chain triglyceride (MCT) diet. Liver histopathology, fecal microbiota, intestinal inflammation and barrier function, bile acid homeostasis, and liver transcriptome were analyzed in 3-month-old males. Subsequently, MCT diet was changed for chow with polyethylene glycol (PEG) and the genetic background for a mixed C57BL/6J;129/Ola background (resulting from three backcrosses), to test their effect on phenotype. C57BL/6J Cftr -/- mice on an MCT diet developed cholangiopathy features that were associated with dysbiosis, primarily Escherichia coli enrichment, and low-grade intestinal inflammation. Compared with Cftr +/+ littermates, they displayed increased intestinal permeability and a lack of secondary bile acids together with a low expression of ileal bile acid transporters. Dietary-induced (chow with PEG) changes in gut microbiota composition largely prevented the development of cholangiopathy in Cftr -/- mice. Regardless of Cftr status, mice in a mixed C57BL/6J;129/Ola background developed fatty liver under an MCT diet. The Cftr -/- mice in the mixed background showed no cholangiopathy, which was not explained by a difference in gut microbiota or intestinal permeability, compared with congenic mice. Transcriptomic analysis of the liver revealed differential expression, notably of immune-related genes, in mice of the congenic versus mixed background. In conclusion, our findings suggest that CFTR deficiency causes abnormal intestinal permeability, which, combined with diet-induced dysbiosis and immune-related genetic susceptibility, promotes CF-related cholangiopathy.


Figures

Figure 1
Figure 1
Mouse model of CF‐related cholangiopathy. C57BL/6J Cftr‐/‐ mice and Cftr+/+ littermates on an MCT diet were subjected to the following phenotypic analyses at the age of 3 months: body weight (A, left panel) and liver‐to‐body weight ratio (A, right panel); hematoxylin and eosin staining of liver tissue sections (B, a portal fibro‐inflammatory infiltrate is shown in inset); CK19 immunostaining of liver tissue sections (C, left panel) and morphometric analysis of CK19‐immunostained areas (C, right panel); sirius red staining of liver tissue sections (D, left panel) and count of mice according to the staging of fibrosis17 (F0: none; F1: portal fibrosis; F2: periportal fibrosis without bridging) (D, right panel). Scale bar: 100 µm; means ± SEM of at least 7 animals.
Figure 2
Figure 2
Gut–liver axis in the mouse model of CF‐related cholangiopathy. C57BL/6J Cftr‐/‐ mice and Cftr+/+ littermates on an MCT diet were subjected to the following analyses at the age of 3 months: quantification of fecal bacteria by qPCR targeting bacteria 16S ribosomal RNA (A); dosage of FITC–dextran in portal blood, following gavage (B, left panel) and enzyme‐linked immunosorbent assay (ELISA) of fecal lipocalin 2 (B, right panel); measurement of gallbladder bile volume after overnight feeding (C, left panel), total bile acid concentrations (C, middle panel), and proportion of secondary bile acids (deoxycholic acid, hyodeoxycholic acid, lithocholic acid, and their conjugates) (C, right panel) in gallbladder bile; and reverse‐transcription qPCR analyses of bile acid transporters in the terminal ileum (D). Means ± SEM of at least 4 animals.
Figure 3
Figure 3
Diet‐induced changes in the gut microbiota and CF mouse phenotype. (A) The effect of diet was evaluated in C57BL/6J wild‐type mice that were fed a chow diet with or without PEG or a high MCT diet (n = 8/group) and were subjected to fecal microbiota analyses by qPCR targeting bacteria 16S ribosomal RNA at the age of 3 months. (B‐F) C57BL/6J Cftr‐/‐ mice that were fed an MCT diet as in Figs. 1 and 2, or a chow diet with PEG supply, were subjected to the following analyses at the age of 3 months: quantification of fecal bacteria by qPCR targeting bacteria 16S ribosomal RNA (B); ELISA of fecal lipocalin 2 (C, left panel) and hematoxylin and eosin staining of intestinal tissue sections (C, right panel, showing an inflammatory infiltrate in MCT‐fed mice as opposed to those under PEG); body weight and liver‐to‐body weight ratio (D, left and middle panels) and hematoxylin and eosin staining of liver tissue sections (D, right panel, showing normal histology in mice under PEG); CK19 immunostaining of liver tissue sections (E, right panel, showing minimal ductular reaction in mice under PEG) and morphometric analysis of CK19‐immunostained areas (E, left panel); sirius red staining of liver tissue sections (F, right panel, showing the absence of fibrosis in mice under PEG) and count of mice according to the staging of fibrosis17 (F0: none; F1: portal fibrosis; F2: periportal fibrosis without bridging) (F, left panel). Scale bar: 100 µm; means ± SEM of at least 4 animals.
Figure 4
Figure 4
Effect of genetic background on liver phenotype in CF mice. C57BL/6J;129/Ola Cftr‐/‐ mice and Cftr+/+ littermates were randomly assigned at weaning to high MCT diet or chow diet with PEG supply and subjected to the following analyses at the age of 3 months: body weight (A, left panel) and liver‐to‐body weight ratio (A, right panel); hematoxylin and eosin staining of liver tissue sections (B, left panel) and count of animals in each group according to the score of steatosis (S0: <5%; S1: 5%‐33%; S2: 34%‐66%; S3: >66%) (B, right panel); CK19 immunostaining of liver tissue sections (C, left panel) and morphometric analysis of CK19‐immunostained areas (C, right panel); and sirius red staining (F0 according to the staging of fibrosis17 in all mice) (D). Scale bar: 100 µm; means ± SEM of at least 7 animals.
Figure 5
Figure 5
Effect of genetic background on features of the gut–liver axis in CF mice. C57BL/6J;129/Ola Cftr‐/‐ mice and Cftr+/+ littermates were randomly assigned at weaning to high MCT diet or chow diet with PEG supply and subjected to the following analyses at the age of 3 months: quantification of fecal bacteria by qPCR targeting bacteria 16S ribosomal RNA (A); dosage of FITC–dextran in portal blood following gavage (B); and ELISA of fecal lipocalin 2 (C). Means ± SEM of at least 4 animals.
Figure 6
Figure 6
Immune‐related pathways underlying the genetic susceptibility to CF‐related cholangiopathy. Liver tissue samples from MCT‐fed Cftr −/− mice in the C57BL/6J (B6) (n = 3) or C57BL/6J;129/Ola (B6;129) (n = 4) background were subjected to RNA sequencing analyses. (A) Number of genes overexpressed in C57BL/6J (green) or in C57BL/6J;129/Ola (blue) or expressed at similar levels in both groups (red) (left panel) and volcano plot (right panel). The x axis represents the log2 of fold‐changes (log2[FC]), and the y axis represents the log10 of corrected P values (false discovery rate [FDR]) for differential gene expression analysis of the two groups (‐log10FDR). Significant overexpression of transcripts in one group versus the other was defined by a log of fold change (FC) >2 and a corrected P value <5.10‐2. (B) Heat map of differentially expressed genes with FDR <5%, related to immunity and inflammation. (C) CD45 immunostaining of liver tissue sections (upper and middle panels) and count of CD45‐positive cells (lower panel). Scale bar: 100 µm; means ± SEM of 5 animals.
Figure 7
Figure 7
Protein–protein association networks underlying CF‐related cholangiopathy. The 10.5 version of the STRING database51 was used to search for protein–protein association networks among genes overexpressed in the liver of MCT‐fed Cftr −/− mice in the congenic C57BL/6J background (Fig. 6A). Proteins with only one or no association were removed.
Figure 8
Figure 8
Mechanistic model of CF‐related cholangiopathy. The absence of apical CFTR triggers abnormal permeability and a pre‐inflammatory status both in cholangiocytes and enterocytes. The genetic background promotes an ill‐adapted response to gut‐derived pathobiont, which is aggravated by diet‐induced dysbiosis. The combined failure of CFTR‐deficient cholangiocytes and host immunity in this response leads to bile duct damage.

References

    1. Koh C, Sakiani S, Surana P, Zhao X, Eccleston J, Kleiner DE, et al. Adult‐onset cystic fibrosis liver disease: diagnosis and characterization of an underappreciated entity. Hepatology 2017;66:591‐601. - PMC - PubMed
    1. Boelle PY, Debray D, Guillot L, Clement A, Corvol H; French CF Modifier Gene Study Investigators . Cystic fibrosis liver disease: outcomes and risk factors in a large cohort of French patients. Hepatology 2018. 10.1002/hep.30148. - DOI - PMC - PubMed
    1. Lindblad A, Glaumann H, Strandvik B. Natural history of liver disease in cystic fibrosis. Hepatology 1999;30:1151‐1158. - PubMed
    1. Debray D, Narkewicz MR, Bodewes F, Colombo C, Housset C, de Jonge HR, et al. Cystic fibrosis‐related liver disease: research challenges and future perspectives. J Pediatr Gastroenterol Nutr 2017;65:443‐448. - PubMed
    1. Lindblad A, Hultcrantz R, Strandvik B. Bile‐duct destruction and collagen deposition: a prominent ultrastructural feature of the liver in cystic fibrosis. Hepatology 1992;16:372‐381. - PubMed