The Impact of Electrical Charge Delivery on Inhibition of Mechanical Hypersensitivity in Nerve-Injured Rats by Sub-Sensory Threshold Spinal Cord Stimulation
- PMID: 30556616
- PMCID: PMC6374184
- DOI: 10.1111/ner.12910
The Impact of Electrical Charge Delivery on Inhibition of Mechanical Hypersensitivity in Nerve-Injured Rats by Sub-Sensory Threshold Spinal Cord Stimulation
Abstract
Objectives: Spinal cord stimulation (SCS) represents an important neurostimulation therapy for pain. A new ultra-high frequency (10,000 Hz) SCS paradigm has shown improved pain relief without eliciting paresthesia. We aim to determine whether sub-sensory threshold SCS of lower frequencies also can inhibit mechanical hypersensitivity in nerve-injured rats and examine how electric charge delivery of stimulation may affect pain inhibition by different patterns of subthreshold SCS.
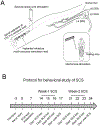
Materials and methods: We used a custom-made quadripolar electrode (Medtronic Inc., Minneapolis, MN, USA) to provide bipolar SCS epidurally at the T10 to T12 vertebral level. According to previous findings, SCS was tested at 40% of the motor threshold, which is considered to be a sub-sensory threshold intensity in rats. Paw withdrawal thresholds to punctate mechanical stimulation were measured before and after SCS in rats that received an L5 spinal nerve ligation.
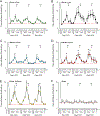
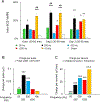
Results: Both 10,000 Hz (10 kHz, 0.024 msec) and lower frequencies (200 Hz, 1 msec; 500 Hz, 0.5 msec; 1200 Hz; 0.2 msec) of subthreshold SCS (120 min) attenuated mechanical hypersensitivity, as indicated by increased paw withdrawal thresholds after stimulation in spinal nerve ligation rats. Pain inhibition from different patterns of subthreshold SCS was not governed by individual stimulation parameters. However, correlation analysis suggests that pain inhibition from 10 kHz subthreshold SCS in individual animals was positively correlated with the electric charges delivered per second (electrical dose).
Conclusions: Inhibition of neuropathic mechanical hypersensitivity can be achieved with low-frequency subthreshold SCS by optimizing the electric charge delivery, which may affect the effect of SCS in individual animals.
Keywords: Electrical charge; nerve injury; pain; rat; spinal cord stimulation.
© 2018 International Neuromodulation Society.
Figures


Similar articles
-
Conventional and kilohertz-frequency spinal cord stimulation produces intensity- and frequency-dependent inhibition of mechanical hypersensitivity in a rat model of neuropathic pain.Anesthesiology. 2013 Aug;119(2):422-32. doi: 10.1097/ALN.0b013e31829bd9e2. Anesthesiology. 2013. PMID: 23880991 Free PMC article.
-
Modulation of Spinal Nociceptive Transmission by Sub-Sensory Threshold Spinal Cord Stimulation in Rats After Nerve Injury.Neuromodulation. 2020 Jan;23(1):36-45. doi: 10.1111/ner.12975. Epub 2019 Jun 4. Neuromodulation. 2020. PMID: 31162783
-
Conventional-SCS vs. Burst-SCS and the Behavioral Effect on Mechanical Hypersensitivity in a Rat Model of Chronic Neuropathic Pain: Effect of Amplitude.Neuromodulation. 2018 Jan;21(1):19-30. doi: 10.1111/ner.12731. Epub 2017 Nov 27. Neuromodulation. 2018. PMID: 29178358
-
Conventional and Novel Spinal Stimulation Algorithms: Hypothetical Mechanisms of Action and Comments on Outcomes.Neuromodulation. 2017 Aug;20(6):525-533. doi: 10.1111/ner.12624. Epub 2017 May 31. Neuromodulation. 2017. PMID: 28568898 Review.
-
Quantitative Sensory Testing in Spinal Cord Stimulation: A Narrative Review.Neuromodulation. 2024 Aug;27(6):1026-1034. doi: 10.1016/j.neurom.2024.03.005. Epub 2024 Apr 18. Neuromodulation. 2024. PMID: 38639705 Review.
Cited by
-
A Narrative Review of the Dorsal Root Ganglia and Spinal Cord Mechanisms of Action of Neuromodulation Therapies in Neuropathic Pain.Brain Sci. 2024 Jun 9;14(6):589. doi: 10.3390/brainsci14060589. Brain Sci. 2024. PMID: 38928589 Free PMC article. Review.
-
The influence of High Dose Spinal Cord Stimulation on the descending pain modulatory system in patients with failed back surgery syndrome.Neuroimage Clin. 2019;24:102087. doi: 10.1016/j.nicl.2019.102087. Epub 2019 Nov 12. Neuroimage Clin. 2019. PMID: 31795057 Free PMC article.
-
Visualizing the modulation of neurokinin 1 receptor-positive neurons in the superficial dorsal horn by spinal cord stimulation in vivo.Pain. 2025 Feb 1;166(2):428-437. doi: 10.1097/j.pain.0000000000003361. Epub 2024 Aug 13. Pain. 2025. PMID: 39140483 Free PMC article.
-
Spinal Cord Stimulation Attenuates Below-Level Mechanical Hypersensitivity in Rats After Thoracic Spinal Cord Injury.Neuromodulation. 2021 Jan;24(1):33-42. doi: 10.1111/ner.13248. Epub 2020 Aug 8. Neuromodulation. 2021. PMID: 32770848 Free PMC article.
-
Characterization of preclinical models to investigate spinal cord stimulation for neuropathic pain: a systematic review and meta-analysis.Pain Rep. 2025 Jan 13;10(1):e1228. doi: 10.1097/PR9.0000000000001228. eCollection 2025 Feb. Pain Rep. 2025. PMID: 39816902 Free PMC article. Review.
References
-
- Geurts JW, Joosten EA, and van KM Current status and future perspectives of spinal cord stimulation in treatment of chronic pain. Pain 2017; 158 :771–774. - PubMed
-
- Linderoth B and Foreman RD Conventional and Novel Spinal Stimulation Algorithms: Hypothetical Mechanisms of Action and Comments on Outcomes. Neuromodulation 2017; 20 :525–533. - PubMed
-
- Foreman RD and Linderoth B Neural mechanisms of spinal cord stimulation. Int.Rev.Neurobiol 2012; 107 :87–119. - PubMed
-
- Guan Y Spinal cord stimulation: neurophysiological and neurochemical mechanisms of action. Curr.Pain Headache Rep 2012; 16 :217–225. - PubMed
MeSH terms
Grants and funding
LinkOut - more resources
Full Text Sources
Other Literature Sources
Research Materials

