. 2019 Mar;36(3):332-342.
doi: 10.1080/07420528.2018.1541901. Epub 2018 Dec 17.

Diurnal variation of metabolites in three individual participants

Affiliations

Diurnal variation of metabolites in three individual participants

Fangyi Gu et al. Chronobiol Int. 2019 Mar.

Abstract

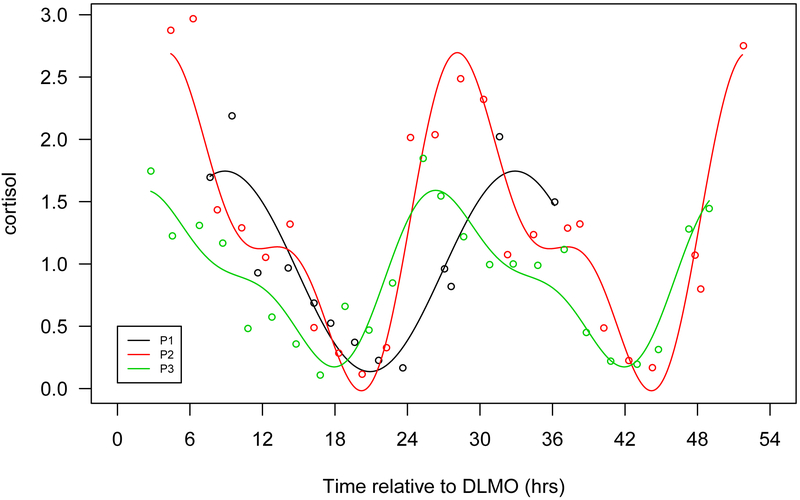
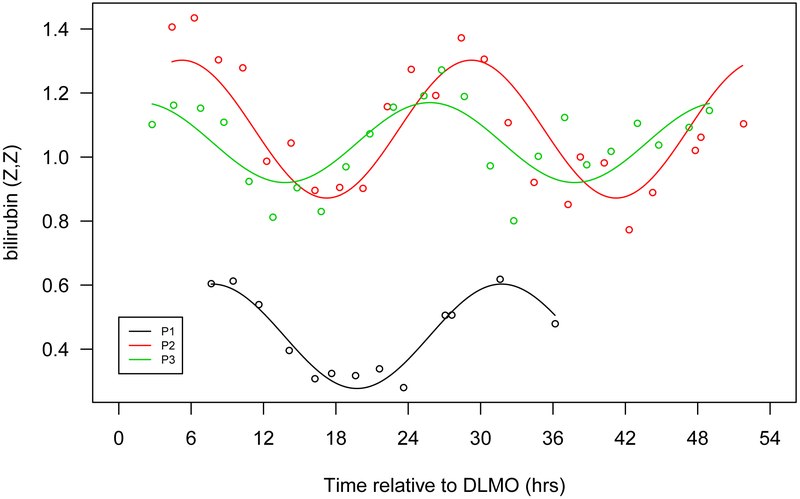
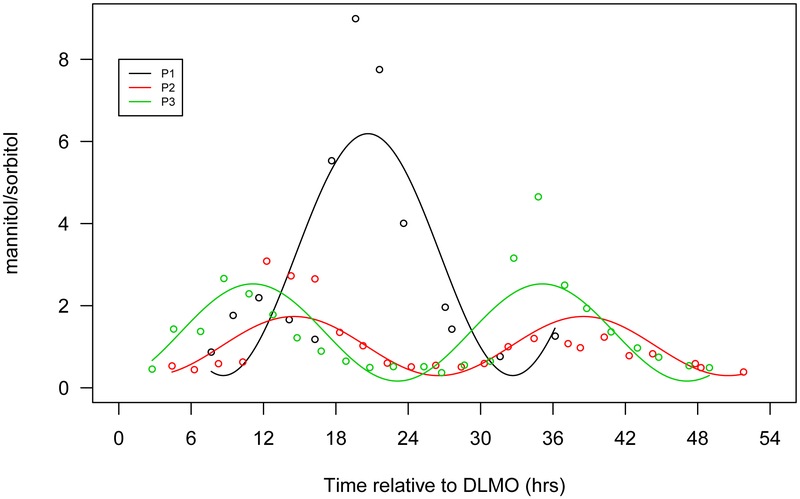
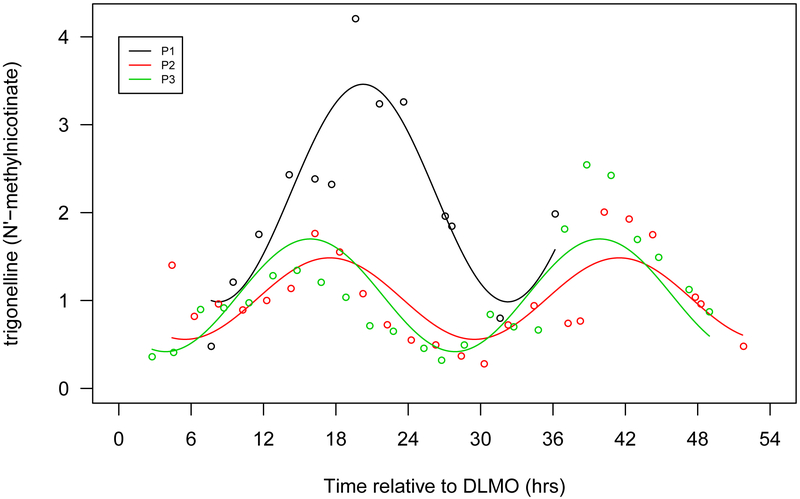
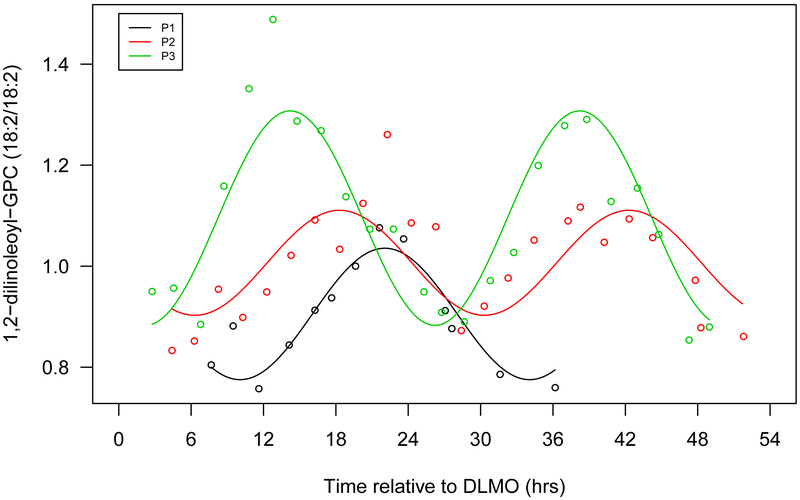
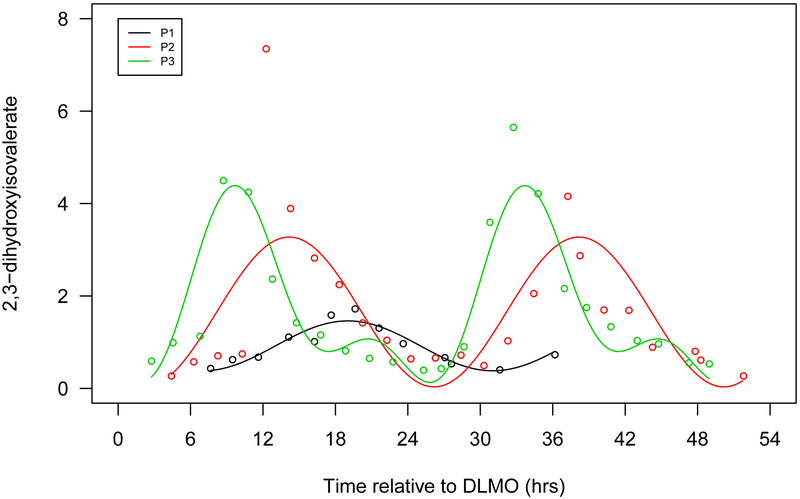
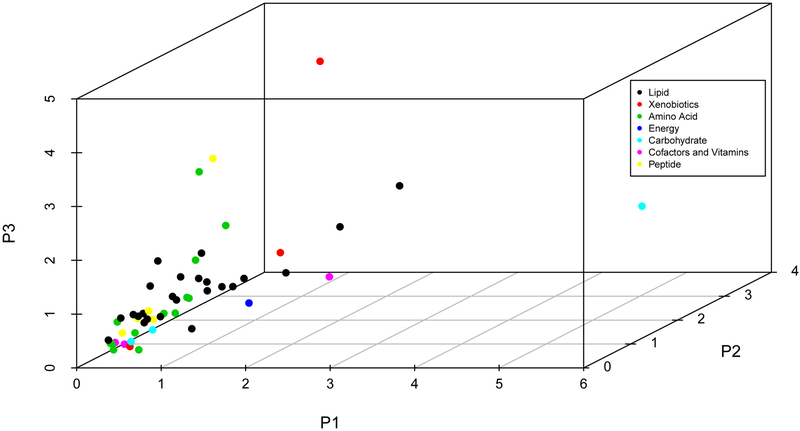
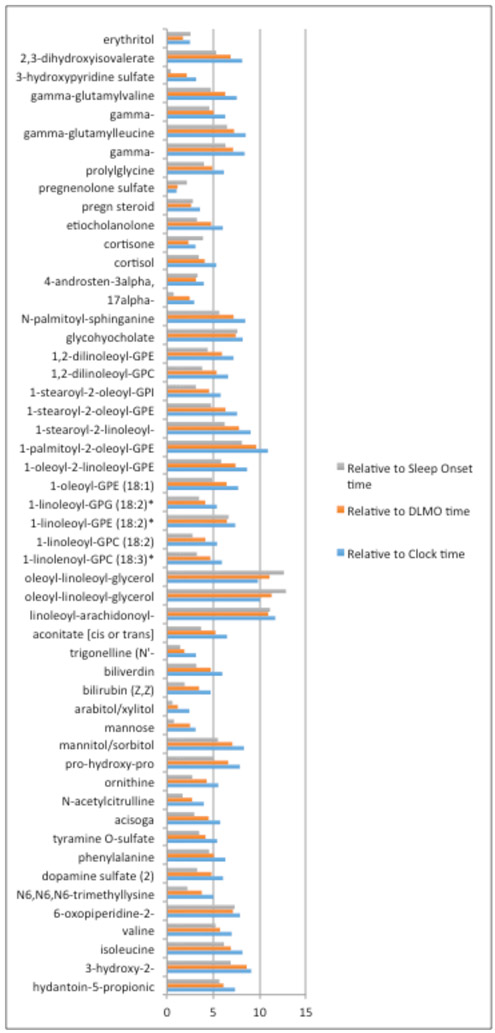
The circadian system influences virtually all biological functions. Understanding the impact of circadian variation on metabolism may provide insight into mechanisms of circadian-associated disorders and guide the implementation of chrono-therapy. Previous research has reported circadian variation in 7-20% of metabolites in human blood. In this study, untargeted metabolomics profiles were measured using blood of two healthy men and one healthy woman, collected every 2 h for up to 48 h under carefully controlled conditions. The pattern of variation of each metabolite over time was examined on each participant separately, using both one- and two-order harmonic models. A total of 100 of 663 metabolites, representing all metabolite categories, showed diurnal rhythmic concentrations that exceeded the Bonferroni threshold (P < 2.5 × 10⁻⁵). Overall, peak times of many metabolites were clustered during the afternoon-midnight, including the majority of amino acids, all peptides, all lysolipids and all phospholipids, whereas the majority of steroids peaked in the morning. We observed substantial inter-individual variation for both peak times and amplitudes in these three subjects. In conclusion, at least 15% of blood metabolites, representing a broad group of biological pathways, exhibit diurnal variation in three participants. The average peak times of most of these metabolites are clustered in morning or afternoon-midnight. Further work is needed to validate and extend this work in more individuals.

Keywords: Circadian rhythm; diurnal; metabolites; metabolomics.


Conflict of interest statement

Declaration of Interest Statement

The authors declare no conflicts of interest

Figures

Figure 1.
Figure 1.
Seven selected metabolites that showed diurnal rhythms in normalized concentration in all 3 participants. a. Cortisol, b. bilirubin (Z,Z), c. mannitol/sorbitol, d. dopamine sulphate (2), e. trigonelline (N'-methylnicotinate), f. 1,2-dilinoleoyl-GPC (18:2/18:2), g. 2,3-dihydroxyisovalerate. The x-axis is based on the scale of the DLMO time. The y-axis presents the normalized value of metabolite concentration.
Figure 1.
Figure 1.
Seven selected metabolites that showed diurnal rhythms in normalized concentration in all 3 participants. a. Cortisol, b. bilirubin (Z,Z), c. mannitol/sorbitol, d. dopamine sulphate (2), e. trigonelline (N'-methylnicotinate), f. 1,2-dilinoleoyl-GPC (18:2/18:2), g. 2,3-dihydroxyisovalerate. The x-axis is based on the scale of the DLMO time. The y-axis presents the normalized value of metabolite concentration.
Figure 2.
Figure 2.
Peak time (a) and amplitude (b) for 53 known metabolites that showed diurnal variation in all 3 participants, by chemical classification
Figure 2.
Figure 2.
Peak time (a) and amplitude (b) for 53 known metabolites that showed diurnal variation in all 3 participants, by chemical classification
Figure 3.
Figure 3.
Ranges of peak time among 3 participants based on scales of Clock time, DLMO time and Sleep onset time for the 53 known metabolites (Supplementary Table 2). Blue color represents the peak time range based on the clock time; orange color represents the peak time range based on the peak times relative to the DLMO time for each participant; the grey color represents the peak time range based on the peak times relative to the habitual sleep time for each participant.

References

    1. Alexander JW, Supp DM. (2014). Role of Arginine and Omega-3 Fatty Acids in Wound Healing and Infection. Advances in wound care. 3:682–690. - PMC - PubMed
    1. Ang JE, Revell V, Mann A, Mantele S, Otway DT, Johnston JD, Thumser AE, Skene DJ, Raynaud F. (2012). Identification of human plasma metabolites exhibiting time-of-day variation using an untargeted liquid chromatography-mass spectrometry metabolomic approach. Chronobiology international. 29:868–881. - PMC - PubMed
    1. Benloucif S, Burgess HJ, Klerman EB, Lewy AJ, Middleton B, Murphy PJ, Parry BL, Revell VL. (2008). Measuring melatonin in humans. Journal of clinical sleep medicine : JCSM : official publication of the American Academy of Sleep Medicine. 4:66–69. - PMC - PubMed
    1. Brzezinski A (1997). Melatonin in humans. The New England journal of medicine. 336:186–195. - PubMed
    1. Chua EC, Shui G, Lee IT, Lau P, Tan LC, Yeo SC, Lam BD, Bulchand S, Summers SA, Puvanendran K, Rozen SG, Wenk MR, Gooley JJ. (2013). Extensive diversity in circadian regulation of plasma lipids and evidence for different circadian metabolic phenotypes in humans. Proc Natl Acad Sci U S A. 110:14468–14473. - PMC - PubMed

Publication types