

Comparison of visual assessment and computer image analysis of intracoronary thrombus type by optical coherence tomography
- PMID: 30557331
- PMCID: PMC6296537
- DOI: 10.1371/journal.pone.0209110
Comparison of visual assessment and computer image analysis of intracoronary thrombus type by optical coherence tomography
Abstract
Background: Analysis of intracoronary thrombus type by optical coherence tomography (OCT) imaging is highly subjective. We aimed to compare a newly developed image analysis method to subjective visual classification of thrombus type identified by OCT.
Methods: Thirty patients with acute ST elevation myocardial infarction were included. Thrombus type visually classified by two independent readers was compared with analysis using QCU-CMS software.
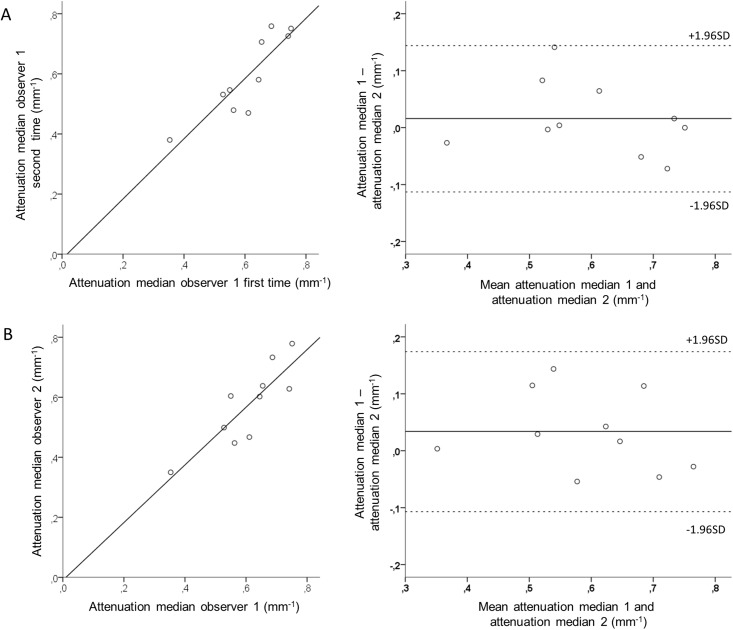
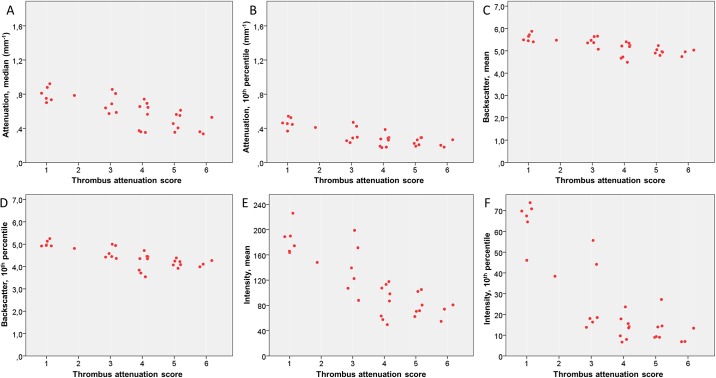
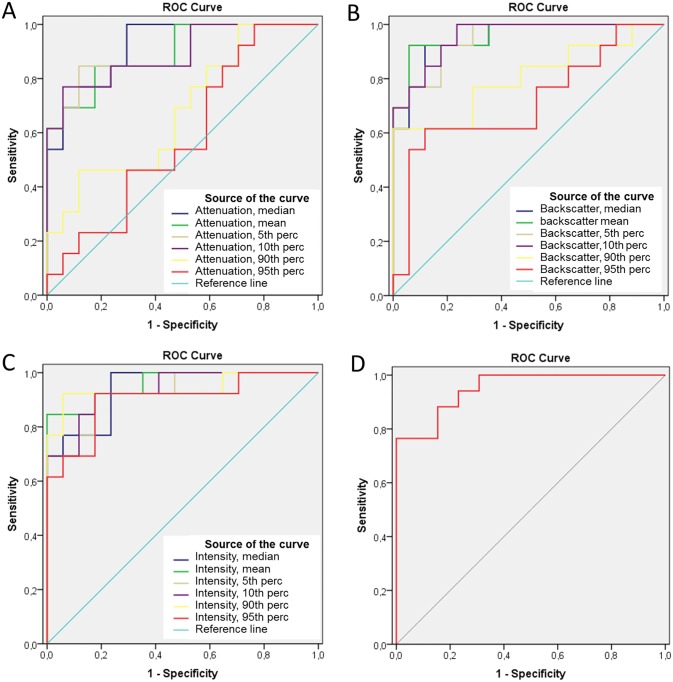
Results: Repeatability of the computer-based measurements was good. By using a ROC, area under curve values for discrimination of white and red thrombi were 0.92 (95% confidence intervals (CI) 0.83-1.00) for median attenuation, 0.96 (95% CI 0.89-1.00) for mean backscatter and 0.96 (95% CI 0.89-1.00) for mean grayscale intensity. Median attenuation of 0.57 mm-1 (sensitivity 100%, specificity 71%), mean backscatter of 5.35 (sensitivity 92%, specificity 94%) and mean grayscale intensity of 120.1 (sensitivity 85%, specificity 100%) were identified as the best cut-off values to differentiate between red and white thrombi.
Conclusions: Attenuation, backscatter and grayscale intensity of thrombi in OCT images differentiated red and white thrombi with high sensitivity and specificity. Measurement of these continuous parameters can be used as a less user-dependent method to characterize in vivo thrombi. The clinical significance of these findings needs to be tested in further studies.
Conflict of interest statement
The authors have declared that no competing interests exist.
Figures
References
-
- Prati F, Regar E, Mintz GS, Arbustini E, Di Mario C, Jang IK, et al. Expert review document on methodology, terminology, and clinical applications of optical coherence tomography: physical principles, methodology of image acquisition, and clinical application for assessment of coronary arteries and atherosclerosis. Eur Heart J. 2010;31:401–15. 10.1093/eurheartj/ehp433 - DOI - PubMed
-
- Tearney GJ, Regar E, Akasaka T, Adriaenssens T, Barlis P, Bezerra HG, et al. Consensus standards for acquisition, measurement, and reporting of intravascular optical coherence tomography studies: a report from the International Working Group for Intravascular Optical Coherence Tomography Standardization and Validation. J Am Coll Cardiol. 2012;59:1058–72. 10.1016/j.jacc.2011.09.079 - DOI - PubMed
-
- Kume T, Akasaka T, Kawamoto T, Ogasawara Y, Watanabe N, Toyota E, et al. Assessment of coronary arterial thrombus by optical coherence tomography. Am J Cardiol. 2006;97:1713–7. 10.1016/j.amjcard.2006.01.031 - DOI - PubMed
-
- Jolly SS, Cairns J, Yusuf S, Meeks B, Shestakovska O, Thabane L, et al. Design and rationale of the TOTAL trial: A randomized trial of routine aspiration ThrOmbecTomy with percutaneous coronary intervention (PCI) versus PCI ALone in patients with ST-elevation myocardial infarction undergoing primary PCI. Am Heart J. 2014;167:315–321.e1. 10.1016/j.ahj.2013.12.002 - DOI - PubMed
-
- Jolly SS, Cairns JA, Yusuf S, Meeks B, Pogue J, Rokoss MJ, et al. Randomized trial of primary PCI with or without routine manual thrombectomy. N Engl J Med. 2015;372:1389–98. 10.1056/NEJMoa1415098 - DOI - PMC - PubMed
Publication types
MeSH terms
LinkOut - more resources
Full Text Sources
