. 2018 Dec 17;14(12):e1007441.
doi: 10.1371/journal.ppat.1007441. eCollection 2018 Dec.

Quantitative RNAseq analysis of Ugandan KS tumors reveals KSHV gene expression dominated by transcription from the LTd downstream latency promoter

Affiliations

Quantitative RNAseq analysis of Ugandan KS tumors reveals KSHV gene expression dominated by transcription from the LTd downstream latency promoter

Timothy M Rose et al. PLoS Pathog. .

Abstract

KSHV is endemic in Uganda and the HIV epidemic has dramatically increased the incidence of Kaposi sarcoma (KS). To investigate the role of KSHV in the development of KS, we obtained KS biopsies from ART-naïve, HIV-positive individuals in Uganda and analyzed the tumors using RNAseq to globally characterize the KSHV transcriptome. Phylogenetic analysis of ORF75 sequences from 23 tumors revealed 6 distinct genetic clusters with KSHV strains exhibiting M, N or P alleles. RNA reads mapping to specific unique coding sequence (UCDS) features were quantitated using a gene feature file previously developed to globally analyze and quantitate KSHV transcription in infected endothelial cells. A pattern of high level expression was detected in the KSHV latency region that was common to all KS tumors. The clear majority of transcription was derived from the downstream latency transcript promoter P3(LTd) flanking ORF72, with little evidence of transcription from the P1(LTc) latency promoter, which is constitutive in KSHV-infected lymphomas and tissue-culture cells. RNAseq data provided evidence of alternate P3(LTd) transcript editing, splicing and termination resulting in multiple gene products, with 90% of the P3(LTd) transcripts spliced to release the intronic source of the microRNAs K1-9 and 11. The spliced transcripts encode a regulatory uORF upstream of Kaposin A with alterations in intervening repeat sequences yielding novel or deleted Kaposin B/C-like sequences. Hierarchical clustering and PCA analysis of KSHV transcripts revealed three clusters of tumors with different latent and lytic gene expression profiles. Paradoxically, tumors with a latent phenotype had high levels of total KSHV transcription, while tumors with a lytic phenotype had low levels of total KSHV transcription. Morphologically distinct KS tumors from the same individual showed similar KSHV gene expression profiles suggesting that the tumor microenvironment and host response play important roles in the activation level of KSHV within the infected tumor cells.


Conflict of interest statement

The authors have declared that no competing interests exist.

Figures

Fig 1
Fig 1. Comparison of reads mapping to the KSHV genome in the RNAseq libraries from different Ugandan KS tumor biopsies.
A) RNA reads from the RNAseq libraries prepared from 41 KS biopsies (S1 Table) were initially mapped to the human genome (hg19) using TopHat2. The set of reads not matching with the human genome were further mapped to the KSHV reference sequence NC_009333 for the KSHV GK18 strain and the reads from the different KS biopsies were compared. B) The RNA read data were grouped according to the tumor morphology classification.
Fig 2
Fig 2. KSHV transcriptome analysis in Ugandan KS tumor biopsies—Linear scale.
RNA-seq analysis was performed on 41 KS tumor biopsies and the RNA reads were aligned to the complete reference genomic sequence of KSHV, strain GK18, (NC_009333) and visualized using IGV from the left to the right end of the genome. The vertical axis represents the number of reads aligned to each nucleotide position of the KSHV reference genome (autoscaled) and the visible axis range is shown on the left. Data from 13 representative biopsies from 12 patients are shown in ascending order based on total KSHV mapped read levels. The positions of various KSHV genes across the KSHV genome are indicated at the top and highly expressed genes are indicated at the bottom. An asterisk in the bottom panel indicates the position of a highly expressed region of the KSHV genome flanking the ORF72 coding sequence (P3-exon1). Two different KS biopsies from the same individual (008) are shown. KS biopsy 008_C shows a transcript pattern that is similar to the other KS biopsies, while biopsy 008_B shows high level expression of a region of the left end of the KSHV genome flanking the region encoding PAN (brackets). As discussed in the text, the KSHV strain in KS biopsy 030_C contains the M-allele of K15 and no reads mapped to the P-allele of K15 present in the GK18 reference sequence used for mapping (B: 030_C lane, arrow).
Fig 3
Fig 3. KSHV transcriptome analysis in Ugandan KS tumor biopsies—Log scale.
RNA-seq analysis using a linear scale described in Fig 2 was also performed using a log scale to visualize the complete range of mapped reads. See legend to Fig 2.
Fig 4
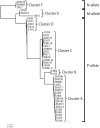
Fig 4. Phylogenetic analysis of the KSHV ORF75 sequences in 23 Ugandan KS tumor biopsies.
The complete 3891 bp sequences of the KSHV ORF75 from the KSHV strains in 23 Ugandan KS tumor samples were assembled from overlapping 50 bp RNA reads and compared to the published ORF75 sequences of KSHV strains from 14 Zambian KS biopsies: ZM004 (KT271453), ZM027 (KT271454), ZM091 (KT271455), ZM095 (KT271456), ZM102 (KT271457), ZM106 (KT271458), ZM108 (KT271459), ZM114 (KT271460), ZM116 (KT271461), ZM117 (KT271462), ZM118 (KT271463), ZM121 (KT271464), ZM123 (KT271465), ZM124 (KT271466), ZM128 (KT271467), and ZM130 (KT271468). In addition, ORF75 sequences from the KSHV reference sequence strain GK18 from an HIV-negative individual with classical KS (NC_009333), the strain JSC1 from an HIV infected male with a lymphomatous peritoneal effusion (GQ994935), the strain DG1 from HIV infected Caucasian male with KS (JQ619843) and the strain BC-1 from a primary effusion lymphoma (U75698) are compared. The sequences were aligned using ClustalX and the phylogenetic relationship was determined by maximum likelihood. Separate clusters of sequences (A-F) were identified. Sequences associated with the M-, N-, and P-alleles of the adjacent K15 subtypes are shown. KS tumors 008_B and 008_C were obtained from the same patient. The scale of divergence is indicated.
Fig 5
Fig 5. Quantitation of RNA reads mapping to the KSHV latency region.
RNA reads from 34 Ugandan KS tumor biopsies were mapped to the KSHV genomic region from ORF69 to K15 using TopHat2. A) Representative spliced transcript patterns (Sashimi plots) for four KS tumors are shown for genes in the latency locus. The vertical axis represents the number of reads aligned to each nucleotide position of the KSHV reference genome (autoscaled for the height of reads mapping to the 5’exon downstream of promoter P3(LTd), described in the text; the visible axis range is shown on the left). The total number of reads mapping to the KSHV genome is indicated at the right. The number and position of split reads detected by TopHat2 indicating donor and acceptor sites for spliced transcripts are shown and the corresponding excised intron region is labeled. The positions of poly-A sites of transcript termination are shown: ORF69 (bp 117,509); T0.7 and related Group A transcripts (bp 117,553); ORF71 and related Group B transcripts (bp 122,342); ORF72 monocistronic Group C transcript (bp 123,015), as described in the text. B) The proposed transcription pattern for the latency locus is shown (black = sense strand; red = antisense strand). The proposed non-coding antisense ALT RNA and the positions of the direct repeats DR5, 6 and 7, the long inverted indirect repeat (LIR2) and the microRNA region (miRs) are indicated. The positions of the promoters for the latency transcripts are shown: P1 (LTc; bp 128,089), P2 (LTi; bp 127,789), P3 (LTd; bp 124,131), P4 (~bp 119,035), and P5 (~bp 118,234) promoters and the known latency transcripts are graphically represented. Coding sequences are boxed, adjacent 5’ and 3’ regions are thick lines and introns (a-f) are indicated as thin dotted lines (intron a: bp 123,842…119,048; intron b: bp 127,961…124025; intron c: bp 127,961…119,048; intron d: bp 123,842…123,108; intron e: bp 127,961…127,463; intron f: bp 127,961…127,619). The transcripts terminating at the poly-A site downstream of the Kaposin coding sequence (panel A; bp 117553) are grouped together (Group A), while those terminating at the poly-A site downstream of ORF71 (panel A; bp 122342) are grouped together (Group B). The monocistronic ORF72 Group C transcript terminates at the poly-A site bp 123,015. The major T1.7A spliced transcript in Group A encoding the K12 A/B/C complex is indicated with a double asterisk, while the major T1.7B bicistronic transcript in Group B encoding ORF71/72 is shown with a single asterisk. The first exon (P3-Exon1) in the transcripts derived from promoter P3(LTd) is indicated. The sizes of the transcripts are derived from the GK18 strain (NC_009333 reference sequence) (see S2 Table). The DR5, DR6 and DR7 repeat regions contain different numbers of repeats in different KSHV strains, yielding variation in lengths of the Group A and B transcripts [44]. C) The non-overlapping UCDS features for quantitating transcripts are shown. UCDS features for ORFs 69, 71, 72 and K14 correspond to the coding sequences for these ORFs. The K12A UCDS feature corresponds to the T0.7 transcript, while the K12Aa UCDS feature corresponds to the P3-Exon1 downstream of the P3 (LTd) promoter (bp 124,054‥123,843). The miR UCDS feature identifies reads from unspliced mRNAs, such as the 6.4Kb transcript, which map to the genomic region containing the right long inverted repeat (LIR2) encoding the microRNAs K1-9. The miR UCDS feature does not detect processed miRNAs, as these RNAs are not polyadenylated and thus are not present in the sequenced RNA-seq library. The ORF73a and ORF73b UCDS features target the non-repetitive regions of the ORF73 transcript, and reads are combined for quantitation. The DR6 UCDS feature targets an extremely GC-rich repetitive region. D) mRNA reads mapping to the latency region extending from the flanking ORF69 to the terminal K15 were quantitated for 34 KS tumors using the UCDS features and normalized (TPM), and the median and interquartile range was plotted using an R-based BoxPlot algorithm, see Materials and methods. The reads mapping to the K12Aa, DR6, DR5 and K12A UCDS features are boxed in red to indicate their relationship within the T1.7A spliced transcript, while the reads mapping to the ORF71/ORF72 and ORF75/K15 are boxed in blue and purple, respectively, to indicate their relationship within bicistronic transcripts T1.7B (single asterisk, Panel B) and T6.3, respectively.
Fig 6
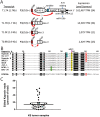
Fig 6. Sequence variants of the latency region transcripts.
The structure of the KSHV genome across the latency region is shown in the direction of transcription, with the positions of the encoded major ORFs, small upstream ORF (uORF), microRNAs (miRNA), and direct repeats (DR) indicated. The positions of the known promoters and the regions of sequence variability in the repeat regions are also shown. The proposed spliced T1.7A transcripts from the P3 (LTd) promoter and non-spliced transcripts T1.5A and T0.7A from the P4 and P5 promoters, respectively, are shown. The AUG initiating codon for the upstream “MGA” encoding uORF sequence and the CUG initiating codons for the two different downstream repeat open reading frames “LAH” and “LQY” are indicated, as is ORFK12 encoding Kaposin A. A) Putative translation products from the GK18 reference strain are shown: Kaposin D containing the repeat sequence initiating with “LQY” that lacks the Kaposin A sequence and Kaposin E containing the repeat sequence initiating with “LAH” that is fused in tandem with Kaposin A. B) The previously described translation products from the BCBL-1 cell line are shown: Kaposin A alone, Kaposin B containing the repeat sequence initiating with “LAH” (major gene product) and Kaposin C containing the repeat sequence initiating with “LQY” fused in tandem with Kaposin A (minor gene product)[44]. The BCBL-1 genome contains a 2 bp deletion between the DR5 and DR6 repeat regions compared to GK18 (red dotted line). C, D) Putative translation products from the Zambian KSHV strains, ZM114 and ZM004, are shown, which contain 1 bp deletions upstream of the “CUG” initiation region and 1 bp deletions between the DR5 repeat and the ORFK12 coding sequence (red dotted lines). D) Putative translation products from the Zambian KSHV strain, ZM004 are shown, which contains additional nucleotide changes eliminating the “LAH” and “LQY” ORFs, as described in the text. The Ugandan KS tumors with the same sequence changes as ZM114 and ZM004 are indicated.
Fig 7
Fig 7. Analysis of highly expressed transcripts from the P3(LTd) latency promoter.
A) A diagram of the coding potential of the spliced and unspliced transcripts derived from the P3(LTd) latency promoter is shown. The presence of a regulatory uORF, introns and coding ORFs are shown. The regulatory uORF has been shown to downregulate ORF72 expression in the ORF71/72 bicistronic transcript, as discussed in the text, and is predicted to downregulate KapB/C in T1.7A and vFLIP in T0.9B. The variable region upstream of the Kaposin B/C (KapB/C) coding sequence and the position of RNA editing affecting the coding sequence of the Kaposin A (KapA) and miR-K10a seed sequence are indicated, as are the median expression levels for the different transcripts in the KS tumor samples. B) Alignment of the Kaposin A variants. Published sequences: (UG-107: ACZ92060; ZM123: KT271465; GK18: NC_009333; BAC-36: HQ404500; Retroperitoneal fibromatosis herpesvirus Macaca nemestrina (RFHVMn): AGY30757); Sequences this study: (Uganda A group: 003, 007, 009, 010, 013, 022, 024, 030, 032, 037, 099, 101; Uganda B group: 001, 004, 006, 008, 011, 012, 014, 015, 018, 020, 023, 026, 028, 029, 034, 088; BCBL-1). Additional unique variations from the Uganda group A and B sequences included: Q14-P14 (011), W20-G20 (023), P40-A40 (034) and unknown sequence variation (no mapped reads) after R54 (006). C) The percent of reads containing the edited base at position 118,096 of NC_009333, resulting in the change from miR-K10a to miR-K10b (panel A) and the change from Ser39 to Gly in Kaposin A (panel B) is shown for all 34 KS tumor samples, with median and interquartile range. Edited reads: median = 6.5, IQR = 0–89; Total reads: median = 79, IQR = 5–161.
Fig 8
Fig 8. High level expression of a genomic fragment flanking LIR1, which was translocated into the latency region within LIR2 in KS tumor 008_B.
A) Structure of the KSHV genome in KS tumor 008_C showing the position of a genomic fragment (ORFK3 to ORF19; green) that was translocated into the long-inverted repeat (LIR2) within the latency region in the KS tumor 008_B isolated from the same individual. B) Proposed structure of the KSHV genome in KS tumor 008_B with the ORFK3-ORF19 translocation. While the exact junction of the ORFK3-ORF19 translocated fragment was determined from the sequence of RNA reads mapping across the junction in LIR2, the junction of the genomic sequence across the excision point between ORFs K2 and 20 was not determined due to the absence of RNA reads in this region. C) Sashimi plot showing RNA read levels of genes between ORFs K12 and 72 mapping to a model genome of the KSHV reference sequence NC_009333 containing the proposed translocation. (Vertical axis: Range of RNA reads 0–1000). The position and quantity of split reads detected by TopHat2, indicative of transcript splicing, as discussed in Fig 5, is shown. D) Proposed position and orientation of genes translocated into LIR2 in the 008_B KSHV genome is indicated. The 3’ end of ORF-K3 (K3tr) and the 5’ end of ORF19 (19tr) are truncated at the LIR2 insertion point. The positions of the highly expressed P3(LTd) latency promoter and the initial 5’ exon (P3exon1), described in Fig 5, are indicated. E) Proposed transcripts derived from the P3 promoter with novel splicing patterns are shown. The highly expressed T1.7A and T1.7B transcripts detected in all the KS tumors, as indicated in Fig 5, are boxed. The numbers of reads split across each intron are shown in parentheses, and the transcript levels quantitated using specific UCDS features are indicated as transcripts per million (TPM) KSHV reads.
Fig 9
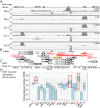
Fig 9. Analysis of the expression of PAN and flanking genes at the left end of the KSHV genome.
A) The IGV view of reads mapping to spliced and non-spliced transcripts across the region encoding PAN and flanking genes is shown for 5 representative KS tumor samples. Tumors 008_B and 008_C were obtained from the same individual. The position and depth of mapped reads (linear scale) are shown in line (1) with the range indicated at the far right. The position of split reads mapping to splice junctions is indicated in line (2), where the height and thickness of the arc are proportional to the read depth up to 50 reads. The labeled introns are indicated on the transcript map compiled from published literature and predicted transcripts in (B). ORFs on the sense strand are shown in red, while ORFs on the complementary strand are shown in black. C) Position of UCDS features used for read quantitation. D) Total reads mapping to the UCDS features from 33 KS tumors (without 008_B) were quantitated and normalized (TPM). ORFs with high consistent levels of expression are indicated and boxed in red.
Fig 10
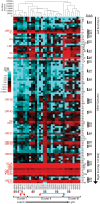
Fig 10. Hierarchical clustering of KSHV transcripts—“Equal width” binning.
Hierarchical clustering using CIMminer was applied to KSHV gene expression data obtained by mapping RNA reads to UCDS gene features from 34 KS tumors with total KSHV-mapped reads greater than 1,000. Reads mapping to each UCDS feature were quantitated, normalized (TPM) and the expression values were color-coded for display in the cluster maps using the “equal width” binning method, as described in the text. The unsupervised clustering is shown at the top and the different KS tumor samples are indicated at the bottom of the map. The UCDS features are listed at the right side in the linear order of the KSHV genome from left (top) to right (bottom).
Fig 11
Fig 11. Hierarchical clustering of KSHV transcripts—“Quantile” binning.
The hierarchical clustering of KSHV gene expression using CIMminer shown in Fig 10 was also performed using the “quantile” binning method, as described in the text. The position of poly-A transcription termination sites for polycistronic ORFS and the direction of transcription is indicated. The pairs of tumor biopsies from the same individual are shown at the bottom (red dot—macular tumor; blue dot—nodular tumor). The 008_B tumor sample with the unusual genomic rearrangement is indicated with a (*). The gradient of latent to lytic gene expression observed in these tumors is shown at the bottom.
Fig 12
Fig 12. PCA analysis of normalized KSHV gene expression.
A) the normalized KSHV transcript levels from the 34 KS tumors analyzed in Fig 11 were analyzed by principal component analysis (PCA). The individual KS tumor samples are color coded for morphological type. The gene expression clusters identified in Fig 11 are shown (Group I-blue text and outline; Group II-black text and outline; Group III-orange text and outline). Two tumors 10B and 88C fall outside the PCA clusters, as indicated. The paired KS tumors from the same individual are shown with a black dashed line. B) the RNA reads mapping to the PAN and K12A UCDS features targeting transcripts containing PAN and the K12 Kaposin latency region transcripts, respectively, were normalized to the length of the UCDS feature, expressed as reads per kilobase (RPK), and the ratio of PAN to K12A was plotted for the 34 KS tumors with greater than 1,000 total KSHV-mapped reads (circular dots) and 7 KS tumors with KSHV-mapped reads less than 1,000 (triangles). C) the total KSHV-mapped reads detected in the RNAseq libraries were normalized (KSHV-mapped reads/100 million total reads) and compared between the KS tumors in the gene expression clusters identified in Fig 11: (34 KS tumors, reads > 1,000; circular dots) and the 7 KS tumors with less than 1,000 mapped reads (triangles), which were grouped within the lytic Cluster III due to the high PAN/K12A ratio identified in Panel B. The morphological types are color coded: red-fungating, green-macular, blue-nodular. The median and interquartile range are shown and the gradient from latent to lytic gene expression determined from Fig 11 is indicated. Significance was determined using the unpaired T-test. The 023_B KS sample contained a very high level of KSHV-mapped reads, and due to the unusual fungating morphology of this tumor, the data was plotted (in parenthesis) but not included in the statistical calculations.
Fig 13
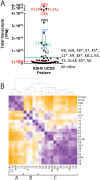
Fig 13. Analysis of the highly expressed genes in the KS tumors.
A) The median expression levels of the most highly expressed KSHV genes were compared, with each dot representing the normalized transcript level (TPM) detected by each KSHV UCDS feature. Genes with transcript levels above 5,000 TPM (blue line) are specifically indicated. Genes with transcript levels between 1,000 (red line) and 5,000 TPM are listed together. Genes with transcript levels below 1,000 are grouped as “all other”. Clusters of UCDS features detecting common transcripts are indicated: Red—major T1.7A transcript in the latency region; Blue—K15/ORF75 bicistronic transcript; Green—ORF71/72 bicistronic transcript. An asterisk marks the genes proximal to poly-A sites. B) hierarchical clustering of gene-gene expression correlations for those genes with median transcript levels above 1,000 TPM. Pearson correlation coefficients (R) were calculated for pairs of genes using normalized transcript levels. The negative correlation (R = -1.0) is shown in orange and the positive correlation (R = 1.0) in purple, with the absence of correlation (R = 0) in white. The unsupervised hierarchical clustering is indicated at the top and the major clusters of genes (A-C) are indicated.

Similar articles

Cited by

References

    1. Mariggio G, Koch S, Schulz TF. Kaposi sarcoma herpesvirus pathogenesis. Philosophical transactions of the Royal Society of London Series B, Biological sciences. 2017;372(1732). 10.1098/rstb.2016.0275 - DOI - PMC - PubMed
    1. Russo JJ, Bohenzky RA, Chien MC, Chen J, Yan M, Maddalena D, et al. Nucleotide sequence of the Kaposi sarcoma-associated herpesvirus (HHV8). Proc Natl Acad Sci U S A. 1996;93(25):14862–7. - PMC - PubMed
    1. Nicholas J, Zong JC, Alcendor DJ, Ciufo DM, Poole LJ, Sarisky RT, et al. Novel organizational features, captured cellular genes, and strain variability within the genome of KSHV/HHV8. J Natl Cancer Inst Monogr. 1998;(23):79–88. - PubMed
    1. Bechtel JT, Liang Y, Hvidding J, Ganem D. Host range of Kaposi’s sarcoma-associated herpesvirus in cultured cells. J Virol. 2003;77(11):6474–81. 10.1128/JVI.77.11.6474-6481.2003 . - DOI - PMC - PubMed
    1. Kedes DH, Lagunoff M, Renne R, Ganem D. Identification of the gene encoding the major latency-associated nuclear antigen of the Kaposi’s sarcoma-associated herpesvirus. The Journal of clinical investigation. 1997;100(10):2606–10. 10.1172/JCI119804 - DOI - PMC - PubMed

Publication types

MeSH terms