. 2018 Dec 14;23(12):3319.
doi: 10.3390/molecules23123319.

Schisandra Chinensis Lignans Suppresses the Production of Inflammatory Mediators Regulated by NF-κB, AP-1, and IRF3 in Lipopolysaccharide-Stimulated RAW264.7 Cells

Affiliations

Schisandra Chinensis Lignans Suppresses the Production of Inflammatory Mediators Regulated by NF-κB, AP-1, and IRF3 in Lipopolysaccharide-Stimulated RAW264.7 Cells

Gan Luo et al. Molecules. .

Abstract

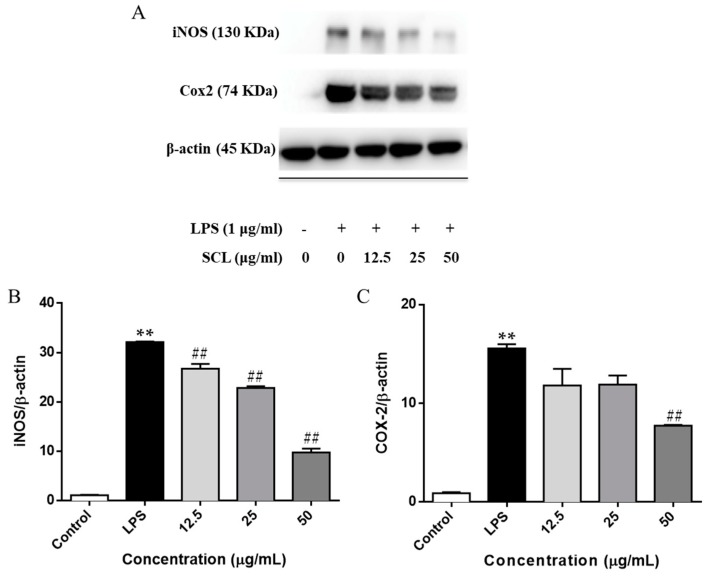
Schisandra Fructus (SF) is a traditional Chinese herb used in the treatment of inflammatory disorders like hepatitis. One of the main anti-inflammatory components of SF is the lignans. However, the underlying anti-inflammatory mechanism of Schisandra Chinensis lignans (SCL) remains unclear. This study aims to investigate the effects of SCL on inflammatory mediators in lipopolysaccharide-stimulated RAW264.7 cells and explore the underlying mechanism. The production of nitric oxide (NO) was determined by Griess reaction. ELISA was used to determine cytokine levels and chemokines secretion. To estimate protein levels and enzyme activities, we employed Western blotting. Nuclear localization of NF-κB, AP-1, and IRF3 was detected using immunofluorescence analyses. The results showed that SCL significantly reduced the release of inflammatory mediators, including NO and PGE2, which may be related to down-regulation of iNOS and COX-2 expression. The production of cytokines and chemokines was suppressed by SCL treatment. SCL also decreased the phosphorylation of IKKα/β, IκB-α, Akt, TBK1, ERK, p38, JNK, NF-κB (p65), AP-1 (c-Jun), and IRF3 in RAW264.7 macrophages activated with LPS. The nuclear protein levels and nuclear translocation of AP-1, NF-κB and IRF3 were suppressed by SCL. These results indicated that SCL suppressed the IKKα/β/NF-κB, MAPKs/AP-1 and TBK1/IRF3 signaling pathways in LPS-stimulated RAW264.7 macrophages.

Keywords: AP-1; IRF3; NF-κB; RAW264.7 macrophages; Schisandra Chinensis lignans; anti-inflammation.


Conflict of interest statement

The authors declare that they have no competing interests.

Figures

Figure 1
Figure 1
Characterization of SCL. High performance liquid chromatography chromatograms of the SCL and standards (Schisandrin, Schisandrol B, Schisantherin A, Schisandrin A, Schisandrin B and Schisandrin C) were detected at 220 nm.
Figure 2
Figure 2
Effect of SCL on NO and PGE2 production in LPS-stimulated RAW264.7 cells. Cells were treated with SCL at various concentrations (3.125, 6.25, 12.5, 25 and 50 μg/mL) for 1 h, and then stimulated with or without LPS for 24 h, cell viability was analysed with an MTT method. (A). The cells were incubated with indicated concentrations of SCL for 1 h, and then stimulated with LPS for 24 h. The concentration of NO (expressed as nitrite) and PGE2 in the culture medium were quantified by Griess reaction and ELISA, respectively (B,C). The data presented in bar charts are mean ± standard error of the mean (SEM) values from 4 independent experiments. ** p < 0.01 vs. unstimulated cells. ## p < 0.01 vs. LPS-stimulated cells.
Figure 3
Figure 3
Effect of SCL on iNOS and COX-2 expression in LPS-stimulated RAW264.7 cells. Cells were treated with SCL at various concentrations (12.5, 25 and 50 μg/mL) for 1 h, and then stimulated with or without LPS for 24 h, the expression of iNOS and COX-2 were investigated by Western blotting. (A). The data presented in bar charts indicates the relative levels of iNOS and COX-2 (B,C). Values given are the mean ± SEM of 3 independent experiments; ** p < 0.01 vs. unstimulated cells. ## p < 0.01 vs. LPS-stimulated cells.
Figure 4
Figure 4
Effect of SCL on the production of cytokines and chemokines in LPS-stimulated RAW264.7 cells. The cells were plated in 24-wells and incubate for 12 h, and then the macrophages were pre-treated with different concentrations of SCL for 1 h and then stimulated with or without LPS (1 μg/mL) for 24 h. IL-1β (A), IL-6 (B), TNF-α (C), MCP-1 (D), Rantes (E), and MIP-1α (F) concentrations in the cell culture medium were measured by ELISA. Values given are the mean ± SEM of 4 independent experiments; ** p < 0.01 vs. unstimulated cells. # p < 0.05, ## p < 0.01 vs. LPS-stimulated cells using a one-way ANOVA followed by Dunnett’s multiple comparisons test.
Figure 5
Figure 5
SCL affects the components of IKKα/β/NF-κB, MAPKs/AP-1 and TBK1/IRF3 pathways in LPS-stimulated RAW264.7 cells. Cells were treated with SCL at the indicated concentrations for 1 h and then stimulated with LPS for 30 min or 60 min. Total and phosphorylated forms of corresponding proteins were detected by Western blotting (A,B).
Figure 6
Figure 6
Effect of SCL on the components of IKKα/β/NF-κB, MAPKs/AP-1 and TBK1/IRF3 pathways in LPS-stimulated RAW264.7 cells. The data presented in bar charts indicates the ratio of p-IKKα/β/IKKα/β, p-IκBα/IκBα, p-TBK1/TBK1, p-p38/p38, p-ERK/ERK (44 KDa), p-ERK/ERK (42 KDa), p-JNK/JNK (54 KDa), p-JNK/JNK (46 KDa), p-p65/p65, p-c-Jun/c-Jun, p-IRF3/IRF3, and p-Akt/Akt in RAW264.7 cells. Values given are the mean ± SEM of 3 independent experiments; * p < 0.05, ** p < 0.01 vs. unstimulated cells. # p < 0.05, ## p < 0.01 vs. LPS-stimulated cells using a one-way ANOVA followed by Dunnett’s multiple comparisons test.
Figure 7
Figure 7
Effect of SCL on the nuclear and cytoplasmic protein levels of NF-κB, AP-1 and IRF3 in LPS-stimulated RAW264.7 cells. Cells were pre-treated with SCL in different concentrations as indicated for 1 h and then stimulated with LPS for 60 min. The cytoplasmic and nuclear protein levels of NF-κB (p65), AP-1 (c-Jun), and IRF3 were determined by Western blotting (A). Bar graphs show the relative levels of cytoplasmic and nuclear p65, IRF3, and c-Jun (B). Values given are the mean ± SEM of 3 independent experiments. ** p < 0.01 vs. unstimulated cells. # p < 0.05, ## p <0.01 vs. LPS-stimulated cells using a one-way ANOVA followed by Dunnett’s multiple comparisons test.
Figure 8
Figure 8
Effect of SCL on the nuclear translocation of NF-κB, AP-1 and IRF3 in LPS-stimulated RAW264.7 cells. Cells were pre-treated with SCL in different concentrations as indicated for 1 h and then stimulated with LPS for 60 min. The subcellular localization of NF-κB (p65), AP-1 (c-Jun), and IRF3 was determined using an immunofluorescence assay (AC). The images of these three transcriptional factors were acquired by confocal microscope. The bar in each image represents 33 μm.
Figure 9
Figure 9
Proposed molecular mechanisms underlying the inhibitory effects of SCL on the production of inflammatory mediators. SCL inhibits IKKα/β/NF-κB, MAPKs/AP-1 and TBK1/IRF3 pathways in LPS-stimulated RAW264.7 cells.

Similar articles

Cited by

References

    1. Medzhitov R. Inflammation 2010: new adventures of an old flame. Cell. 2010;140:771–776. doi: 10.1016/j.cell.2010.03.006. - DOI - PubMed
    1. Choy E.H., Panayi G.S. Cytokine pathways and joint inflammation in rheumatoid arthritis. N. Engl. J. Med. 2001;344:907–916. doi: 10.1056/NEJM200103223441207. - DOI - PubMed
    1. Montón C., Torres A. Lung inflammatory response in pneumonia. Monaldi Arch. Chest Dis. 1998;53:56–63. - PubMed
    1. Jenna R.M., Clare M.L. Chronic inflammation and asthma. Mutat. Res. 2010;690:24–39. - PMC - PubMed
    1. Liu X., Lin Y.J., Cheng Y. Complementary and alternative therapies for inflammatory diseases. Evid. Based Complement. Altern. Med. 2016;2016:8324815. doi: 10.1155/2016/8324815. - DOI - PMC - PubMed