. 2018 Dec 14;8(4):175.
doi: 10.3390/biom8040175.

Study of New Therapeutic Strategies to Combat Breast Cancer Using Drug Combinations

Affiliations

Study of New Therapeutic Strategies to Combat Breast Cancer Using Drug Combinations

Ana Correia et al. Biomolecules. .

Abstract

Cancer is a disease that affects and kills millions of people worldwide. Breast cancer, especially, has a high incidence and mortality, and is challenging to treat. Due to its high impact on the health sector, oncological therapy is the subject of an intense and very expensive research. To improve this therapy and reduce its costs, strategies such as drug repurposing and drug combinations have been extensively studied. Drug repurposing means giving new usefulness to drugs which are approved for the therapy of various diseases, but, in this case, are not approved for cancer therapy. On the other hand, the purpose of combining drugs is that the response that is obtained is more advantageous than the response obtained by the single drugs. Using drugs with potential to be repurposed, combined with 5-fluorouracil, the aim of this project was to investigate whether this combination led to therapeutic benefits, comparing with the isolated drugs. We started with a screening of the most promising drugs, with verapamil and itraconazole being chosen. Several cellular viability studies, cell death and proliferation studies, mainly in MCF-7 cells (Michigan Cancer Foundation-7, human breast adenocarcinoma cells) were performed. Studies were also carried out to understand the effect of the drugs at the level of possible therapeutic resistance, evaluating the epithelial-mesenchymal transition. Combining all the results, the conclusion is that the combination of verapamil and itraconazole with 5-fluorouracil had benefits, mainly by decreasing cell viability and proliferation. Furthermore, the combination of itraconazole and 5-fluorouracil seemed to be the most effective, being an interesting focus in future studies.

Keywords: 5-fluorouracil; breast cancer; cell viability; drug combinations; drug repurposing; epithelial-mesenchymal transition.


Conflict of interest statement

The authors declare no conflict of interest.

Figures

Figure 1
Figure 1
Effect of drugs and respective drug combinations on the viability of MCF-7 cells. Each drug and each combination were added in fresh medium, in sextaplicates. Results are presented as mean ± standard error of the mean (SEM) and represent the viability of cells (% of control) of 3–4 independent experiments (n = 3, 4). ### p < 0.001 vs. control; ** p < 0.01 and *** p < 0.001 vs. single drug of the combination with more effect on cell viability reduction. 5-FU: 5-fluorouracil.
Figure 2
Figure 2
Effect of 5-FU, verapamil (A), itraconazole (B) and respective combinations with 5-FU on the viability of MCF-7 cells (left, black bars) and MCF-10A cells (right, white bars). Each drug and combination were added in fresh medium, in sextaplicates. Results are presented as mean ± SEM and represent the viability of cells (% of control) of 3–4 independent experiments (n = 3, 4). ### p < 0.001 and # p < 0.05 vs. respective controls.
Figure 3
Figure 3
Concentration-effect curves obtained for 5-FU. The drug was added in fresh medium, in sextaplicates. Results are presented as mean ± SEM of three independent experiments. The left curves represent the viability of cells (% of control), whereas the right curves represents a normalization between 0 and 1 (0% and 100%), where 100% was defined as the concentration of the drug that less affected the cell viability, and all other data points were normalized to this value, being 0% defined as the concentration that affected more the cell viability. ### p < 0.001 and # p < 0.05 vs. control.
Figure 4
Figure 4
Concentration-effect curves obtained for verapamil. The drug was added in fresh medium, in sextaplicates. Results are presented as mean ± SEM of three independent experiments. The left curve represents the viability of cells (% of control), whereas the right curve represents a normalization between 0 and 1 (0% and 100%), where 100% was defined as the concentration of the drug that less affected the cell viability, and all other data points were normalized to this value, being 0% defined as the concentration that affected more the cell viability. ### p < 0.001 and # p < 0.05 vs. control.
Figure 5
Figure 5
Concentration-effect curves obtained for itraconazole. The drug was added in fresh medium, in sextaplicates. Results are presented as mean ± SEM of five independent experiments. The left curve represents the viability of cells (% of control), whereas the right curve represents a normalization between 0 and 1 (0% and 100%), where 100% was defined as the concentration of the drug that less affected the cell viability, and all other data points were normalized to this value, being 0% defined as the concentration that affected the cell viability more. ## p < 0.01 and # p < 0.05 vs. control.
Figure 6
Figure 6
Effect of verapamil (A) and itraconazole (B) combined with 5-FU on the viability of MCF-7 cells. Each drug and drug combination were added in fresh medium, in sextaplicates. Results are presented as mean ± SEM, and represent the viability of cells (% of control) of three independent experiments. ### p < 0.001, ## p < 0.01 and # p < 0.05 vs. control.
Figure 7
Figure 7
Effect of 5-FU, verapamil, itraconazole, and respective combinations of the last two drugs with 5-FU on the viability of MCF-7 cells, for 48 h (A), 72 h (B). Each drug and drug combination were added in fresh medium, in sextaplicates. Results are presented as mean ± SEM, and represent the viability of cells (% of control) of four independent experiments. ### p < 0.001 vs. control; * p < 0.05 vs. single drug of the combination with more effect on cell viability reduction.
Figure 8
Figure 8
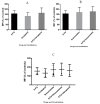
Effect of 5-FU, verapamil, itraconazole, and respective combinations of the last two drugs with 5-FU on the viability of MCF-7 cells, for 48 h (A), 72 h (B) and a comparison of both times (C). Each drug and drug combination were added in fresh medium, in sextaplicates. Results are presented as mean ± SEM, and represent the viability of cells (% of control) of 3–4 independent experiments. ### p < 0.001 and # p < 0.05 vs. control; ** p < 0.01 vs. single drug of the combination with more effect on cell viability reduction.
Figure 9
Figure 9
Effect of 5-FU, verapamil, itraconazole, and respective combinations of the last two drugs with 5-FU on the viability of MCF-7 cells, for 48 h (A) and 72 h (B). In the left, black bars, 5-FU was used in a concentration of 11.8 μM and verapamil and itraconazole were used in a concentration of 55 and 3 μM, respectively. In the right, white bars, all drugs were used in a concentration of 50 μM. Each drug and drug combination were added in fresh medium, in sextaplicates. Results are presented as mean ± SEM, and represent the viability of cells (% of control) of 3–4 experiments.
Figure 10
Figure 10
Expression of EMT markers, AE1/AE3, E-cadherin and vimentin in MCF-7 cells, by immunocytochemistry. All images were obtained through the same pool of cells, but in different cell blocks, in a magnification of 400x. (ac) represent the positive controls for AE1/AE3, E-cadherin and vimentin, respectively. (df) represent images of cells treated with 5-FU combined with verapamil and tested for the presence of AE1/AE3, E-cadherin and vimentin, respectively. Images of cells treated with 5-FU combined with itraconazole and tested for the presence of AE1/AE3, E-cadherin and vimentin are represented by (gi), respectively. Scale bar: 50 μm.
Figure 10
Figure 10
Expression of EMT markers, AE1/AE3, E-cadherin and vimentin in MCF-7 cells, by immunocytochemistry. All images were obtained through the same pool of cells, but in different cell blocks, in a magnification of 400x. (ac) represent the positive controls for AE1/AE3, E-cadherin and vimentin, respectively. (df) represent images of cells treated with 5-FU combined with verapamil and tested for the presence of AE1/AE3, E-cadherin and vimentin, respectively. Images of cells treated with 5-FU combined with itraconazole and tested for the presence of AE1/AE3, E-cadherin and vimentin are represented by (gi), respectively. Scale bar: 50 μm.
Figure 11
Figure 11
Flow cytometry gating strategy used to evaluate apoptosis/necrosis in MCF-7 cells. (A) The gate separated MCF-7 cells from cellular debris, whereas in (B) single cells are gated, thus excluding aggregates. (C) Target cells were distinguished based on PI/Annexin V staining. In Q1 + Q2 are represented cells in necrosis/late apoptosis, in Q3 are represented cells that are in early apoptosis and living cells are represented in Q4. SCC: side-scattered light; FSC: forward-scattered light; AUX: auxiliar; LIN: linear scale; Log: logarithimic scale; PI: propidium iodide
Figure 12
Figure 12
Effect of 5-FU, verapamil (A), itraconazole (B), and respective combinations of the last two drugs with 5-FU on the death of MCF-7 cells, for 3 h. Each drug and drug combination were added in fresh medium, in duplicates. Results are presented as mean ± SEM of two independent experiments.
Figure 13
Figure 13
Effect of 5-FU, verapamil (A), itraconazole (B), and respective combinations of the last two drugs with 5-FU on the death of MCF-7 cells, for 8 h. Each drug and drug combination were added in fresh medium, in duplicates. Results are presented as mean ± standard deviation (SD) of a single experiment.
Figure 14
Figure 14
Cell fluorescence due to CFSE staining. In all graphs, the black line indicates control (stained), the grey line indicates unstained control and the blue line represents 5-FU. (A) The red line indicates the combination of 5-FU + verapamil and the orange line indicates verapamil. (B) Red and orange lines represent 5-FU + itraconazole and itraconazole, respectively.
Figure 15
Figure 15
Effect of 5-FU, verapamil (A), itraconazole (B), and respective combinations of the last two drugs with 5-FU on the proliferation of MCF-7 cells, and a comparison of both experiments (C). Each drug and drug combination was added in fresh medium, in duplicates. Results are presented as mean ± SEM, and represent median fluorescence intensity (MFI) (% of control) of 2 independent experiments.
Figure 16
Figure 16
Flow cytometry gating strategy used in the carboxyfluorescein succinimydil ester (CFSE) proliferation assay of MCF-7 cells. (A) The gate separated MCF-7 cells from cellular debris, whereas in (B) single cells are gated, thus excluding aggregates. (C) Dead cells were excluded by PI incorporation, and (D) represents cell fluorescence due to CFSE staining in non-treated (control) or 5-FU + Verapamil (treated cells), as indicated.

Similar articles

Cited by

References

    1. Malani P.N. Harrison’s Principles of Internal Medicine. JAMA. 2012;308:1813–1814. doi: 10.1001/jama.308.17.1813-b. - DOI
    1. Cancer Research UK Worldwide Cancer Statistics. [(accessed on 8 August 2018)]; Available online: https://www.cancerresearchuk.org/health-professional/cancer-statistics/w....
    1. Cancer Therapy Advisor Breast Cancer (Invasive) Treatment Regimens. [(accessed on 21 March 2018)]; Available online: https://www.cancertherapyadvisor.com/breast-cancer/breast-cancer-invasiv...
    1. Green R.J., Harris N.D. Pathology and Therapeutics for Pharmacists. 3rd ed. Pharmaceutical Press; London, UK: 2008.
    1. Dawood S., Austin L., Cristofanilli M. Cancer stem cells: Implications for cancer therapy. Oncology (Williston Park) 2014;28:1101–1107, 1110. - PubMed

Publication types

MeSH terms