

Per-Arnt-Sim Kinase (PASK) Deficiency Increases Cellular Respiration on a Standard Diet and Decreases Liver Triglyceride Accumulation on a Western High-Fat High-Sugar Diet
- PMID: 30558306
- PMCID: PMC6316003
- DOI: 10.3390/nu10121990
Per-Arnt-Sim Kinase (PASK) Deficiency Increases Cellular Respiration on a Standard Diet and Decreases Liver Triglyceride Accumulation on a Western High-Fat High-Sugar Diet
Abstract
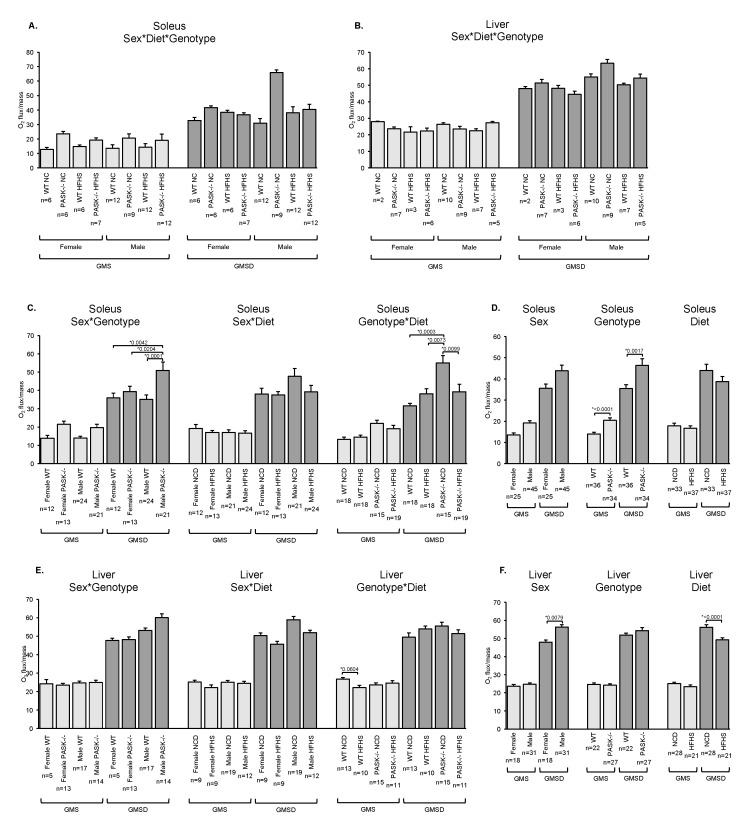
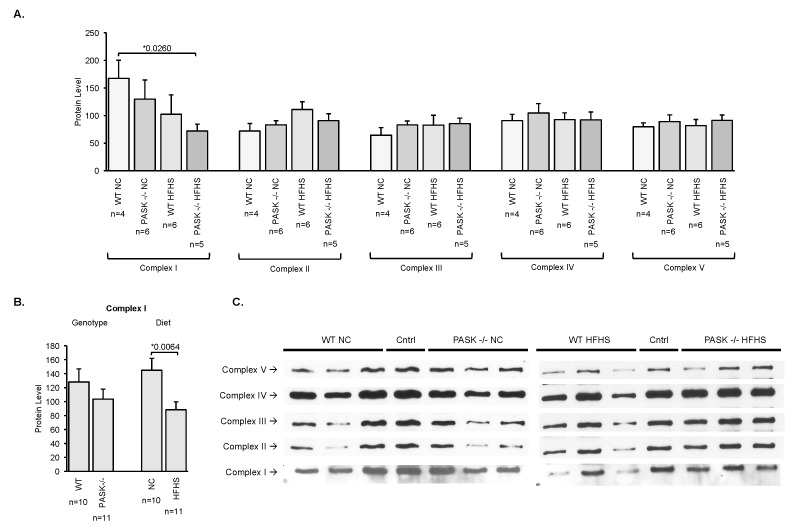
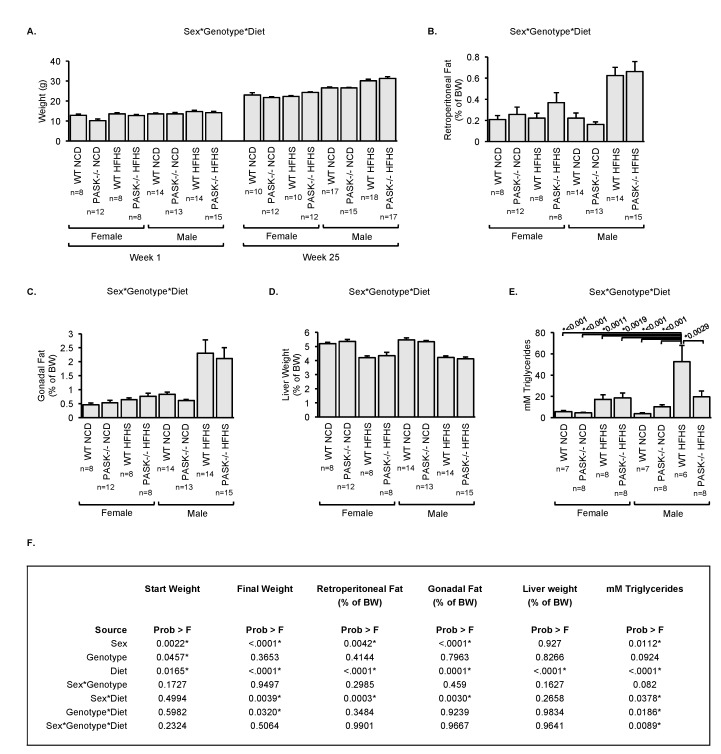
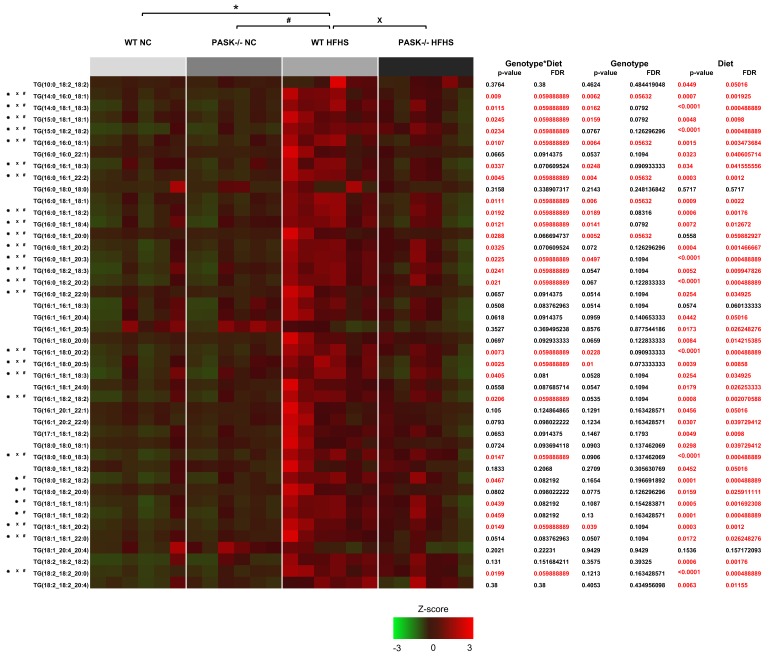
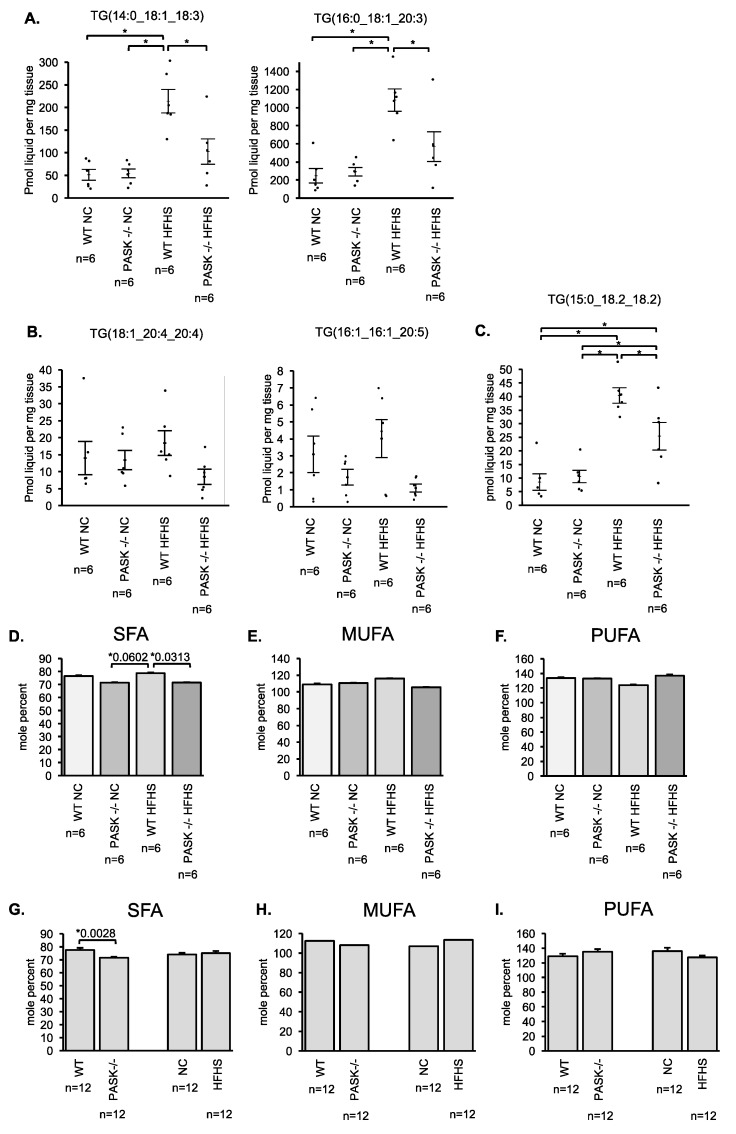
Diabetes and the related disease metabolic syndrome are epidemic in the United States, in part due to a shift in diet and decrease in physical exercise. PAS kinase is a sensory protein kinase associated with many of the phenotypes of these diseases, including hepatic triglyceride accumulation and metabolic dysregulation in male mice placed on a high-fat diet. Herein we provide the first characterization of the effects of western diet (high-fat high-sugar, HFHS) on Per-Arnt-Sim kinase mice (PASK-/-) and the first characterization of both male and female PASK-/- mice. Soleus muscle from the PASK-/- male mice displayed a 2-fold higher oxidative phosphorylation capacity than wild type (WT) on the normal chow diet. PASK-/- male mice were also resistant to hepatic triglyceride accumulation on the HFHS diet, displaying a 2.7-fold reduction in hepatic triglycerides compared to WT mice on the HFHS diet. These effects on male hepatic triglyceride were further explored through mass spectrometry-based lipidomics. The absence of PAS kinase was found to affect many of the 44 triglycerides analyzed, preventing hepatic triglyceride accumulation in response to the HFHS diet. In contrast, the female mice showed resistance to hepatic triglyceride accumulation on the HFHS diet regardless of genotype, suggesting the effects of PAS kinase may be masked.
Keywords: PAS kinase; PASK; electron transport chain; female; hepatic; high-fat high-sugar diet; lipidomics; lipids; liver; mice; respiration; sexual dimorphism; triglycerides; western diet.
Conflict of interest statement
The funders of the study herein had no role in the design of the study; in the collection, analyses, or interpretation of data; in the writing of the manuscript, or in the decision to publish the results. One author (J.H.G.) owns shares of a company developing pharmaceutical inhibitors of PAS kinase.
Figures
Similar articles
-
Gut Microbiota Regulates the Interaction between Diet and Genetics to Influence Glucose Tolerance.Medicines (Basel). 2021 Jul 1;8(7):34. doi: 10.3390/medicines8070034. Medicines (Basel). 2021. PMID: 34357150 Free PMC article.
-
High-fat diet alters PAS kinase regulation by fasting and feeding in liver.J Nutr Biochem. 2018 Jul;57:14-25. doi: 10.1016/j.jnutbio.2018.03.003. Epub 2018 Mar 12. J Nutr Biochem. 2018. PMID: 29649689
-
Per-Arnt-Sim Kinase (PASK): An Emerging Regulator of Mammalian Glucose and Lipid Metabolism.Nutrients. 2015 Sep 7;7(9):7437-50. doi: 10.3390/nu7095347. Nutrients. 2015. PMID: 26371032 Free PMC article. Review.
-
The Effects of Long-Term High Fat and/or High Sugar Feeding on Sources of Postprandial Hepatic Glycogen and Triglyceride Synthesis in Mice.Nutrients. 2024 Jul 9;16(14):2186. doi: 10.3390/nu16142186. Nutrients. 2024. PMID: 39064628 Free PMC article.
-
PAS Kinase: A Nutrient and Energy Sensor "Master Key" in the Response to Fasting/Feeding Conditions.Front Endocrinol (Lausanne). 2020 Dec 18;11:594053. doi: 10.3389/fendo.2020.594053. eCollection 2020. Front Endocrinol (Lausanne). 2020. PMID: 33391184 Free PMC article. Review.
Cited by
-
Advances in Research on Diabetes by Human Nutriomics.Int J Mol Sci. 2019 Oct 29;20(21):5375. doi: 10.3390/ijms20215375. Int J Mol Sci. 2019. PMID: 31671732 Free PMC article. Review.
-
The effects of diet and sex in amyotrophic lateral sclerosis.Rev Neurol (Paris). 2020 May;176(5):301-315. doi: 10.1016/j.neurol.2019.09.008. Epub 2020 Mar 5. Rev Neurol (Paris). 2020. PMID: 32147204 Free PMC article. Review.
-
PAK4 suppresses motor neuron degeneration in hSOD1G93A -linked amyotrophic lateral sclerosis cell and rat models.Cell Prolif. 2021 Apr;54(4):e13003. doi: 10.1111/cpr.13003. Epub 2021 Feb 21. Cell Prolif. 2021. PMID: 33615605 Free PMC article.
-
Gut Microbiota Regulates the Interaction between Diet and Genetics to Influence Glucose Tolerance.Medicines (Basel). 2021 Jul 1;8(7):34. doi: 10.3390/medicines8070034. Medicines (Basel). 2021. PMID: 34357150 Free PMC article.
References
-
- Alberti K.G., Eckel R.H., Grundy S.M., Zimmet P.Z., Cleeman J.I., Donato K.A., Fruchart J.C., James W.P., Loria C.M., Smith S.C., Jr., et al. Harmonizing the metabolic syndrome: A joint interim statement of the International Diabetes Federation Task Force on Epidemiology and Prevention; National Heart, Lung, and Blood Institute; American Heart Association; World Heart Federation; International Atherosclerosis Society; and International Association for the Study of Obesity. Circulation. 2009;120:1640–1645. - PubMed
MeSH terms
Substances
Grants and funding
LinkOut - more resources
Full Text Sources
Medical
Molecular Biology Databases
