. 2018 Dec 17;6(1):226.
doi: 10.1186/s40168-018-0605-2.

Simple statistical identification and removal of contaminant sequences in marker-gene and metagenomics data

Affiliations

Simple statistical identification and removal of contaminant sequences in marker-gene and metagenomics data

Nicole M Davis et al. Microbiome. .

Abstract

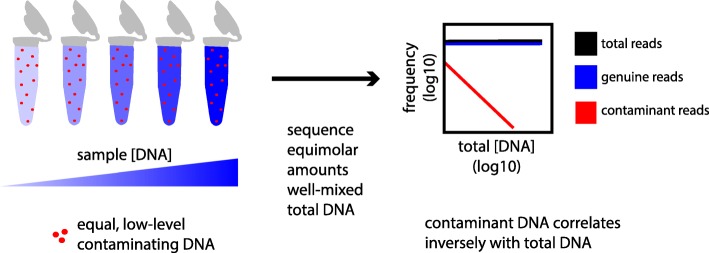
Background: The accuracy of microbial community surveys based on marker-gene and metagenomic sequencing (MGS) suffers from the presence of contaminants-DNA sequences not truly present in the sample. Contaminants come from various sources, including reagents. Appropriate laboratory practices can reduce contamination, but do not eliminate it. Here we introduce decontam ( https://github.com/benjjneb/decontam ), an open-source R package that implements a statistical classification procedure that identifies contaminants in MGS data based on two widely reproduced patterns: contaminants appear at higher frequencies in low-concentration samples and are often found in negative controls.

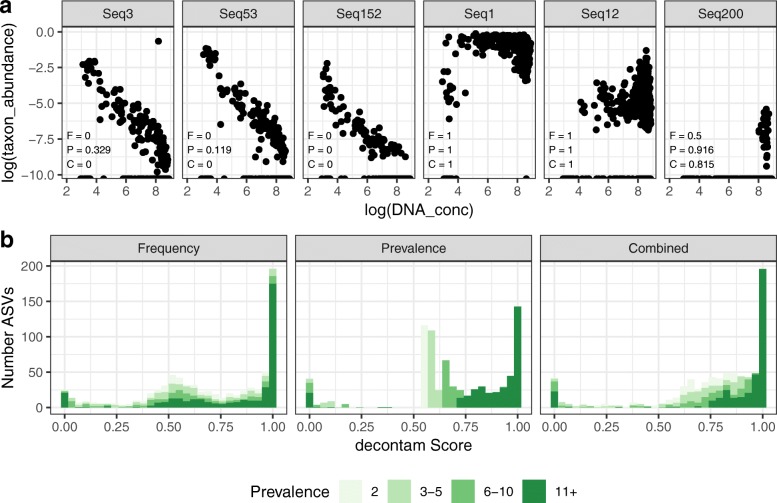
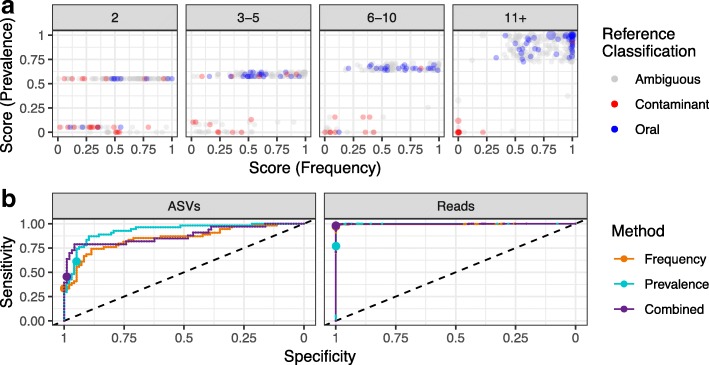
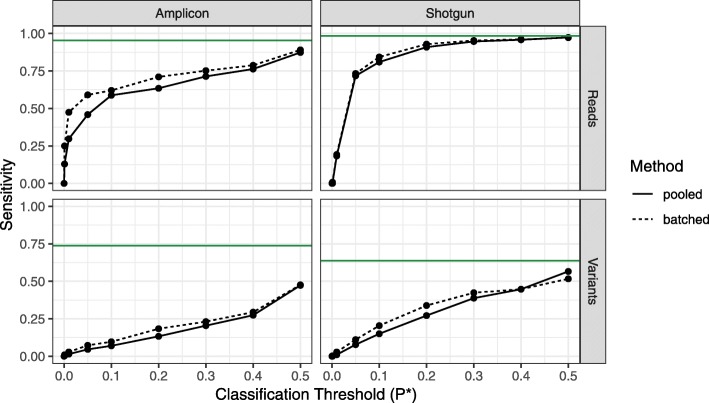
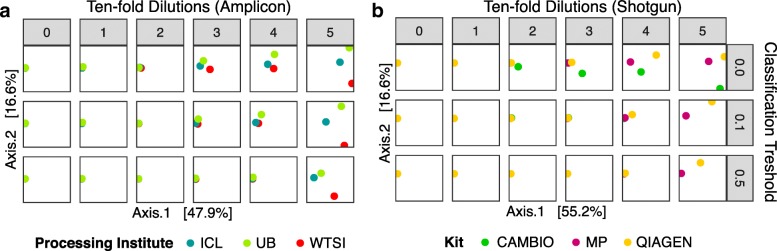
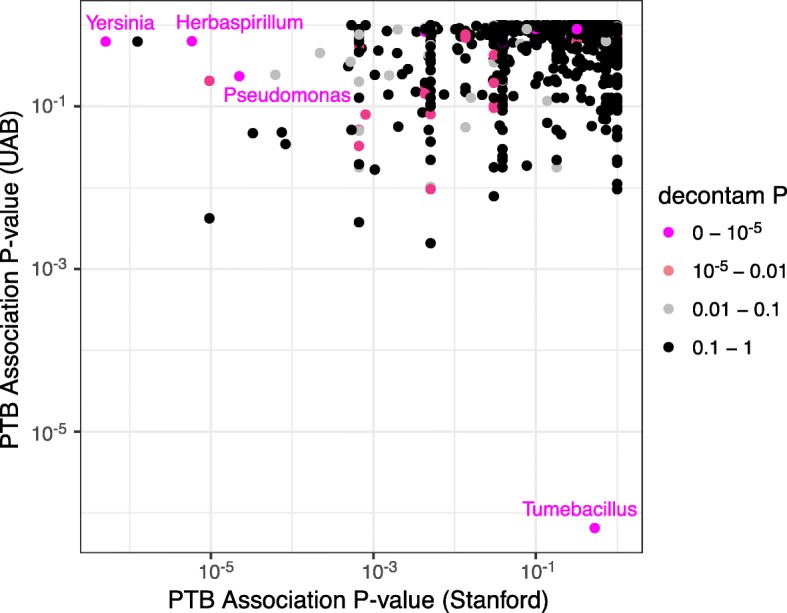
Results: Decontam classified amplicon sequence variants (ASVs) in a human oral dataset consistently with prior microscopic observations of the microbial taxa inhabiting that environment and previous reports of contaminant taxa. In metagenomics and marker-gene measurements of a dilution series, decontam substantially reduced technical variation arising from different sequencing protocols. The application of decontam to two recently published datasets corroborated and extended their conclusions that little evidence existed for an indigenous placenta microbiome and that some low-frequency taxa seemingly associated with preterm birth were contaminants.

Conclusions: Decontam improves the quality of metagenomic and marker-gene sequencing by identifying and removing contaminant DNA sequences. Decontam integrates easily with existing MGS workflows and allows researchers to generate more accurate profiles of microbial communities at little to no additional cost.

Keywords: 16S rRNA gene; DNA contamination; Marker-gene; Metagenomics; Microbiome.


Conflict of interest statement

Ethics approval and consent to participate

The study was approved by the Administrative Panels on Human Subjects Research (Stanford IRB protocol #21586) and by the Human Research Protection Program at UCSF (UCSF IRB protocol ##11-06283). All research subjects provided written informed consent prior to specimen collection.

Consent for publication

Not applicable.

Competing interests

The authors declare that they have no competing interests.

Publisher’s Note

Springer Nature remains neutral with regard to jurisdictional claims in published maps and institutional affiliations.

Figures

Fig. 1
Fig. 1
Mixture model of contaminants and non-contaminants in MGS experiments. Contaminant DNA is expected to be present in approximately equal and low concentrations across samples, while sample DNA concentrations can vary widely. As a result, the expected frequency of contaminant DNA varies inversely with total sample DNA concentration (red), while the expected frequency of non-contaminant DNA does not (blue)
Fig. 2
Fig. 2
Frequency patterns and decontam scores of microbial sequences from an oral 16S rRNA gene dataset. a Frequency patterns of six sequences from a 16S rRNA gene study of human oral mucosal microbial communities. The frequencies of sequence variants Seq3, Seq152, and Seq53 vary inversely with sample DNA, a characteristic of contaminants. The frequencies of Seq1, Seq12, and Seq200 are independent of sample DNA concentration, a characteristic of genuine sample sequences. Scores for each of the six sequences were computed by the frequency (F), prevalence (P), and combined (C) methods as implemented in the isContaminant function in the decontam R package, and are indicated in the bottom left of each panel. b Scores for each amplicon sequence variant (ASV) present in two or more samples were computed as in a. The histogram of scores is shown, with color intensity depending on the number of samples (or prevalence) in which each ASV was present
Fig. 3
Fig. 3
Classification accuracy of decontam on microbial sequences in an oral mucosa dataset. a The scores assigned by the frequency and prevalence methods are plotted for each ASV present in two or more samples in the oral mucosa dataset. Points are colored if their genus can be unambiguously classified as oral or contaminant by comparison to a compiled reference database. b ASVs with unambiguous reference-based classifications were used as the ground truth for evaluating the sensitivity and specificity of decontam. Receiver-operator-characteristic (ROC) curves are plotted for the frequency, prevalence, and combined methods at the level of ASVs and at the level of reads (i.e., weighting by ASV relative abundance). Points show the default classification threshold of P* = 0.1
Fig. 4
Fig. 4
Proportion of contaminants in the S. bongori dilution series identified by the decontam frequency method. The frequency method was applied to all data pooled together (solid line), and on a per-batch basis (dashed line). Batches were specified as the sequencing centers for the 16S data, and the DNA extraction kits for the shotgun data. The fraction of contaminants identified (sensitivity) was evaluated on a per-read basis and on a per-variant basis (ASVs for 16S data, genera for shotgun data) over a range of classification thresholds. Green lines show maximum possible classifier sensitivity, given that decontam cannot identify contaminants only present in a single sample
Fig. 5
Fig. 5
Removal of contaminants identified by decontam reduces technical variation in dilution series of S. bongori. A dilution series of 0, 1, 2, 3, 4, and 5 ten-fold dilutions of a pure culture of Salmonella bongori was subjected to a amplicon sequencing of the 16S rRNA gene at three sequencing centers and b shotgun sequencing using three different DNA extraction kits. Contaminants were identified by the decontam frequency method with a classification threshold of P* = 0.0 (no contaminants identified), P* = 0.1 (default), and P* = 0.5 (aggressive identification). After contaminant removal, pairwise between-sample Bray-Curtis dissimilarities were calculated, and an MDS ordination was performed. The two dimensions explaining the greatest variation in the data are shown
Fig. 6
Fig. 6
Diagnosing contamination in an exploratory analysis of the vaginal microbiota and preterm birth (PTB). The association between PTB and an increase in the average gestational frequency of various ASVs was evaluated in the two cohorts of women (Stanford and UAB) analyzed in [19]. The x- and y-axes display the P values of the association between increased gestational frequency and PTB (one-sided Wilcoxon rank-sum test) in the Stanford and UAB cohorts, respectively. Points are colored by the score assigned to them by the isContaminant function in the decontam R package, using the combined method. Several ASVs that were strongly associated with PTB in either the Stanford or UAB cohorts are clearly identified as contaminants with a decontam score of less than 10−5 (genera in magenta text)

Comment in

Similar articles

Cited by

References

    1. Fox GC, Stackebrandt E, Hespell RB, Gibson J, Maniloff J, Dyer TA, Wolfe RS, Balch WE, Tanner RS, Magrum LJ, Zablen LB. The phylogeny of prokaryotes. Science. 1980;209:457–463. doi: 10.1126/science.6771870. - DOI - PubMed
    1. Eckburg PB, Bik EM, Bernstein CN, Purdom E, Dethlefsen L, Sargent M, Gill SR, Nelson KE, Relman DA. Diversity of the human intestinal microbial flora. Science. 2005;308:1635–1638. doi: 10.1126/science.1110591. - DOI - PMC - PubMed
    1. Turnbaugh PJ, Hamady M, Yatsunenko T, Cantarel BL, Duncan A, Ley RE, Sogin ML, Jones WJ, Roe BA, Affourtit JP, Egholm M. A core gut microbiome in obese and lean twins. Nature. 2009;457:480-4. - PMC - PubMed
    1. Ravel J, Gajer P, Abdo Z, Schneider GM, Koenig SS, McCulle SL, Karlebach S, Gorle R, Russell J, Tacket CO, Brotman RM. Vaginal microbiome of reproductive-age women. Proc Natl Acad Sci U S A. 2011;108(Suppl 1):4680–4687. doi: 10.1073/pnas.1002611107. - DOI - PMC - PubMed
    1. Riesenfeld CS, Schloss PD, Handelsman J. Metagenomics: genomic analysis of microbial communities. Annu Rev Genet. 2004;38:525–552. doi: 10.1146/annurev.genet.38.072902.091216. - DOI - PubMed

Publication types