

Projecting ESRD Incidence and Prevalence in the United States through 2030
- PMID: 30559143
- PMCID: PMC6317596
- DOI: 10.1681/ASN.2018050531
Projecting ESRD Incidence and Prevalence in the United States through 2030
Abstract
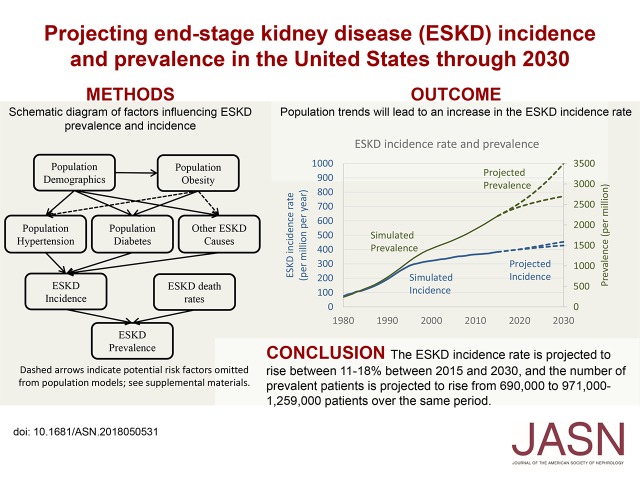
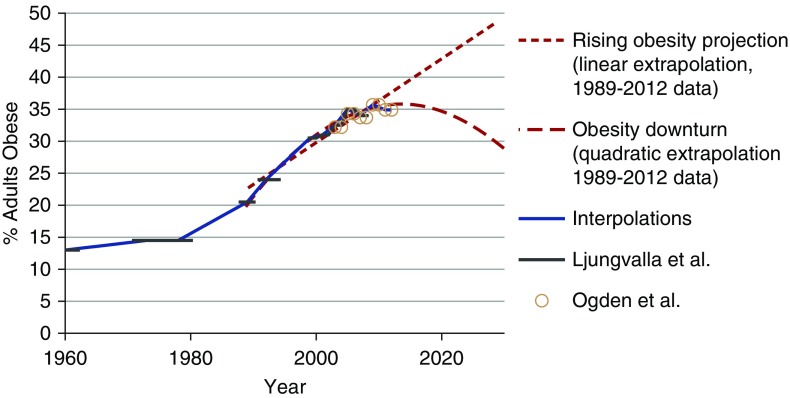
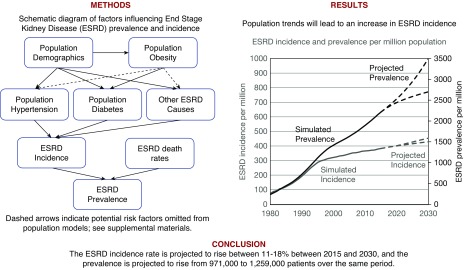
Background: Population rates of obesity, hypertension, diabetes, age, and race can be used in simulation models to develop projections of ESRD incidence and prevalence. Such projections can inform long-range planning for ESRD resources needs.
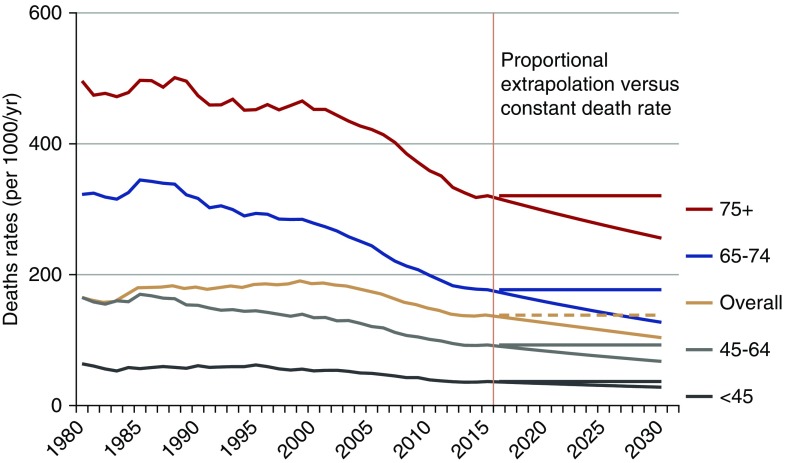
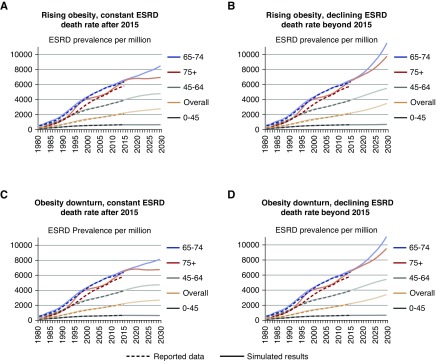
Methods: We used an open compartmental simulation model to estimate the incidence and prevalence of ESRD in the United States through 2030 on the basis of wide-ranging projections of population obesity and ESRD death rates. Population trends in age, race, hypertension, and diabetes were on the basis of data from the Centers for Disease Control and Prevention's National Health and Nutrition Examination Survey and the US Census.
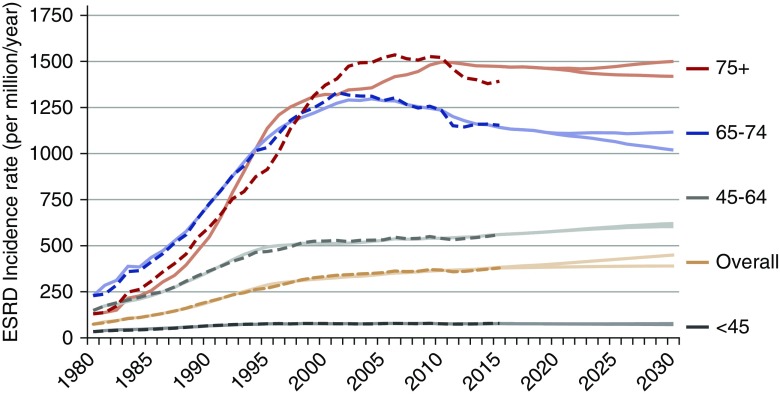
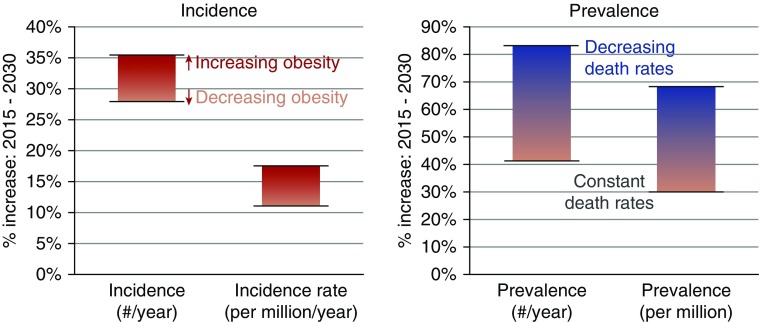
Results: The increase in ESRD incidence rates within age and race groups has leveled off and/or declined in recent years, but our model indicates that population changes in age and race distribution, obesity and diabetes prevalence, and ESRD survival will result in a 11%-18% increase in the crude incidence rate from 2015 to 2030. This incidence trend along with reductions in ESRD mortality will increase the number of patients with ESRD by 29%-68% during the same period to between 971,000 and 1,259,000 in 2030.
Conclusions: The burden of ESRD will increase in the United States population through 2030 due to demographic, clinical, and lifestyle shifts in the population and improvements in RRT. Planning for ESRD resource allocation should allow for substantial continued growth in the population of patients with ESRD. Future interventions should be directed to preventing the progression of CKD to kidney failure.
Keywords: United States Renal Data System; computer simulation; demographic trends; end stage kidney disease.
Copyright © 2019 by the American Society of Nephrology.
Figures
Comment in
-
Growth of the ESKD Population: Progress or Peril?J Am Soc Nephrol. 2019 Jan;30(1):3-4. doi: 10.1681/ASN.2018111135. Epub 2018 Dec 17. J Am Soc Nephrol. 2019. PMID: 30559145 Free PMC article. No abstract available.
References
-
- United States Renal Data System : Medicare expenditures for persons with ESRD. In: 2017 USRDS Annual Data Report: Epidemiology of Kidney Disease in the United States, Bethesda, MD, National Institutes of Health, National Institute of Diabetes and Digestive and Kidney Diseases, 2017. Available at: http://www.usrds.org. Accessed February 8, 2018
-
- United States Renal Data System : Medicare expenditures for persons with ESRD. In: 2015 USRDS Annual Data Report: Epidemiology of kidney disease in the United States, Bethesda, MD, National Institutes of Health, National Institute of Diabetes and Digestive and Kidney Diseases, 2015. Available at: http://www.usrds.org. Accessed February 8, 2018
-
- United States Renal Data System : Incidence, prevalence, patient characteristics, and treatment modalities. In: 2015 USRDS Annual Data Report: Epidemiology of kidney disease in the United States, Bethesda, MD, National Institutes of Health, National Institute of Diabetes and Digestive and Kidney Diseases, 2015. Available at: http://www.usrds.org. Accessed February 8, 2018
-
- United States Census Bureau : Older People Projected to Outnumber Children for First Time in U.S. History, 2018. Available at: https://www.census.gov/newsroom/press-releases/2018/cb18-41-population-p.... Accessed May 1, 2018
-
- Nelder JA, Mead R: A simplex method for function minimization. Comput J 7: 308–313, 1965
Publication types
MeSH terms
Grants and funding
LinkOut - more resources
Full Text Sources
Other Literature Sources
Medical
