. 2019 Mar 1;25(5):1574-1587.
doi: 10.1158/1078-0432.CCR-18-2036. Epub 2018 Dec 17.

AKT/mTORC2 Inhibition Activates FOXO1 Function in CLL Cells Reducing B-Cell Receptor-Mediated Survival

Affiliations

AKT/mTORC2 Inhibition Activates FOXO1 Function in CLL Cells Reducing B-Cell Receptor-Mediated Survival

Emilio Cosimo et al. Clin Cancer Res. .

Abstract

Purpose: To determine whether inhibition of mTOR kinase-mediated signaling represents a valid therapeutic approach for chronic lymphocytic leukemia (CLL).

Experimental design: Stratification of mTOR activity was carried out in patients with primary CLL samples and an aggressive CLL-like mouse model. The potency of dual mTOR inhibitor AZD8055 to induce apoptosis in primary CLL cells was assessed in the presence/absence of B-cell receptor (BCR) ligation. Furthermore, we addressed the molecular and functional impact of dual mTOR inhibition in combination with BTK inhibitor ibrutinib.

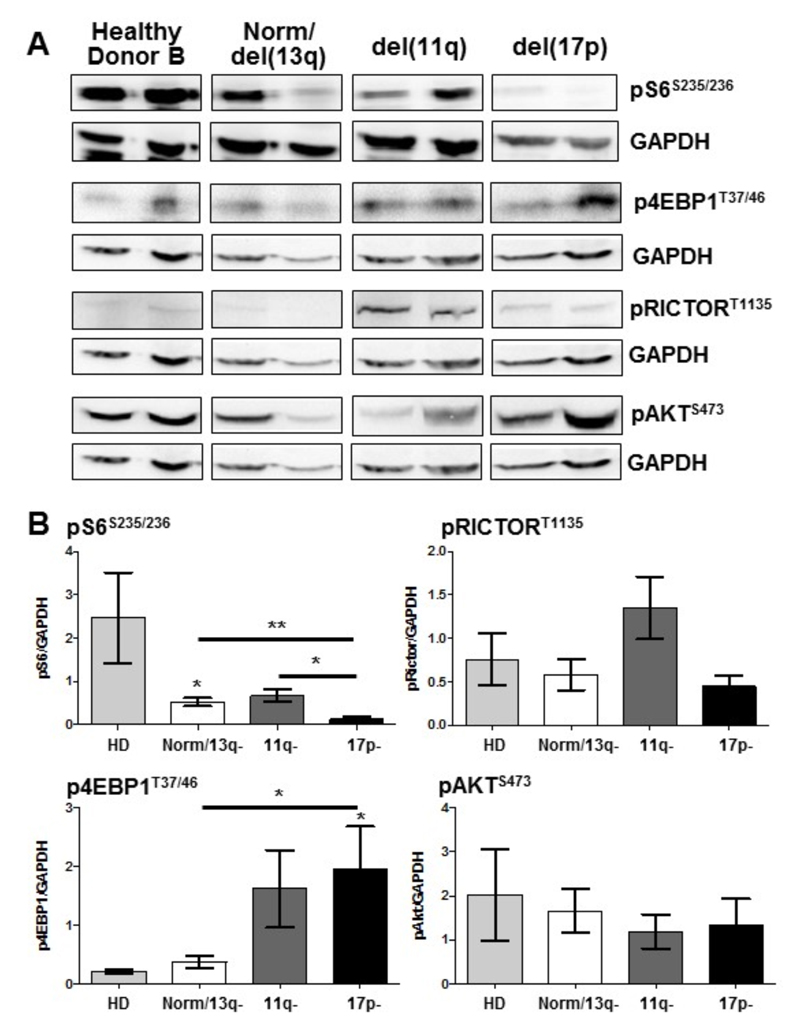
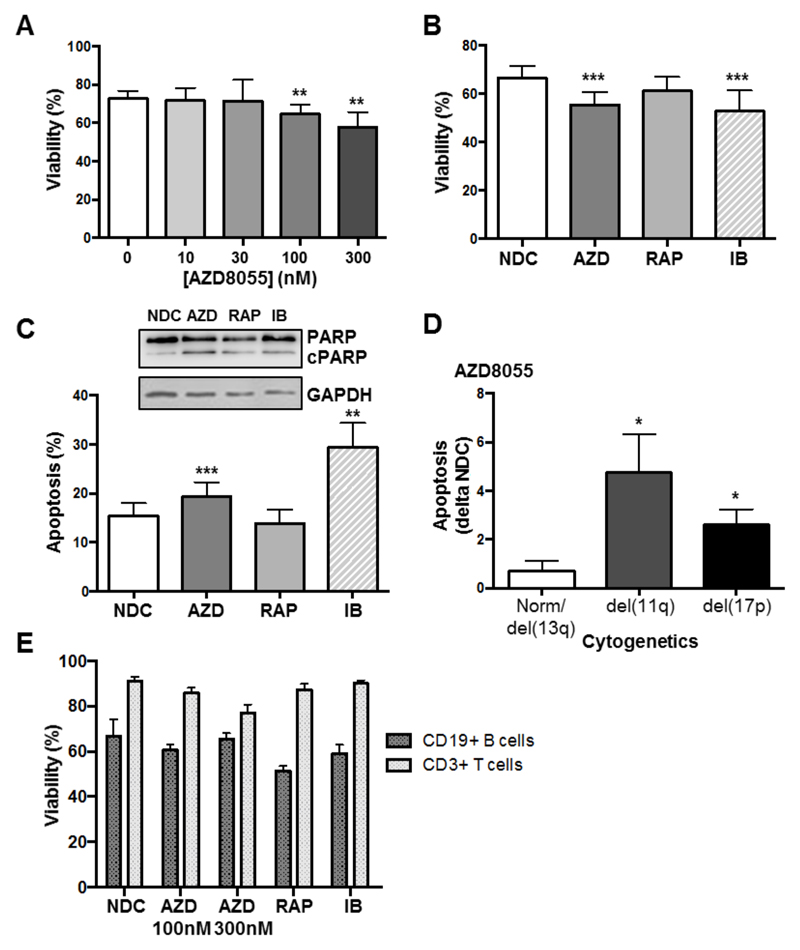
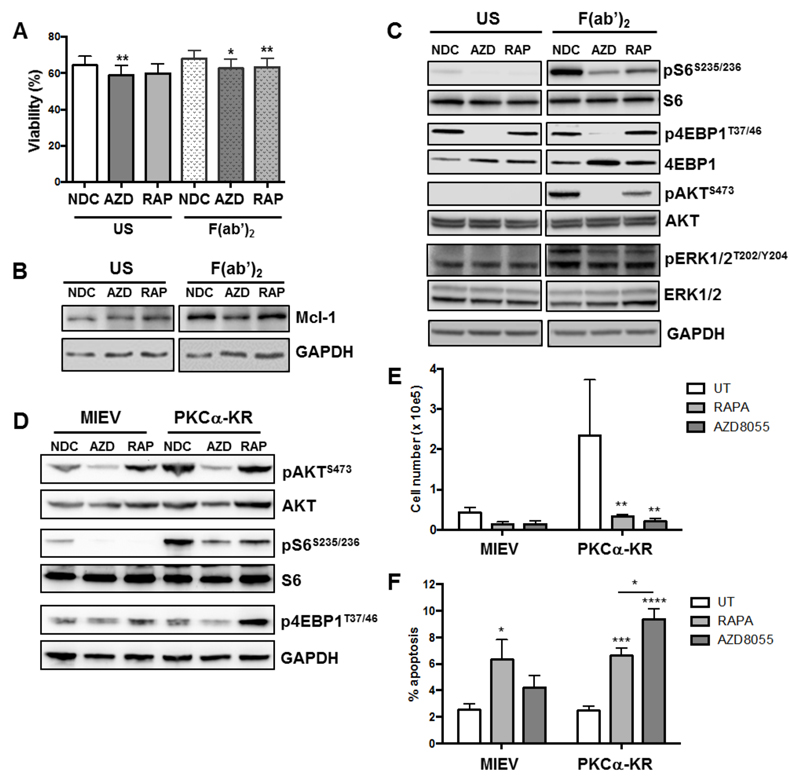
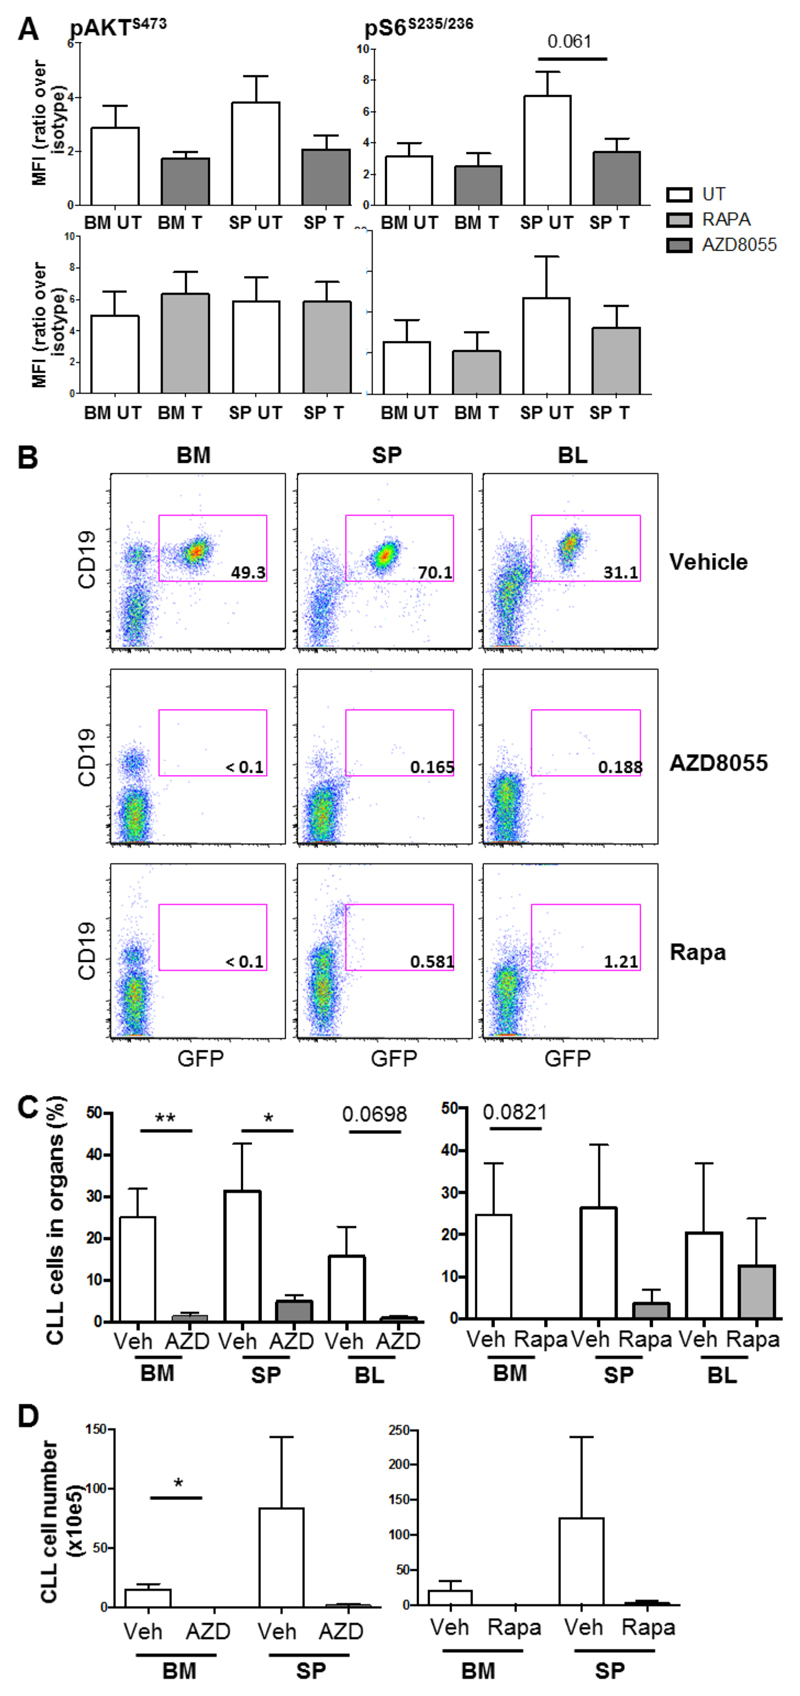
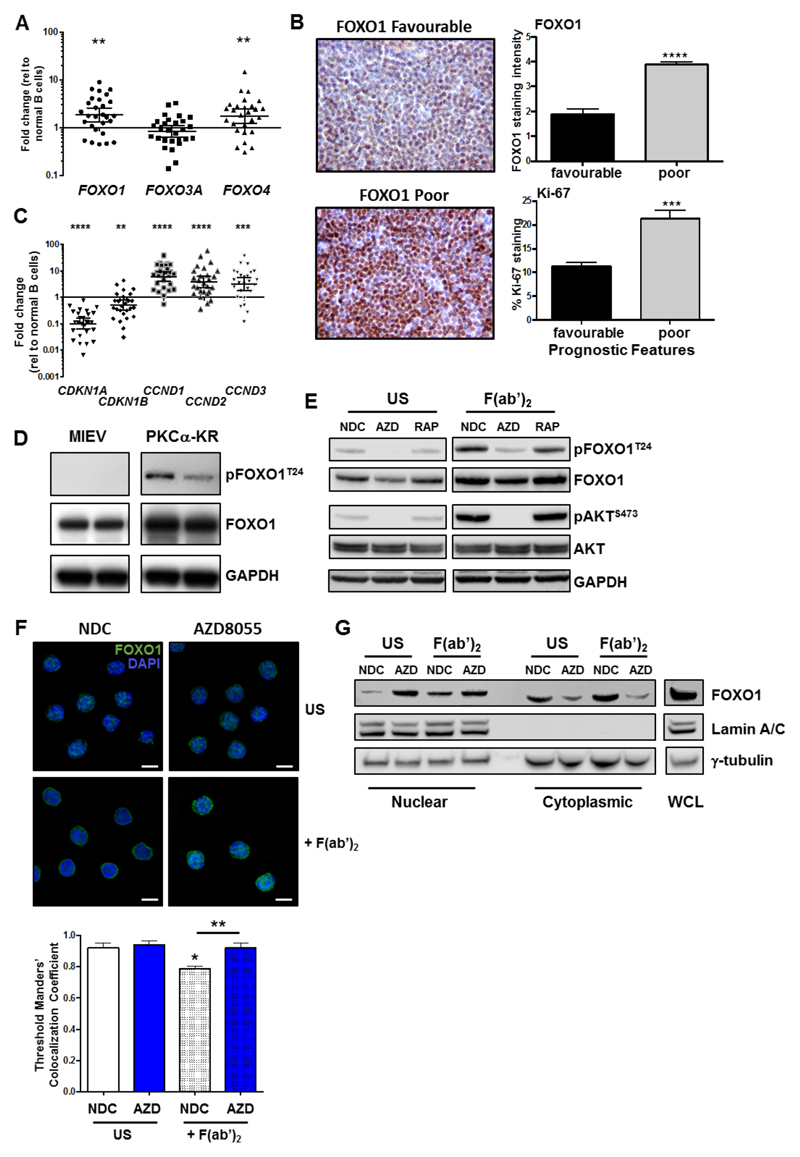
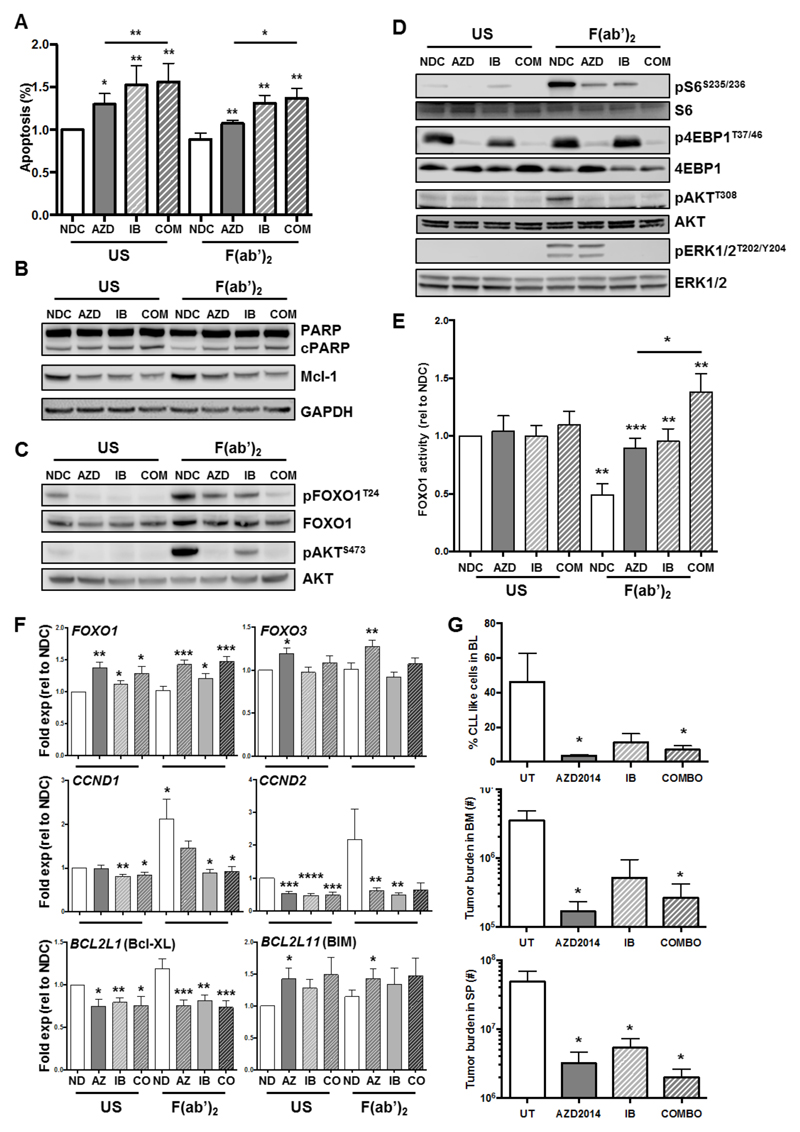
Results: Differential regulation of basal mTORC1 activity was observed in poor prognostic CLL samples, with elevated p4EBP1T37/46 and decreased p70S6 kinase activity, suggesting that dual mTORC1/2 inhibitors may exhibit improved response in poor prognostic CLL compared with rapalogs. AZD8055 treatment of primary CLL cells significantly reduced CLL survival in vitro compared with rapamycin, preferentially targeting poor prognostic subsets and overcoming BCR-mediated survival advantages. Furthermore, AZD8055, and clinical analog AZD2014, significantly reduced CLL tumor load in mice. AKT substrate FOXO1, while overexpressed in CLL cells of poor prognostic patients in LN biopsies, peripheral CLL cells, and mouse-derived CLL-like cells, appeared to be inactive. AZD8055 treatment partially reversed FOXO1 inactivation downstream of BCR crosslinking, significantly inhibiting FOXO1T24 phosphorylation in an mTORC2-AKT-dependent manner, to promote FOXO1 nuclear localization, activity, and FOXO1-mediated gene regulation. FOXO1 activity was further significantly enhanced on combining AZD8055 with ibrutinib.

Conclusions: Our studies demonstrate that dual mTOR inhibitors show promise as future CLL therapies, particularly in combination with ibrutinib.


Conflict of interest statement

Conflict of Interest Statement: At the time of the study, SG and SC were employed by AstraZeneca. Additional authors declare no potential conflicts of interest.

Figures

Figure 1
Figure 1. Downstream mTORC1/mTORC2 substrates are differentially regulated in primary CLL cells isolated from distinct prognostic subgroups.
Protein lysates were generated from freshly-isolated B lineage cells (CLL/mature B cells) purified from peripheral blood of CLL patients or healthy donors. CLL patients were stratified based on cytogenetic abnormalities to indicate prognosis: normal/del(13q) (good), del(11q), del(17p) (poor). A. Western blotting was performed to determine the phosphorylated levels of mTORC1 downstream targets (S6S235/236, 4EBP1T37/46 and RICTORT1135) and mTORC2 substrate (AKTS473) together with GAPDH as a loading control. Representative n=2 for each subset shown. B. Densitometry ratios of phosphorylated proteins vs. GAPDH from the blot are shown. n≥6 for each patient subset, n≥4 healthy controls.
Figure 2
Figure 2. AZD8055 treatment selectively and significantly reduces primary CLL cell viability preferentially in poor prognostic subsets.
A. Primary CLL cells were incubated with increasing concentrations of AZD8055 or left untreated for 48 h (n=12 CLL patient samples). Cell viability was analyzed by flow cytometry, with the percentage of viable cells assessed as Annexin V-7-AAD-; B. Cell viability was compared upon treatment of primary CLL cells with 100 nM AZD8055 (AZD; blue), 10 nM rapamycin (RAP; red) or 1 μM ibrutinib (IB; pink) for 48 h, compared with NDC (white), (n=15); C. The level of apoptosis (Annexin V+7-AAD-) was compared upon treatment of primary CLL cells with 100 nM AZD8055, 10 nM rapamycin or 1 μM ibrutinib for 48 h, relative to NDC. p values generated by a paired two tailed t test (n=15). Inset: Western blotting was performed to show the levels of PARP cleavage (cPARP) in primary CLL cells treated with 100 nM AZD8055, 10 nM rapamycin or 1 μM ibrutinib for 48 h, or left untreated (NDC). GAPDH is included as a loading control. D. The level of apoptosis induced in primary CLL cells treated with 100 nM AZD8055 minus background (NDC) was compared between cytogenetic subgroups: good (Norm/del(13q)) vs poor (del(11q) or (17p)). p value generated by an unpaired two tailed t test (n≥7 per subgroup). E. Freshly-isolated peripheral blood mononuclear cells from healthy donors, were incubated with 100 or 300 nM AZD8055, 10 nM RAP or 1 μM IB for 48 h, compared with NDC. Cell viability of B (CD19+) and T (CD3+) populations was assessed, as indicated (n=6).
Figure 3
Figure 3. mTOR inhibition with AZD8055 or rapamycin treatment overcomes the pro-survival effect of BCR crosslinking in primary CLL cells and in a poor prognostic CLL mouse model in vitro.
CLL cells were pre-treated with 100 nM AZD8055 (AZD) or 10 nM rapamycin (RAP), or left untreated (NDC) and then BCR was ligated with addition of F(ab’)2 fragments for 1 or 48 h or left unstimulated (US), as indicated. A. Cell viability was analyzed by flow cytometry after 48 h incubation (n=14). p value generated by a paired two tailed t test; B. Western blotting of the anti-apoptotic protein Mcl-1 was performed after 48 h incubation; C. Western blotting was performed to determine the phosphorylated levels of mTORC1 downstream targets (S6S235/236 and 4EBP1T37/46) and mTORC2 substrate (AKTS473) and pERK (pERK1/2T202/Y204) together with the respective total proteins and a GADPH loading control, 1 h post drug treatment; D. MIEV- or PKCα-KR-HSPC-derived mouse cells from OP9 co-cultures (post d14) were treated for 24 h in the presence of 100 nM AZD8055 or 10 nM rapamycin or left untreated as indicated. Western blotting was performed to determine the phosphorylated levels of mTORC1 downstream targets (S6S235/236 and 4EBP1T37/46) and mTORC2 substrate (AKTS473) together with the respective total proteins or GAPDH. E. 5 x 10⁴ d15 MIEV- or PKCα-KR-HSPC-derived cells were plated on OP9 co-cultures and treated for 48 h in the presence of 200 nM AZD8055 or 10 nM rapamycin or left untreated as indicated, and cells were counted. Data are represented as mean (± SEM) of at least 3 biological replicates. F. Apoptosis was analyzed by flow cytometry after 48 h treatment of MIEV- or PKCα-KR-HSPC-derived cells. Annexin V+7AAD- cells represent early apoptotic cells. Data are represented as mean (± SEM) of at least 4 biological replicates. Significance was determined by a 2-way ANOVA.
Figure 4
Figure 4. Treatment of leukemic mice with AZD8055 leads to a significant reduction in CLL tumor load in vivo.
A. After confirmation of a population of CLL-like cells in the blood (≥ 5% GFP+CD19+), mice were dosed with 20 mg/kg AZD8055, 4 mg/kg rapamycin or respective vehicle controls for 2 h. Thereafter, cells were isolated from BM and spleen (SP) and levels of AKTS473 and S6S235/235 phosphorylation was determined on GFP+B220+ cells with intracellular flow cytometric analysis. Data are represented as mean fluorescence intensity (MFI) ratio of stained sample over isotype control (n=6). p value was generated using the student’s unpaired t-test. B. After confirmation of a population of CLL-like cells in the blood (≥ 0.4% GFP+CD19+), mice were dosed daily with 20 mg/kg AZD8055 (OG), 4 mg/kg rapamycin (IP) or respective vehicle control for up to 14 days. Thereafter, blood, BM and spleen were analyzed for leukemic burden. Representative flow cytometric analyses of vehicle-, AZD8055- or rapamycin-treated mice are shown. Data shown are analyzed for CLL cell markers, CD19 and GFP after live and size (FSC/SSC) and CD45+ gating. The percentage of GFP+ CLL-like cells within the total population is shown; C. Percentage and D. Number of GFP+ CD45+CD19+ cells are shown in treated mice in the organs indicated. All data shown are the mean (± SEM) of 5 individual mice. p values were generated using the student’s unpaired t-test.
Figure 5
Figure 5. FOXO1 is reactivated with AZD8055 treatment upon BCR ligation.
A. RNA was isolated from fresh CLL samples (n=28) and qPCR was performed to measure expression levels of FOXO gene family members. A scatterplot of gene expression is shown, each symbol denotes an individual CLL sample. Bars indicate the mean fold change in gene expression relative to 10 healthy B cell samples ± SEM; B. IHC was performed on LN biopsies from CLL patients of favourable (n=11) and poor prognosis (n=9). Representative images are shown for FOXO1 staining. FOXO1 and Ki-67 stained LN sections were scored and compared between favourable and poor prognostic CLL samples; C. qPCR (from A; n=28) was performed to measure expression levels of FOXO target genes as indicated. Bars indicate the mean fold change in gene expression relative to 10 healthy samples ± SEM; D. Protein lysates were generated from in vitro co-cultures of MIEV- or PKCα-KR-transduced mouse cell cultures. Western blotting compared the phosphorylated and expression levels of FOXO1T24 and total FOXO1 respectively, compared with loading control GAPDH. E-G. CLL cells were pre-treated with 100 nM AZD8055, 10 nM rapamycin, or left untreated (NDC) as indicated. BCR was ligated with addition of F(ab’)2 fragments for 1 h or US. E. Western blotting assessed phosphorylated levels of FOXO1T24 and AKTS473 and expression levels of total FOXO1 and AKT. GAPDH is included as a loading control; F. CLL cells were fixed and permeabilized and stained with anti-FOXO1 Ab (green) and DAPI (blue). Top: A representative 100x deconvoluted image of primary CLL cells is shown (n=3); Scale bar, 5 µm. Bottom: Analyses of the IF images (x40) were performed in CellProfiler to quantify colocalisation of FOXO1 fluorescent intensity levels with DAPI (nuclear stain) in individual cells from individual CLL patients. The average Threshold Manders Colocalisation Coefficient for each condition from 3 individual CLL patient samples is shown. G. MEC-1 cells were pre-treated for 30 min with 100 nM AZD8055 (AZD) or left untreated (NDC) as indicated and then BCR was ligated for 1 or left US. Thereafter nuclear and cytoplasmic fractions were prepared and immunoblotted alongside whole cell lysates (WCL). Western blotting shows the levels of FOXO1, lamin A/C (nuclear) and γ-tubulin (cytoplasmic) proteins in each condition. Representative blot shown of n=3 biological replicates.
Figure 6
Figure 6. Combination of AZD8055 with Ibrutinib further increases FOXO1 function upon BCR ligation in primary CLL cells.
CLL cells were pre-treated for 30 min with 100 nM AZD8055 (AZD) or 1 μM ibrutinib (IB) alone or in combination, or left untreated (NDC) as indicated and then BCR was ligated with addition of F(ab’)2 fragments for 1, 24 or 48 h or left US, as indicated. A. Cell viability was analyzed by flow cytometry after 48 h incubation (n=7). p value generated by a paired two tailed t test; B. Western blotting was performed to determine the level of PARP cleavage and Mcl-1 expression after 48 h incubation (n=4). GAPDH is included as a loading control; C&D. Western blotting was performed to determine the phosphorylated levels of FOXO1T24/FOXO1 (C), AKTS473/AKT (C), S6S235/236/S6 (D), 4EBP1T37/45/4EBP1 (D), AKTT308/AKT (D) and pERK1/2T202/Y204/ERK1/2 (D) (n≥4); E. Nuclear lysates were generated from CLL cells and DNA binding activity of FOXO1 was assessed in each condition, as indicated (n=5). Statistical significance calculated using a student’s t test; F. RNA was prepared from CLL cells (n≥8 individual patient samples) treated with AZD8055 (AZ) or ibrutinib (IB) alone or together (CO) in the presence or absence of BCR ligation after 24 h incubation as indicated, and mRNA expression levels of FOXO1, FOXO3, CCND1-2, BCL2L1, and BCL2L11 were determined by qPCR. Each gene is expressed relative to GUSB reference gene and calibrated to ND US or ND F(ab’)2 samples. Data are mean ± SEM, and p values generated by a paired two-tailed t-test. G. After confirmation of a population of CLL-like cells in the blood, mice were dosed daily with 15 mg/kg AZD2014 (OG), 12 mg/kg ibrutinib (OG) alone or in combination, or respective vehicle control for up to 14 days. Thereafter, blood, BM and spleen were analyzed for leukemic burden. The average percentage of GFP+ CLL-like cells in the blood is shown for each treatment arm (top); Cell number of GFP+ CD45+CD19+ population is shown in treated mice in the BM (middle) and SP (bottom). All data shown are the mean (± SEM) of 5 individual mice. p values were generated using the student’s unpaired t-test.

Similar articles

Cited by

References

    1. Kipps TJ, Stevenson FK, Wu CJ, Croce CM, Packham G, Wierda WG, et al. Chronic lymphocytic leukaemia. Nat Rev Dis Primers. 2017;3 16096. - PMC - PubMed
    1. Zenz T, Mertens D, Küppers R, Döhner H, Stilgenbauer S. From pathogenesis to treatment of chronic lymphocytic leukaemia. Nat Rev Cancer. 2010;10:37–50. - PubMed
    1. Damle RN, Wasil T, Fais F, Ghiotto F, Valetto A, Allen SL, et al. Ig V gene mutation status and CD38 expression as novel prognostic indicators in chronic lymphocytic leukemia. Blood. 1999;94(6):1840–7. - PubMed
    1. Hamblin TJ, Davis Z, Gardiner A, Oscier DG, Stevenson FK. Unmutated Ig V(H) genes are associated with a more aggressive form of chronic lymphocytic leukemia. Blood. 1999;94(6):1848–54. - PubMed
    1. Wiestner A, Rosenwald A, Barry TS, Wright G, Davis RE, Henrickson SE, et al. ZAP-70 expression identifies a chronic lymphocytic leukemia subtype with unmutated immunoglobulin genes, inferior clinical outcome, and distinct gene expression profile. Blood. 2003;101:4944–51. - PubMed

Publication types

MeSH terms

Substances