. 2019 Jan 2;116(1):287-296.
doi: 10.1073/pnas.1814185115. Epub 2018 Dec 17.

Human induced pluripotent stem cell-derived MGE cell grafting after status epilepticus attenuates chronic epilepsy and comorbidities via synaptic integration

Affiliations

Human induced pluripotent stem cell-derived MGE cell grafting after status epilepticus attenuates chronic epilepsy and comorbidities via synaptic integration

Dinesh Upadhya et al. Proc Natl Acad Sci U S A. .

Abstract

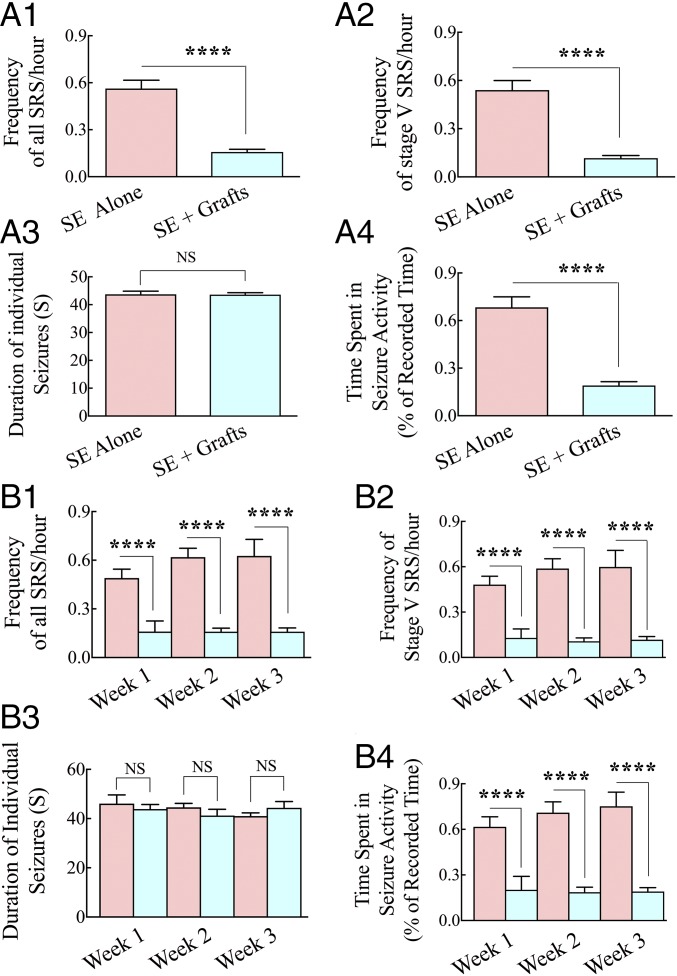
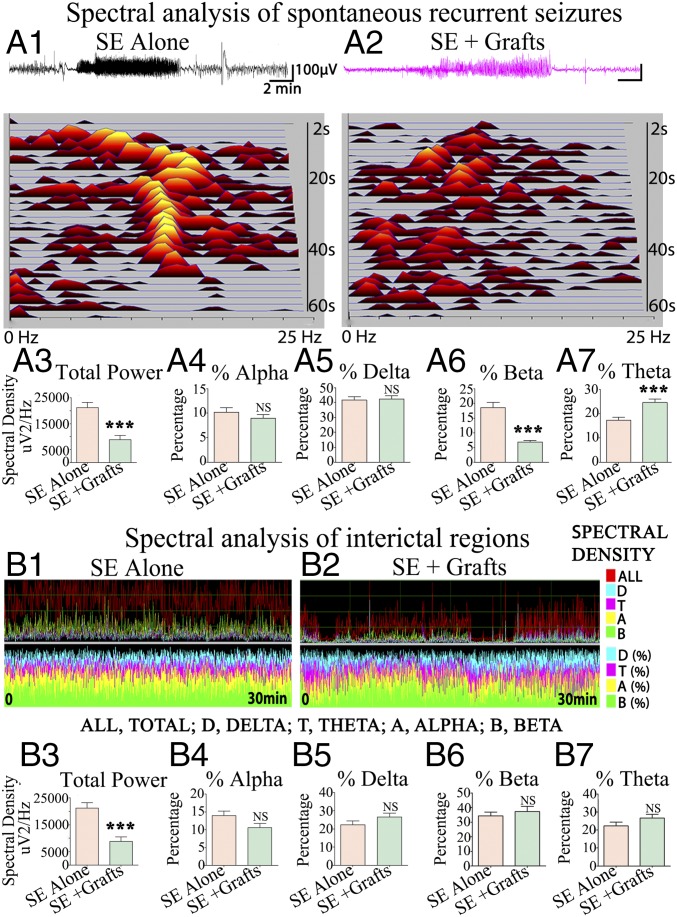
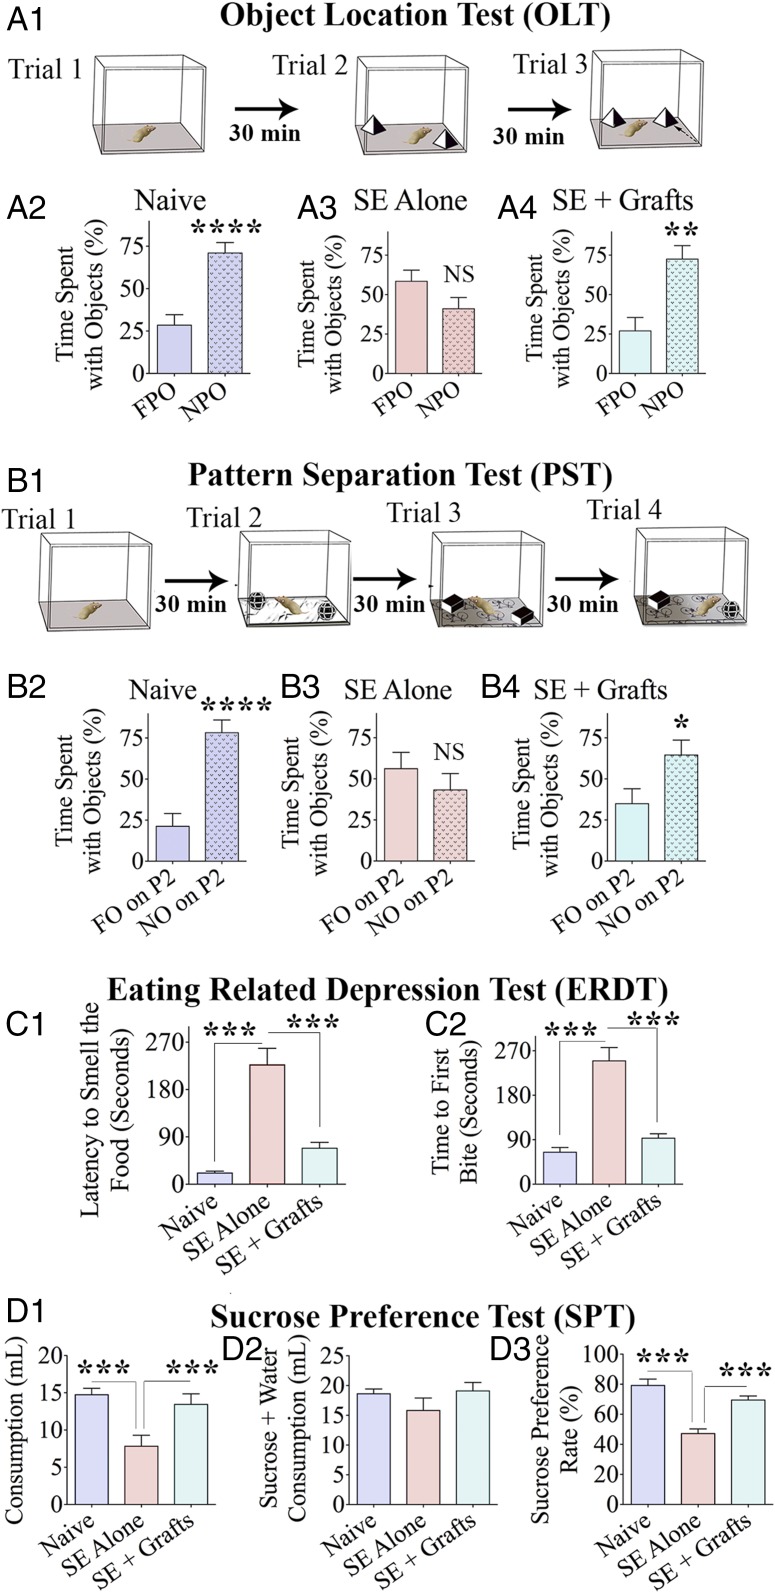
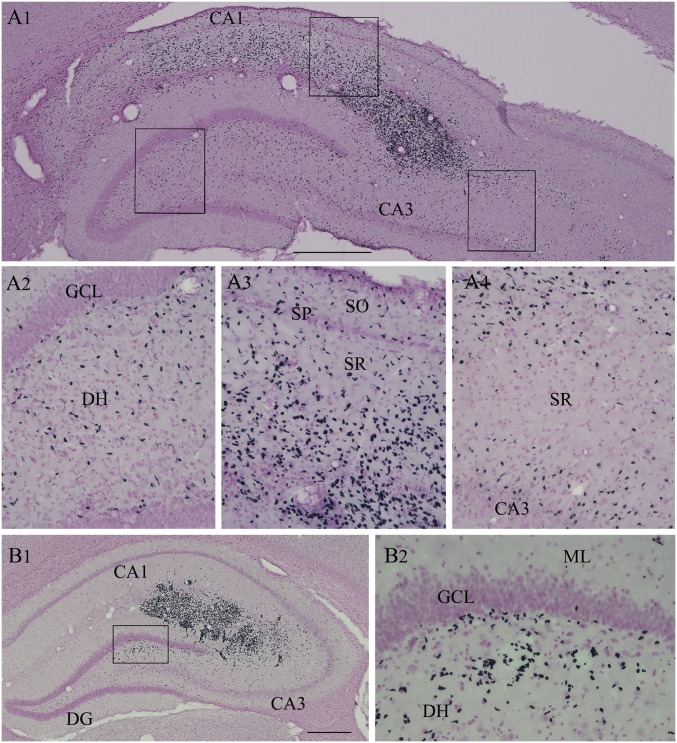
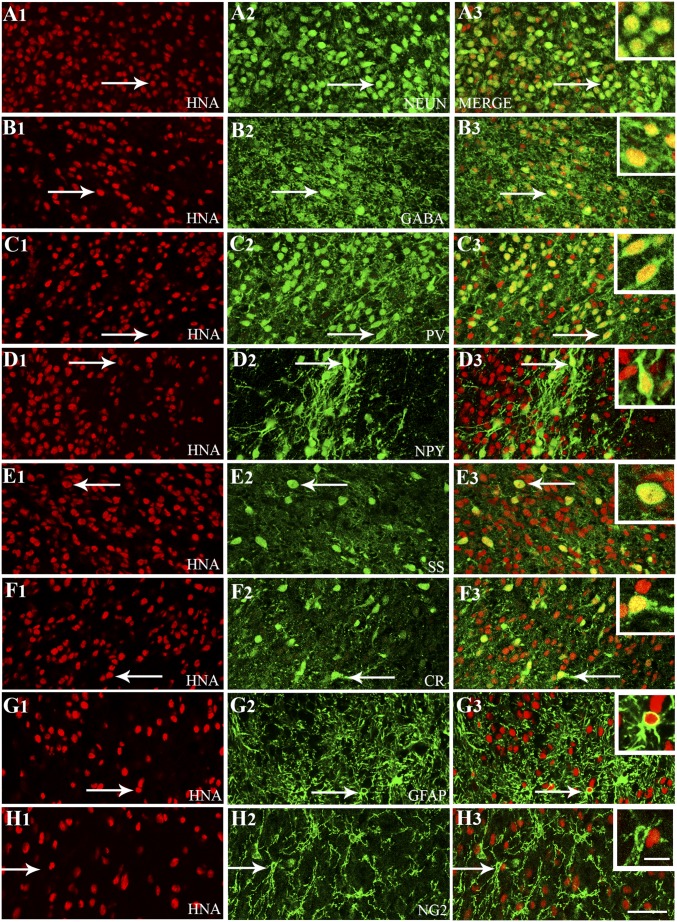
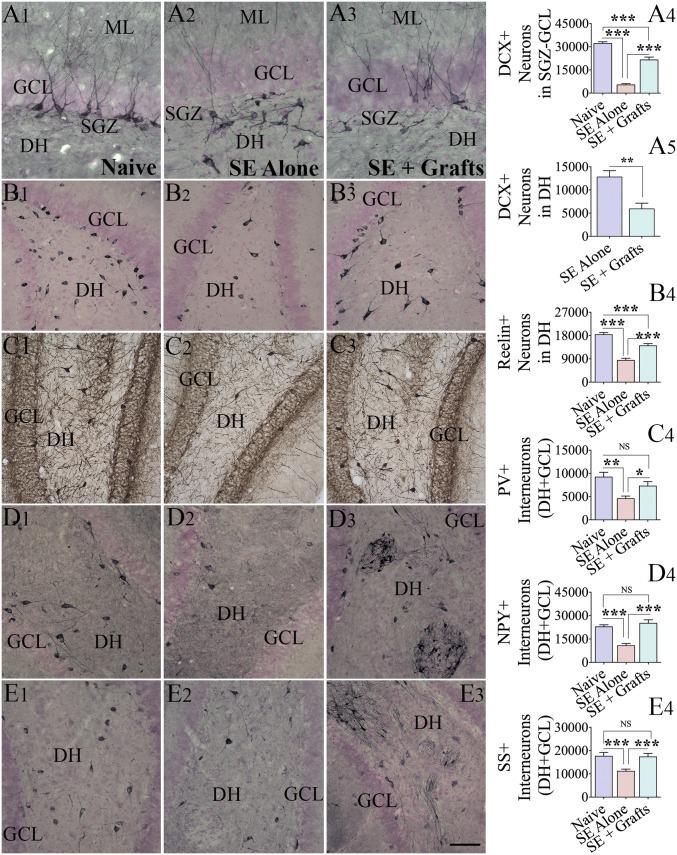
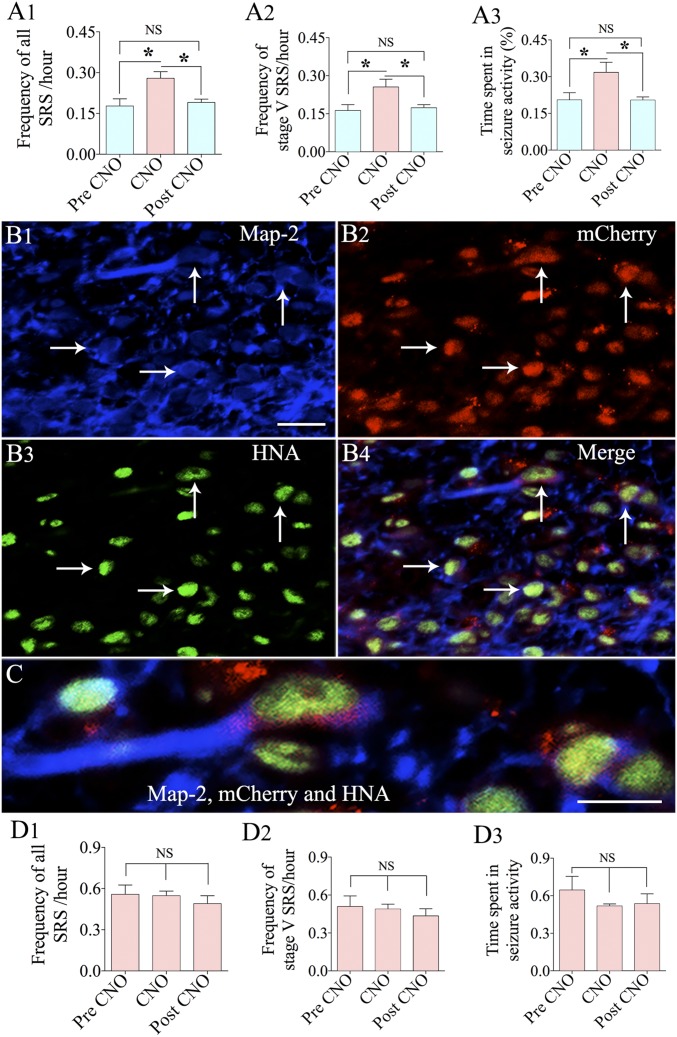
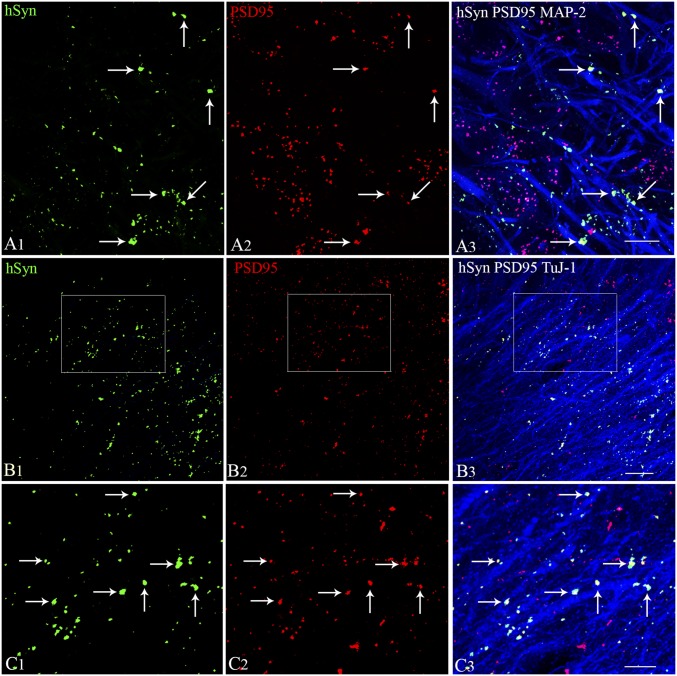
Medial ganglionic eminence (MGE)-like interneuron precursors derived from human induced pluripotent stem cells (hiPSCs) are ideal for developing patient-specific cell therapy in temporal lobe epilepsy (TLE). However, their efficacy for alleviating spontaneous recurrent seizures (SRS) or cognitive, memory, and mood impairments has never been tested in models of TLE. Through comprehensive video- electroencephalographic recordings and a battery of behavioral tests in a rat model, we demonstrate that grafting of hiPSC-derived MGE-like interneuron precursors into the hippocampus after status epilepticus (SE) greatly restrained SRS and alleviated cognitive, memory, and mood dysfunction in the chronic phase of TLE. Graft-derived cells survived well, extensively migrated into different subfields of the hippocampus, and differentiated into distinct subclasses of inhibitory interneurons expressing various calcium-binding proteins and neuropeptides. Moreover, grafting of hiPSC-MGE cells after SE mediated several neuroprotective and antiepileptogenic effects in the host hippocampus, as evidenced by reductions in host interneuron loss, abnormal neurogenesis, and aberrant mossy fiber sprouting in the dentate gyrus (DG). Furthermore, axons from graft-derived interneurons made synapses on the dendrites of host excitatory neurons in the DG and the CA1 subfield of the hippocampus, implying an excellent graft-host synaptic integration. Remarkably, seizure-suppressing effects of grafts were significantly reduced when the activity of graft-derived interneurons was silenced by a designer drug while using donor hiPSC-MGE cells expressing designer receptors exclusively activated by designer drugs (DREADDs). These results implied the direct involvement of graft-derived interneurons in seizure control likely through enhanced inhibitory synaptic transmission. Collectively, the results support a patient-specific MGE cell grafting approach for treating TLE.

Keywords: EEG recordings; GABA-ergic progenitors; cognition and mood; medial ganglionic eminence; temporal lobe epilepsy.


Conflict of interest statement

The authors declare no conflict of interest.

Figures

Fig. 1.
Fig. 1.
hMGE-like cell grafting into the hippocampus after SE greatly restrained the frequency and intensity of SRS in the chronic phase. Data from 3 wk of continuous EEG recordings measured in the fifth month after SE are illustrated for the SE-alone and SE + grafts groups (n = 6 per group). The frequency of all SRS (A1), the frequency of stage V SRS (A2), the duration of individual SRS (A3), and the percentage of time spent in SRS activity (A4) are compared. ****P < 0.0001. Additional analyses of SRS activity on a week-by-week basis demonstrated consistent reductions in all SRS (B1), stage V SRS (B2), and the percentage of time spent in SRS activity (B4) over 3 wk. As shown in A3 and B3, the duration of individual seizures was not different between the two groups in either analysis. ****P < 0.0001; NS, not significant.
Fig. 2.
Fig. 2.
Spectral analysis of SRS and interictal periods demonstrated reduced EEG power in animals receiving intrahippocampal grafts of hMGE-like cells after SE. Representative spectral densities seen during SRS in an animal from the SE-alone group (A1) and an animal from the SE + grafts group (A2) are illustrated. The average spectral density (A3) and alpha, delta, beta, and theta waves (A4A7) are compared between the two groups (20 SRS per animal, n = 5 per group). Delta, theta, alpha, and beta wave activity during an interictal period in an animal from the SE-alone group (B1) and an animal from the SE + grafts group (B2) is illustrated. The average spectral density (B3) and percentages of alpha, delta, beta, and theta waves (B4B7) are compared between the two groups (four to 10 interictal segments per animal, n = 5 per group). ***P < 0.001; NS, not significant.
Fig. 3.
Fig. 3.
hMGE-like cell grafting into the hippocampus after SE maintained better cognitive and mood function in the chronic phase. The various phases (trials) involved in an OLT (A1) and a pattern separation test (PST; B1) are graphically depicted. (A2A4 and B2B4) Bar charts compare percentages of time spent with different objects (n = 6–10 per group). Bar charts compare latencies to smell food (C1) and the first bite of food (C2) in an ERDT between the three groups of animals (n = 6–10 per group). (D1D3) Bar charts show data from a sucrose preference test (SPT), which is a test for measuring anhedonia. The bar chart in D2 compares the amount of total liquid (sucrose + water) consumption between groups. *P < 0.05; **P < 0.01; ***P < 0.001; ****P < 0.0001; NS, not significant.
Fig. 4.
Fig. 4.
Cells derived from hMGE-like cell grafts placed into the hippocampus after SE pervasively migrated to different subfields and layers of the hippocampus. (A1) Example of migration of cells from an hMGE graft core located at the end of the hippocampal fissure. Magnified views of regions from A1 showing the extensive migration of graft-derived cells into the dentate hilus (A2), the CA1 subfield (A3), and the CA3 subfield (A4) are shown. (B1 and B2) Another example of robust migration of cells into the DH from an hMGE graft core located in the hippocampal fissure and the adjoining CA1 and CA3 subfields. DH, dentate hilus; ML, molecular layer; SGZ, subgranular zone; SO, stratum oriens; SP, stratum pyramidale; SR, stratus radiatum. (Scale bars: A1, 400 μm; B1, 200 μm; A2A4 and B2, 100 μm.)
Fig. 5.
Fig. 5.
Cells derived from hMGE-like cell grafts placed into the hippocampus after SE differentiated predominantly into GABA-expressing interneurons comprising various subclasses. Differentiation of hMGE graft-derived cells into neurons expressing neuron-specific nuclear antigen (NeuN; A1A3) and interneurons expressing GABA (B1B3) is illustrated. Differentiation of hMGE graft-derived cells into subclasses of interneurons expressing PV (C1C3), NPY (D1D3), SS (E1E3), and calretinin (CR; F1F3) is illustrated. (G1H3) Differentiation of hMGE graft-derived cells into GFAP+ astrocytes is minimal, and none of the hMGE graft-derived cells differentiate into neuron-glia 2+ (NG2+) oligodendrocyte progenitors. All cells in red (first column) denote graft-derived cells expressing HNA (a marker of human cells), whereas cells in green (second column) illustrate cells expressing neuronal or glial antigens. The third column illustrates merged images from columns 1 and 2. Arrows in A1G3 denote examples of dual-labeled cells, whereas arrows in H1H3 denote a host NG2+ cell. (Insets) In the third column, magnified views of cells indicated by arrows are displayed. (Scale bars: A1H3, 50 μm; Insets, 20 μm.)
Fig. 6.
Fig. 6.
hMGE-like cell grafting after SE maintained higher levels of normal neurogenesis with reduced abnormal neurogenesis and diminished the loss of various subclasses of host interneurons. Distribution and density of DCX+ newly born neurons in the subgranular zone (SGZ)-GCL and the dentate hilus (DH) (A1–A3) and reelin+ interneurons in the DH (B1B3) from representative animals belonging to naive (first column), SE-alone (second column), and SE + grafts (third column) groups are illustrated. Bar charts compare numbers of DCX+ neurons in the SGZ-GCL (A4; normal neurogenesis) and the DH (A5; abnormal neurogenesis). (B4) Bar chart compares the number of reelin+ interneurons between different groups (n = 5 per group). The distribution and density of interneurons expressing PV (C1C3), NPY (D1D3), and SS (E1E3) in the DH and GCL of representative animals belonging to naive (first column), SE-alone (second column), and SE + grafts (third column) groups are illustrated. Arrows in D3 and E3 denote clusters of NPY+ and SS+ interneurons derived from hMGE grafts. (C4, D4, and E4) Bar charts compare numbers of PV+, NPY+, and SS+ interneurons in DH + GCL between different groups (n = 5 per group). The numbers include both graft-derived interneurons and host interneurons in these charts. The numbers of host interneurons only are shown in SI Appendix, Fig. S6. ML, molecular layer; NS, not significant. *P < 0.05; **P < 0.01; ***P < 0.001. (Scale bars: A1A3, 100 μm; B1B3, C1C3, D1D3, and E1E3, 200 μm.)
Fig. 7.
Fig. 7.
Analysis using hMGE-like cells labeled with DREADDs as donor cells confirmed that graft-derived GABA-ergic interneurons contributed to the suppression of seizures in animals receiving hMGE grafts after SE. Bar charts compare frequencies of all SRS (A1) and stage V SRS (A2) and the percentage of time spent in SRS activity for the recording period (A3) in continuous EEG recordings taken during different periods of CNO administration in animals receiving grafts of hMGE cells transduced with AAV-hSyn-hM4D(Gi)-mCherry after SE (n = 5). Images of triple immunofluorescence for MAP-2 (a marker of neurons; B1, blue), mCherry (reflecting the expression of DREADDs; B2, red), and HNA (a marker of graft-derived cells; B3, green) are shown, demonstrating the presence of mCherry in neurons derived from hMGE grafts (indicated by arrows). (B4) Merged image showing all three colors. (B4 and C) mCherry expression was mostly restricted to the soma of neurons. (D1D3) Bar charts compare the effects of CNO administration on SRS activity in SE-alone animals (n = 5). NS, not significant. *P < 0.05. (Scale bars: B1B4, 20 μm; C, 10 μm.)
Fig. 8.
Fig. 8.
Synapse formation between graft-derived axons and host hippocampal excitatory neurons in the DG and the CA1 subfield. Synapses between hSyn-expressing axon endings from graft-derived neurons (A1, green) and PSD-95–expressing regions (A2, red) on MAP-2 positive dendrites of DG granule cells (A3, blue) are illustrated. Direct contacts between hSyn+ and PSD-95+ structures show the location of synapses on DG granule cell dendrites (indicated by arrows in A3). Synapses between hSyn+ axon endings from graft-derived neurons (B1, green) and PSD-95+ regions (B2, red) on TuJ-1+ dendrites of CA1 pyramidal neurons (B3, blue) are illustrated. (C1C3) Magnified views of areas from B1B3 showing synaptic contacts between graft-derived hSyn+ presynaptic terminals on PSD95+ postsynaptic regions in the host hippocampal CA1 pyramidal neuron dendrites. Two 1-μm-thick consecutive optical sections (two adjacent sections) were employed to confirm the presence of both pre- and postsynaptic puncta (hSyn- and PSD95-stained structures) on dendrites. (Scale bars: A1A3 and C1C3, 10 μm; B1B3, 20 μm.)

Similar articles

Cited by

References

    1. Dudek FE, Hellier JL, Williams PA, Ferraro DJ, Staley KJ. The course of cellular alterations associated with the development of spontaneous seizures after status epilepticus. Prog Brain Res. 2002;135:53–65. - PubMed
    1. Dingledine R, Varvel NH, Dudek FE. When and how do seizures kill neurons, and is cell death relevant to epileptogenesis? Adv Exp Med Biol. 2014;813:109–122. - PMC - PubMed
    1. Goldberg EM, Coulter DA. Mechanisms of epileptogenesis: A convergence on neural circuit dysfunction. Nat Rev Neurosci. 2013;14:337–349. - PMC - PubMed
    1. Seinfeld S, Goodkin HP, Shinnar S. Status epilepticus. Cold Spring Harb Perspect Med. 2016;6:a022830. - PMC - PubMed
    1. Löscher W, Brandt C. Prevention or modification of epileptogenesis after brain insults: Experimental approaches and translational research. Pharmacol Rev. 2010;62:668–700. - PMC - PubMed

Publication types