. 2019 Jan 16;132(2):jcs226704.
doi: 10.1242/jcs.226704.

Contractility kits promote assembly of the mechanoresponsive cytoskeletal network

Affiliations

Contractility kits promote assembly of the mechanoresponsive cytoskeletal network

Priyanka Kothari et al. J Cell Sci. .

Abstract

Cellular contractility is governed by a control system of proteins that integrates internal and external cues to drive diverse shape change processes. This contractility controller includes myosin II motors, actin crosslinkers and protein scaffolds, which exhibit robust and cooperative mechanoaccumulation. However, the biochemical interactions and feedback mechanisms that drive the controller remain unknown. Here, we use a proteomics approach to identify direct interactors of two key nodes of the contractility controller in the social amoeba Dictyostelium discoideum: the actin crosslinker cortexillin I and the scaffolding protein IQGAP2. We highlight several unexpected proteins that suggest feedback from metabolic and RNA-binding proteins on the contractility controller. Quantitative in vivo biochemical measurements reveal direct interactions between myosin II and cortexillin I, which form the core mechanosensor. Furthermore, IQGAP1 negatively regulates mechanoresponsiveness by competing with IQGAP2 for binding the myosin II-cortexillin I complex. These myosin II-cortexillin I-IQGAP2 complexes are pre-assembled into higher-order mechanoresponsive contractility kits (MCKs) that are poised to integrate into the cortex upon diffusional encounter coincident with mechanical inputs.This article has an associated First Person interview with the first author of the paper.

Keywords: Cortexillin I; FCCS; IQGAP; LC-MS; Myosin II; SiMPull.


Conflict of interest statement

Competing interestsThe authors declare no competing or financial interests.

Figures

Fig. 1.
Fig. 1.
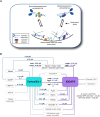
Identification of protein interactors of the contractility control system by mass spectrometry and immunoprecipitation. (A) A schematic of the core contractility controller that governs assembly of contractile machinery (myosin II and cortexillin I). Chemical and mechanical signals, as well as feedback through the IQGAPs, tune the accumulation of contractile machinery at the site of stress. Whether these proteins accumulated individually or through pre-assembled complexes under stress was unknown. (B) Potential protein interactions identified by cytoskeletal fractionation and immunoprecipitation followed by LC-MS. Lines between proteins indicate potential interactions, with corresponding G-scores from comparison with GFP control for cytosolic or cytoskeletal fractions. RNP-1A was not detected by mass spectrometry, but is related to RNP-1B and was discovered as a genetic suppressor of nocodazole. Results are from three biological replicates. (C) Precipitation of FLAG–GFP from KAx3 (WT) or cortI::FLAG-GFP-cortexillin I cells with an anti-FLAG antibody. The cortexillin I precipitate pulls down endogenous myosin II, as indicated by western analysis with anti-FLAG and anti-myosin II heavy chain (MHC) antibodies. Results are representative of two biological replicates. Immunoprecipitation was performed on the cytosolic (soluble) and cytoskeletal fractions prepared in the same manner as for the LC-MS analysis in panel B.
Fig. 2.
Fig. 2.
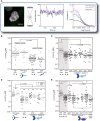
Cortexillin I and IQGAP2 interact with myosin II in the cytoplasm as detected by FCCS. (A) Schematic depicting FCCS. A representative fluorescence image of a cortI-null Dictyostelium cell expressing a linked GFP–mCherry construct. The plus sign indicates the region of confocal volume imaged. Confocal volume, indicated in gray, represents acquisition of fluorescent particles in the confocal volume. Corresponding fluorescence fluctuations recorded, and auto-correlation and cross-correlation traces are depicted. (B) Apparent, or in vivo, KD for negative and positive controls indicated. A fusion GFP–mCherry or GFP–myosin II S1–mCherry both show positive cross-correlations and apparent KD values in the submicromolar range. (C) FCCS detects interactions between cortexillin I and myosin II in various genetic backgrounds. (D) Treatment with 5 µM Latrunculin A does not alter the in vivo KD values between cortexillin I and myosin II. (E) IQGAP2 and myosin II also interact by FCCS. While the interaction is lost in an iqg2-null, it is restored upon removal of IQGAP1 (iqg1- and iqg1/2-null). Similar in vivo KD values are measured in a myoII-null with either wild-type or an assembly-deficient myosin II (myosin II 3xAsp), indicating that the interaction is independent of wild-type myosin II assembly. Negative and positive controls (shaded) are reproduced from B for side by side comparison. Lines represent median values. P-values are derived from Kruskal–Wallis followed by a Wilcoxon-Mann–Whitney test, comparing to the GFP and mCherry negative control. ns, not significant. Data from controls is also shown in Fig. 3. Open circles indicate non-interactors.
Fig. 3.
Fig. 3.
IQGAP1 inhibits the IQGAP2–cortexillin I interaction. (A) FCCS measurement of in vivo KD values demonstrate that IQGAP2 and cortexillin I interact in the cortI-null complemented background, and in the absence of myosin II. The binding is lost in the iqg2-null complemented cell, but the affinity between IQGAP2 and cortexillin I increases significantly in an iqg1/2-null. P values are derived from Kruskal–Wallis followed by a Wilcoxon-Mann–Whitney test as compared to the GFP and mCherry negative control. ns, not significant. Negative and positive controls (shaded) are reproduced from Fig. 2B for side by side comparison. (B) Correlation times in cell lines coexpressing labeled cortexillin I and IQGAP2. The correlation time increases for cortexillin I from the cortI- to iqg1/2-null, and increases for IQGAP2 in both the iqg2- and iqg1/2-null backgrounds, suggesting formation of larger complexes. The correlation time for cortexillin shifts to a bimodal distribution in the iqg2-null (P=0.045 by Hartigans' dip test on log-transformed data), indicating a population of bound and unbound cortexillin I caused by endogenous cortexillin I. *P<0.001. P values are derived from Kruskal–Wallis followed by a Wilcoxon-Mann–Whitney test as compared to the correlation time in the cortI-null background. Open circles indicate non-interactors. Lines represent the median values.
Fig. 4.
Fig. 4.
IQGAP1 and IQGAP2 bind cortexillin I with different stoichiometries. (A) Schematic of SiMPull. Lysate is flowed over a PEG-passivated slide coated with biotinylated antibody bound through NeutrAvidin. Antibody binds one protein that co-precipitates the interacting protein resulting in colocalization of single fluorescent spots imaged by total internal reflection fluorescence (TIRF) microscopy. Merge images of different non-overlapping regions controls for random colocalization. The number of photobleaching steps per fluorescent spot reveals the stoichiometry in the complex. Scale bar: 5 µm. (B) Quantification of complex formation using colocalization. The percentage colocalization of cortexillin I with IQGAPs 1 and 2 indicate complex formation as determined by anti-GFP (green) and anti-RFP (magenta) antibody pulldowns. Colocalization from linked GFP and mCherry and merge of different regions are shown for comparison. (C) GFP, mCherry and the fused GFP–mCherry show ∼20% two-step photobleaching, indicative of a complex with primarily one subunit. 14-3-3–GFP, a stable dimer, has two-fold higher level of two-step photobleaching, reflecting the dynamic range of the technique. Fluorophore maturation accounts for the ∼60% maximum, typical of this technique (Husbands et al., 2016). *P≤0.005 by ANOVA followed by a Fisher's LSD, as compared to the GFP and mCherry monomers. Lines represent median values. The gray line represents the mean+2 s.d. of the GFP and mCherry fluorophores, reflecting a threshold above which medians represent a majority of two molecules per complex. Each data point represents a measurement from a single image, with ∼200–800 molecules per image. At least three images were collected per sample per biological replicate. Number of biological replicates: 14-3-3=1; GFP and mCherry unlinked=2; GFP–mCherry=3; cortexillin I–IQGAP2=3; cortexillin I–IQGAP1=3.
Fig. 5.
Fig. 5.
The network of biochemical interactions in the contractility controller. (A) Schematic depicting non-mechanoresponsive and mechanoresponsive contractility kits (MCKs). Mechanical stress induces increased accumulation of MCKs to the cortex. (B) Mechanobiome map representing protein interactions detected by proteomics and confirmed either by biochemical, genetics or biophysical assays. Apparent in vivo KD values measured by FCCS, and stoichiometries measured by SiMPull. Interactions between RNP1A and cortexillin I and between filamin and IQGAP2 were not detected by mass spectrometry but were demonstrated by FCCS. * Indicates previously measured in vitro KD (Faix et al., 1996). ** Interactions not significantly different from negative control as determined by FCCS.

Similar articles

Cited by

References

    1. Aggarwal V. and Ha T. (2014). Single-molecule pull-down (SiMPull) for new-age biochemistry: methodology and biochemical applications of single-molecule pull-down (SiMPull) for probing biomolecular interactions in crude cell extracts. BioEssays 36, 1109-1119. 10.1002/bies.201400090 - DOI - PubMed
    1. Bacia K. and Schwille P. (2007). Practical guidelines for dual-color fluorescence cross-correlation spectroscopy. Nat. Protoc. 2, 2842-2856. 10.1038/nprot.2007.410 - DOI - PubMed
    1. Bacia K., Kim S. A. and Schwille P. (2006). Fluorescence cross-correlation spectroscopy in living cells. Nat. Methods 3, 83-89. 10.1038/nmeth822 - DOI - PubMed
    1. Bai H., Zhu Q., Surcel A., Luo T., Ren Y., Guan B., Liu Y., Wu N., Joseph N. E., Wang T.-L. et al. (2016). Yes-associated protein impacts adherens junction assembly through regulating actin cytoskeleton organization. Am. J. Physiol. Gastrointest. Liver Physiol. 311, G396-G411. 10.1152/ajpgi.00027.2016 - DOI - PMC - PubMed
    1. Bays J. L., Campbell H. K., Heidema C., Sebbagh M. and DeMali K. A. (2017). Linking E-cadherin mechanotransduction to cell metabolism through force-mediated activation of AMPK. Nat. Cell Biol. 19, 724-731. 10.1038/ncb3537 - DOI - PMC - PubMed

Publication types

MeSH terms